Full text PDF - International Policy Network
Full text PDF - International Policy Network
Full text PDF - International Policy Network
- No tags were found...

You also want an ePaper? Increase the reach of your titles
YUMPU automatically turns print PDFs into web optimized ePapers that Google loves.
Fightingthe Diseasesof PovertyEdited by Philip Stevens
Fighting the Diseases of Poverty
Fighting the Diseases of PovertyEdited byPhilip StevensPublished by <strong>International</strong> <strong>Policy</strong> Pressa division of <strong>International</strong> <strong>Policy</strong> <strong>Network</strong>
Fighting the Diseases of PovertyEdited by Philip StevensFirst published in Great Britain in 2007 by<strong>International</strong> <strong>Policy</strong> Press3rd Floor, Bedford ChambersThe Piazza, Covent GardenLondon WC2E 8HA, UK© of individual chapters retained by contributorsISBN 1-905041-14-4Designed and typeset in Oranda by MacGuru Ltdinfo@macguru.org.ukCover design by Sarah HyndmanPrinted and bound in Great Britain bySunshine PromotionsPO Box 31WesthamBN24 6NZAll rights reserved. Without limiting the rights under copyright reservedabove, no part of this publication may be reproduced, stored or introducedinto a retrieval system, or transmitted, in any form or by any means(electronic, mechanical, photocopying, recording or otherwise), withoutthe prior written permission of both the copyright owner and thepublisher of this book.A CIP catalogue record for this book is available from the British Library.
ContentsIntroductionPhilip Stevens1 Wealth, health and the cycle of progress 1Indur Goklany2 South Africa’s healthcare under threat 36Johan Biermann3 Corruption in public health 63Maureen Lewis4 Diseases of poverty and the 10/90 gap 126Philip Stevens5 Increasing access to medicines 141Prof Khalil Ahmed, Franklin Cudjoe, Eustace Davie,Dr John Kilama, Prof Martín Krause, Andrés Mejia, Barun Mitra,Nonoy Oplas, Martín Simonetta, Philip Stevens, Jose Luis Tapia,Margaret Tse, Jasson Urbach6 Cost effective means of fighting the diseases of poverty 185Prof Khalil Ahmed, Franklin Cudjoe, Eustace Davie,Dr John Kilama, Prof Martín Krause, Andrés Mejia, Barun Mitra,Nonoy Oplas, Martín Simonetta, Philip Stevens, Jose Luis Tapia,Margaret Tse, Jasson Urbach7 Counterfeit medicines in LDCs: problems and solutions 203Philip Stevens and Julian Morris8 The value of vaccination 214David Bloom, David Canning and Mark Weston9 The World Health Organisation: a time for reconstitution 239Prof Richard Wagnerxi
The authorsJohan Biermann is a planning consultant and policy researcher inPretoria, South Africa. Over the last decade he has undertakenresearch for the Free Market Foundation of Southern Africa on theimpact of government planning and regulation on economic developmentand service delivery, including the effect of legislation, regulationand government policy on the delivery of health-care. Hispublished articles on healthcare include Government can reducemedicine prices overnight (2003), Certificates of need are a recipe forchaos (2004), and Health charter perpetuates fallacies (2005). He isthe author of the occasional paper Undermining Mineral Rights: an<strong>International</strong> Comparison (2001) and the briefing paper TownPlanning and the Market (2002), both published by the Free MarketFoundation, of which he is a Council member. Conference papersinclude Planning, Prosperity and the Market (1992), and A Critique ofSocial Health Insurance (2004).David Bloom is Clarence James Gamble Professor of Economicsand Demography at the Harvard School of Public Health. ProfessorBloom has published over eighty articles and books in thefields of economics and demography, and his current researchinterests include labour economics, health, demography, and theenvironment. Professor Bloom has served as a consultant to theUnited Nations Development Programme, the World Bank, theWorld Health Organization, the <strong>International</strong> Labor Organization,the National Academy of Sciences, and the Asian DevelopmentBank. In addition, he is a member of the American ArbitrationAssociation’s Labor Arbitration Panel, and a faculty researchassociate at the National Bureau of Economic Research, where he
viiiFighting the Diseases of Povertyparticipates in the programs on labour studies, health economics,and aging.David Canning is Professor of Economics and <strong>International</strong> Healthat the Harvard School of Public Health. His research focuses on therole of demographic change and health improvements in economicdevelopment. Before taking up his position at the Harvard School ofPublic Health, Professor Canning held faculty positions at theLondon School of Economics, Cambridge University, Columbia University,and Queen’s University Belfast. Professor Canning hasserved as a consultant to the World Health Organization, the WorldBank, and the Asian Development Bank. In addition, he was amember of Working Group One of the World Health Organization’sCommission on Macroeconomics and Health.Indur Goklany is a researcher and manager of science and policyissues at the U.S. Department of the Interior’s Office of <strong>Policy</strong>Analysis. Dr Goklany has written extensively in peer-reviewed literature,has authored and contributed to several books on issues suchas climate change, biodiversity and the relationship betweeneconomic growth and the environment. He was the first JulianSimon Fellow at the Property and Environment Research Center inBozeman, Montana, in the summer of 2000. He also has been aVisiting Fellow at the American Enterprise Institute. His most recentbook, The Improving State of the World: Why We’re Living Longer,Healthier, More Comfortable Lives on a Clean Planet was published in2007. The views expressed in his chapter are his own.Dr Maureen Lewis is a health and development economist for theCenter for Global Development in Washington, DC. Prior to this, shewas chief economist of the World Bank’s Human Development<strong>Network</strong>. She led the team that designed the Bank’s first major HIVproject, in Brazil in 1993. Previously she established and directedthe Urban Institute’s <strong>International</strong> Health and Demographic <strong>Policy</strong>Unit. An Adjunct Professor at the George Washington University,
The authorsixMaureen has published dozens of articles in peer-reviewed journalson health and population. She has a PhD from John Hopkins University,and an MA and BSFS from George Washington University.Julian Morris founded <strong>International</strong> <strong>Policy</strong> <strong>Network</strong> in 2001. He waspreviously the Director of the Institute of Economic Affair’s Environmentand Technology Programme. He has two Masters Degreesin economics and a Graduate Diploma in Law from the University ofWestminster. He is also a Visiting Professor at the University ofBuckingham.Philip Stevens is the director of the health programme at <strong>International</strong><strong>Policy</strong> <strong>Network</strong>, a UK-based development think tank. He is theauthor of numerous health policy publications, including The realdeterminants of health, and Free trade for better health. His writings onhealth policy have appeared in a wide range of international newspapers,and he is a frequent commentator on TV and radio. Philiphas also held research positions at the Adam Smith Institute andReform in London, and spent several years as a management consultant.He holds degrees from the London School of Economics andDurham University.Richard Wagner is Hobart R. Harris Professor of Economics andGraduate Director of the Economics Department of George MasonUniversity. He received his Ph.D. in economics from the Universityof Virginia in 1966. He joined the faculty of George Mason Universityin 1988, after having held positions at the University of California,Irvine, Tulane University, Virginia Polytechnic Institute andState University, Auburn University and Florida State University.Mark Weston is an independent policy consultant specialising ininternational development. His interests include public health,HIV/AIDS, demography, education and corporate social responsibility.
IntroductionBy Philip StevensIn many public health and journalistic circles, it is taken for grantedthat globalisation and market-lead economic growth are underminingpeople’s health, particularly in the poorest countries. HIV/AIDSdominates discussion to the extent that the casual observer wouldbe forgiven for believing it to be the only health problem in Africa.Commentators, academics and activists routinely accompany theirgloomy prognostications with calls for greater intervention by governmentsand global health agencies in the supply and managementof healthcare in less developed countries, to be funded lavishlyby wealthy countries.It is certainly true that far too many people around the world aredying unnecessarily from preventable or curable diseases. But is ittrue that the world’s health is deteriorating as economic globalisationaccelerates? Are the grand plans and strategies executed byinternational intergovernmental organisations such as the UN thebest way to tackle the myriad health problems faced by the world’spoorest people? And why exactly is it that millions of children still dieevery year from easily preventable illnesses that have long been consignedto history in the West? Are governments the most efficientand equitable suppliers of healthcare, or does the market have a role?This book is an attempt to shed some light on these questions.Good news: the world is getting healthierAt this point in history, we appear to be in the grip of a cultural pessimismthat implies not only that things were better in the past, but
xiiFighting the Diseases of Povertyalso that things are set to get much worse unless governments takedrastic action. Such thinking underpins much of the debate abouthealth in less developed countries. Surely with scourges such asHIV/AIDS, malaria and tuberculosis rampant in many parts of theworld, we have no reason to be optimistic about human healthoutside of a few cosseted pockets of the West?Indur Goklany’s chapter demonstrates that such pessimism isunwarranted. At the beginning of the 21st Century, human beingslive longer, healthier lives than at any other time in history. Thistrend is set to continue, as living standards continue to rise andtechnology improves and spreads around the world. Using humandevelopment data from across time and over many countries,Goklany shows how, with some minor hiccoughs, the lot ofhumanity has steadily improved since modern economic growthbegan in the early nineteenth Century.Since around 1820, infant mortality rates and life expectancyhave improved dramatically around the world, and food is moreabundant and inexpensive than ever before. These indicators ofhuman well-being improved particularly noticeably in rich countriesfrom the mid to late 19th century, as water supplies were cleanedup and basic public health measures, such as sanitation, pasteurization,and vaccination were introduced. Then, in the first half ofthe twentieth century, antibiotics, pesticides, and an array ofvaccines were added to the arsenal of weapons against disease.Once the traditional infectious and parasitic diseases were essentiallyconquered, richer countries turned their ingenuity and wealthto dealing with so-called diseases of affluence: cancer, heart diseasesand strokes (plus HIV/AIDS, a non-traditional infectious disease).While these have not yet been entirely defeated, a vast array of newtreatments,drugsandtechnologiesnowexisttomitigatetheireffects.During the second half of the twentieth century, the diffusion oftechnology from the rich to lower-income countries, as well asgreater wealth in the lower-income countries, led to what has beendescribed as the third of three great waves of mortality decline(Gwatkin, 1980).
IntroductionxiiiThis period saw an increase in access to safe water and sanitationservices in lower-income countries. Such access, coupled withincreases in per capita food supplies, basic public health services,greater knowledge of basic hygiene, and newer weapons (such asantibiotics and tests for early diagnosis) were instrumental inreducing mortality rates.As a result of these advances, life expectancies lengthened worldwide,not just in the richest nations. Globally, average lifeexpectancy increased from 46.6 in 1950–1955 to 66.8 years between1950–1955 and 2003, as technology and knowledge was diffusedaround the world (World Bank, 2005).Economic growth, technology and free trade – a cycleof progressThis amazing story has at its roots what Goklany describes as the“mutually reinforcing, co-evolving forces of economic growth, technologicalchange and free trade.” Economic growth is a particularlypotent force for improving health, as was demonstrated by aseminal 1996 study by economists Lant Pritchett and LawrenceSummers. Their research demonstrated a strong causative effect ofincome on infant mortality, showing that if the developing world’sgrowth rate had been 1.5 percentage points higher in the 1980s, halfa million infant deaths would have been averted.When economic growth translates into higher incomes, it allowspeople to invest in cleaner drinking water, proper sewage and sanitation,clean fuel and better nutrition. Currently, water-bornediseases, chest infections caused by using biomass fuels in unventilateddwellings and malnutrition constitute a large proportion ofthe disease burden in the world’s poorest countries. If a country iswealthy, these diseases can easily be overcome by upgrading waterand electrical infrastructure, and by ensuring the population is wellnourished.The improvements in health that prosperity brings can alsohelp to further reinforce and accelerate economic growth. Good
xivFighting the Diseases of Povertynutrition, for example, allows working adults to be more productiveat work and to spend more time generating income. Proper nutritionamongst children improves their cognitive and physical abilityas adults, helping to ensure that the future adult population is economicallyproductive.Healthier people who live longer also have stronger incentives toinvest capital in developing their skills, because they expect toaccrue the benefits over longer periods. So, for example, if a child ismore likely to make it to adulthood, the risk of investing in its educationis reduced. So parents are more likely to make such investments,which tend to raise productivity, and hence income, inadulthood. Improved child health can also reduce the economicburden on both families and governments, freeing up resources forinvestment elsewhere (Karoly et al., 1998).Free trade and healthFree trade is the final part of this ‘cycle of progress.’ Increased crossbordertrade is directly and causatively associated with economicgrowth (Dollar, 1995; Dollar & Kraay, 2001; Frankel & Romer, 1999;Sachs & Warner, 1995), which, as we have seen, is directly beneficialto health. <strong>International</strong> trade also expands competition, forcingcompanies to innovate and drive costs down in order to gain newcompetitive advantages. This helps to bring newer, better productsto more people at lower costs, a process which also explains whymedical technology continues to advance at an incredible pace.Free trade also facilitates the spread of ideas, knowledge andtechnology across borders. The discovery by John Snow in Londonin 1854 that cholera is spread by contaminated water was to havesignificant implications for the prevention of infectious diseasesthroughout the world. This knowledge gradually filtered fromLondon throughout Europe, leading city authorities to upgrade theirwater and sewage systems in order to prevent human waste contaminatingwater supplies (Williamson, 1990). Today, germ theory iswidely understood and recognised by public health authorities allover the world as an important tool for fighting disease.
IntroductionxvSimilarly, lowering the costs of trade can speed up the rate atwhich proven medical technologies can be adopted by other countries.Some of the most effective and simple medicines such asantibiotics and vaccines were first developed in richer countries, butthe international manufacture and trade of such technologies hasallowed them to become readily available and inexpensive in mostparts of the world.The progress made in Asia in the 20th century is a particularlypowerful testament to the ability of trade to improve health. In the1940s, most countries in the region ended several decades ofrelative economic and cultural isolation and began to integrate intothe global economy. Alongside trade in goods came the transfer ofknowledge, technologies and techniques from richer countries, andled to the development of public health programmes. The 1920s to1940s had seen huge advances in pharmacology, including thedevelopment penicillin, sulfa drugs, bacitracin, streptomycin andchloroquine. With the arrival in Asia of these and other drugs, effectivetreatments for the diseases which had once killed millions werenow available at low cost. Furthermore, DDT, invented in 1943,offered a powerful weapon in the fight against malaria, enabling theeradication of the disease from the US and Europe, and near eradication(caseloads reduced by over 99 per cent) in parts of Sri Lankaand India (Gramiccia & Beales, 1988).As a result of the widening availability and decreasing cost ofsuch interventions – made possible by freer trade – crude deathrates dropped steeply, particularly in eastern Asia in the late 1940s.By the 1960s, far fewer children and young people were succumbingto the easily preventable diseases which had historicallyimpacted the health of the region’s people and life expectancy wason the rise (Bloom & Williamson, 1997).This process continues today as new drugs and medicines thatare invented in one place are made available on internationalmarkets. Even though nearly all drugs start their life protected bypatents, these eventually expire, opening the market for genericcompetition. As a result, many off-patent medicines are available
xviFighting the Diseases of Povertythroughout the world at extremely low prices – allowing people inpoorer countries to benefit from the knowledge and innovation ofmore affluent parts of the world. More recent examples of thiswould include antiretroviral drugs and statins, as well as items suchas neonatal intensive care units, kidney dialysis equipment, screeningequipment and myriad other modern medical devices. Of course,many drugs that are on-patent are also subject to competition fromother medicines in the same class. Moreover, with price differentiation,patent drugs are often made available to poorer people atprices close to the cost of production.What about inequality?A frequently cited objection to the arguments made above is thatalthough economic globalisation may indeed improve matters for asmall proportion of the world’s population, it leads inexorably to awidening level of inequality across countries. The fear is that globalisationis causing the poor in many countries to become poorerand, as a consequence, less healthy. Such reasoning has underpinneda number UN Human Development Reports and countlessNGO campaigns calling for greater redistribution of wealth fromrich to poor countries. 1Does the evidence support such concerns? Indur Goklany’sresearch shows that income disparities between countries havewidened since the early 19th century but that these gaps are nownarrowing – especially as economic growth in China and India hasbegun to lift hundreds of millions out of poverty. The numbers ofpeople living in absolute poverty in sub-Saharan Africa have notdeclined, however, mainly because of political mismanagement. Asa result, diseases such as malaria, tuberculosis and other commoninfectious diseases remain rampant, and HIV/AIDS has exploded.This notwithstanding, the health indicators that really matter – lifeexpectancy, infant mortality and hunger – are continuing toconverge globally, making the world a far more equal place healthwisethan it was in 1950, despite the continuing divergence of
Introductionxviiincomes (Kenny, 2005). Although life expectancy has fallen slightlyin sub-Saharan Africa as a result of the reasons outlined above,modest progress is being made with infant mortality rates.Another sub-species of the inequality argument is that incomedisparities within countries are bad for health per se, even if thoseat the lowest end of the socio-economic scale are relatively well-fed,housed and have access to public services, as is the case in mostOECD countries. According to this reasoning, broader economicpolicies have an important role to play in improving health, especiallythose which reduce inequality by facilitating the redistributionof wealth. Such thinking underpins much of the work of theWorld Health Organisation, which in 2005 established a Commissionon the Social Determinants of Health, which is due to report in2008.The premise that economic inequality is deleterious to healthstems from an influential series of studies on health outcomes inthe British civil service in the 1980s and 1990s. These “Whitehallstudies” found a strong association between grade levels of civilservant employment and mortality rates from a range of causes.Men in the lowest grade (messengers, doorkeepers, etc.) were foundto have a mortality rate three times higher than that of men in thehighest grade (Marmot et al., 1984; 1991)The “Whitehall studies” gave empirical backing to the idea thatrelative rather than absolute poverty can be a significant determinantof health. This, it is argued, is largely attributable to negativepsychosocial factors such as stress, which are heightened amongstindividuals further down the social hierarchy in industrialised countries.Stress has been associated with a wide range of healthproblems, including cardiovascular disease – which imposes a greathealth burden on both rich and poor countries alike. As a countrybecomes wealthier, income inequalities often also increase, whichgives rise to the idea that economic growth per se is undesirableunless it is accompanied by strong government measures to ensuregreater income equality.Proponents claim that these studies challenge the idea that the
xviiiFighting the Diseases of Povertybest way to improve health is to maximise economic growth. Suchan approach, it is argued, will do nothing to tackle income and socialinequality, which is in itself a significant determinant of health.Instead, policymakers should aim to foster greater income equalitythrough expanding welfare systems and restricting private employmentpolicies. The theory suggests that subsequent improvementsin the social environment due to reduced income stratification willimprove a population’s psychosocial welfare as well as socialcohesion. This will see concomitant improvements in a wide rangeof physical disorders and thereby contribute to improvements inpopulation health (Wilkinson, 1999).However, such an approach could, in fact, be counterproductive,not least because there is a paucity of evidence that actually linksincome inequality (rather than social stratification) with healthinequalities. This is especially true of lower-income countries. Earlycross-country correlations between life-expectancy and incomeinequality were driven by flawed measures of inequality and areimpossible to reproduce with more credible data (Deaton, 2003).The relationship between income inequality and poor health ismore complex than it appears at face value. For instance, in hisanalysis of data from 42 countries, Adam Wagstaff (2002) finds thatin both rich and poor countries health inequalities rise with risingper capita incomes. This is probably due to in part to the rapidimprovements in health technology that accompany economicgrowth, which are often taken up more speedily by the rich thanthe poor. However, it is important to note that the poorest levelsof society do not get less healthy as the society’s wealthierelements get healthier. Rather, they become healthier at a slightlyslower rate.As such, it is not clear that policies which forcibly redistributewealth from the rich to the poor will actually have a net beneficialeffect on health. As we have already seen, economic growth isstrongly and causatively associated with improved health (Pritchett& Summers, 1996). So, although rising incomes appear to be associatedwith rising health inequalities, they are also associated with
Introductionxixrising overall levels of health. As Wagstaff writes, “the force thatmakes for higher health inequalities – higher per capita incomes –is precisely the same that makes people healthier on average”(Wagstaff, 2002). There is a danger that aggressively redistributivepolicies will stifle economic growth, undermining the very processthat is most associated with improving health.A study conducted by Issidor Noumba (2004) reinforces thishypothesis. Like Wagstaff, Noumba found that the higher theinequality in health and income in a number of African countries,the lower the infant mortality and crude death rates and fertilityindex: “In other words, for African countries, income is relativelymore important for the health of the population than incomeinequality and inequality in health status. Consequently, it is apriority to take measures that accelerate income growth rather thanthose directed to the reduction in inequalities.”Is the state the best provider of healthcare?It is now both clear and generally accepted that the best way toensure economic prosperity is to allow the operation of free andopen markets. Nevertheless, the provision of healthcare is typicallyassumed by politicians and commentators to be too important to beleft to the caprices of the market. As a result, in most countries themajority of formal healthcare provision is controlled by the government.This ranges from direct state funding, to mandatory insurance,to regulation. Governments around the world own andmanage hospitals, employ doctors and nurses, control the supply ofpharmaceuticals, and finance healthcare collectively throughtaxation, social insurance or other mechanisms.The justifications for such intervention are many. Privatelyprovided healthcare is portrayed as divisive and inequitable. Privatehealth insurance is assumed to suffer from ‘adverse selection.’ Bycontrast, state-provided healthcare is seen as an important meansof achieving “universal” access to healthcare, thereby fulfilling thehuman “right” to health, 2 and achieving “social justice.” It is also
xxFighting the Diseases of Povertyoften assumed that the state can achieve better health outcomes atlower financial cost.In recent years, national governments from Accra to Washington,DC have been centralising and collectivising large parts of theirhealthcare systems. An example is South Africa, which has recentlyenacted legislation to centralise and bolster the poorly-performingstate health sector, placing significant restrictions and controls onthe freedom of private sector. Johan Biermann evaluates thesereforms in chapter two, and concludes that they will emasculateSouth Africa’s world-class private sector while leaving the poor inmuch the same position as they are now.Biermann argues that the South African government has ignoredthe problems faced by centrally-planned, state-owned healthsystems the world over. These include: rationing in the form ofwaiting lists; cost-containment through the use of outdated medicaltechnology and pharmaceuticals; shortages; inefficiency; increasedcorruption; decisions made according to political rather than clinicalneeds; an absence of patient choice and capture by producer interests.At a broader level, state healthcare can lead to higher taxes andreduced productivity, which may even feed through into lowereconomic growth, thereby negatively impacting health – especiallyin poorer countries where the association between health andwealth is stronger.Biermann argues that the government should instead be encouraginga massive expansion of the successful private sector so that itcan be accessed by all levels of society – not just the rich. Universalaccess could be accomplished by establishing medical savingsaccounts, by providing vouchers, or by through competitionbetween medical aid funds. Such a reform would remove the dailymanagement and allocation of healthcare from the purview of thegovernment, which has consistently proved incapable of efficientlymanaging the extremely complex and costly business of deliveringhealthcare.
IntroductionxxiCorruption in healthcareSouth Africa’s movement towards a more fully socialised healthcaresystem is in tune with the strategy being promoted by the UN toachieve its Millennium Development Goals, as well as the variousanti-poverty campaigns that have been calling for increased foreignaid. These campaigns are based largely on the premise that the poorhealth and education in lower-income countries is a root cause oftheir poverty, so massive public investments in health and schoolsare needed to make the population more productive, which wouldthen stimulate economic growth. 3While there is a positive feedback effect between health andwealth, there is little evidence that the “big push” governmenthealthcare approach can actually achieve results. A multi-countrystudy by Filmer and Pritchett (1999) showed that public spending onhealth in lower-income countries has only a minute impact on mortality.The authors showed that a significant proportion of deaths ofchildren below five years could be averted for as little as US $10each, yet even in the poorest countries, the average amount spentby governments per child death averted is a staggering US$50,000–$100,000.One of the prime movers behind this failure has been the highlevels of corruption in public health agencies in less developed countries.As a result of this corruption, the proportion of a donor’s contributionthat actually results in delivery of healthcare services(whether they are vaccines or nurses’ salaries) is often very low.Unfortunately, donor and recipient governments have historicallyresponded to healthcare funding needs without first consideringeffectiveness and outcomes. As a result, corruption within thevarious bureaucracies and ministries that administer healthcare inless developed countries has gone largely unaddressed, therebyseverely blunting the effectiveness of donor funding.This is the issue raised by Maureen Lewis in her chapter on“corruption in public health,” which examines the role of governmentinstitutions in healthcare delivery. Her conclusion is thatthe improvements in mortality envisaged by the Millennium
xxiiFighting the Diseases of PovertyDevelopment Goals will be extremely difficult to achieve unless governmentspay more attention to the institutional factors in healthcaresystems that incentivise corruption. Lewis looks at evidencefrom a range of countries over the last decade, and examines manyof the forms of corruption that impede the delivery of healthservices – ranging through bribery, absenteeism, the purchasing ofpublic positions, drug mismanagement and leakage, corruption inthe supply chain, and informal payments. She then goes on tosuggest some strategies for strengthening accountability and transparency.In the end, she concludes, the issue of governance can onlybe addressed by empowering consumers of healthcare by providingthem with better information, by incentivising health staff throughsuch things as targeted training and performance related pay, andby importing commercial management and accounting techniquesinto health systems.What is the greatest health challenge: pharmaceuticalinnovation or distributing existing medicines?The controversy surrounding the role of markets in healthcare doesnot stop at the provision of hospitals and doctors. There is also aconsiderable degree of scepticism about the ability of the market todeliver the drugs that are needed to fight diseases that are specificto lower-income countries. Health activists make much of the factthat billions of dollars are spent researching cures for erectile dysfunctionand baldness, while tropical diseases and other diseases ofpoverty have been relatively neglected by commercial research anddevelopment. This alleged imbalance has become formalised in aconstruct known as the “10/90 gap,” the premise of which is that 90per cent of all health research benefits only 10 per cent of theworld’s population. The implication of the activists’ campaigning isthat profit-driven markets are incapable of meeting the needs of thepoor, who can only be catered for by state-sponsored collectivistmeasures. Such thinking was behind the creation in 2003 of theWorld Health Organization’s Commission on Intellectual Property
IntroductionxxiiiRights, Innovation and Public Health (CIPIH), and the subsequentand (at the time of writing) ongoing Intergovernmental WorkingGroup on Public Health, Innovation and Intellectual Property.This view has become practically orthodox in public healthcircles, but is it justified by the evidence? My chapter reviews thepublicly available data on the global burden of disease (much ofwhich is collated by the World Health Organization) and concludesthat the 10/90 gap is a deeply flawed interpretation of the market’sability to deliver innovative medicines. The data shows that thereare only a handful of diseases that have been truly neglected bymedical research, and that – contrary to popular belief – the diseaseburden of poorer countries increasingly resembles that of rich countries,with chronic diseases accounting for an ever bigger proportionof mortality. New drugs for these diseases are being developedin large numbers, a fact which somewhat undermines those whoreflexively cry ‘market failure.’In fact, the biggest problem faced by lower income countries isnot a lack of suitable drugs, but the widespread inability to distributealready existing, off-patent drugs to the sick. There are manyfactors which actively impede access to medicines, a range of whichare examined by the authors of the chapter on “Increasing Access toMedicines,” a version of which was originally drafted by a coalitionof civil society groups as a response to the CIPIH. In their analysis,the authors discovered that a number of self-generated public policyfailures are responsible for the fact that up to 50 per cent of peoplein parts of Africa and Asia have no access to essential medicines.These include, amongst other things, weak healthcare infrastructures,regulatory environments that are hostile to health insurancemarkets and other risk pooling mechanisms, and taxes, tariffs andprice controls on medicines.This notwithstanding, there is still some need for new medicinesfor less developed countries. Bacterial and viral resistance toexisting medicines is a major problem in treatments for diseasessuch as malaria and tuberculosis (Zumla et al., 2001; Ridley, 2002). Inaddition, specific subpopulations such as pregnant women and
xxivFighting the Diseases of Povertychildren are most at risk from diseases such as malaria, and requiremedicines with specific formulations (Bremen, 2001).The manifold failures in drug distribution are directly related tothe fact that few commercial companies are willing to shoulder therisk of developing these new medicines. If a medicine stands littlechance of actually reaching its intended consumer, there is littlepoint in risking large amounts of capital in developing a drug specificallydesigned for a poorer market. If the barriers to access werelifted, there would be far greater demand for new medicines, whichwould make them a more enticing commercial proposition.Grand plans and political diseasesSince the early 1990s, the United Nations and its various subagencieshave assumed a leadership role in coordinating andmanaging the global response to the HIV/AIDS and malaria pandemics,as well as many other of the health problems that beset lessdeveloped countries. More often that not, however, the UN hasfailed to achieve its self-imposed targets and goals.Moreover, it has failed to contain and reverse pandemics such asHIV/AIDS and malaria, despite being given both a mandate andgenerous resources. Both of these diseases appear to be gettingworse. The UN spent $8.3bn on HIV/AIDS in 2005, yet global HIVprevalence had risen to an estimated 40.3 million people by the endof 2005 (UNAIDS, 2006), from a figure of 34.9 million in 2001(UNAIDS, 2004). 4.1 million people were infected in 2005 alone, anincrease from 3.9 million in 2003. The UN’s efforts to tackle malariahave been equally ineffectual: despite launching the Roll BackMalaria initiative in 1998 with the aim of halving global malariaincidence by 2010, malaria incidence is likely to be increasing.Although problems associated with collecting accurate data make itdifficult to determine precisely how many people suffer frommalaria, in 2002 an external evaluation of RBM set up by the WHOsaid:
Introductionxxv“Anecdotal evidence and the strong consensus among expertssuggests that, at the very least, the malaria burden has notdecreased. What is more likely, and believed to be the case by mostof those involved, is that malaria has got somewhat worse duringthis period” (Malaria Consortium, 2002).The authors of chapter six, ”Cost effective means of reducing thediseases of poverty,” examine some of these UN-sponsored programmesand ask why they have to date been less than successful.In the cases of HIV/AIDS and malaria, the root of the failure lies inserious strategic errors on the part of the planners in control of theprogrammes. With HIV/AIDS, the leaders at UNAIDS and the WorldHealth Organization have consistently prioritised palliative treatmentof people already infected over the prevention of new infections,leading to the depressingly predictable increases in HIVincidence rates.Turning to malaria: the UN’s Roll Back Malaria consortium hasuntil recently underpinned its prevention strategy with the promotionof insecticide-treated bednets, while refusing to endorsedemonstrably more effective methods, such as spraying the interiorsof dwellings with pesticides. The WHO compounded this errorfor several years by recommending the use of ineffective antimalarialdrugs (against the advice of some of its own advisors).The trouble with these grand plans, as the authors of chapter sixshow, is that bureaucrats often have little idea about the realitiesfaced by people on the ground, and are sometimes pressured intomaking questionable strategic decisions by outside political andNGO pressure. The damaging UN policy of prioritising HIV/AIDStreatment, for instance, arose partly as a response to a long andvocal campaign by activists and NGOs. The goal of rolling out ARVtreatment to everyone in need seemed feasible according to thespreadsheet calculations done in Geneva, but it failed to take intoaccount the terrible paucity of health infrastructure in the mostaffected countries. More egregiously, the outside pressure fromNGOs and activists distracted the planners from making decisions
xxviFighting the Diseases of Povertywhich would have been politically unpopular, but more effective atreducing the incidence of HIV/AIDS (such as investing a greater proportionof available resources in prevention).This politicisation of disease is counterproductive: it directsenergy and resources towards the causes championed by the mosteffective and charismatic pressure groups, and away from otherapproaches that do not attract the same level of cheerleading.UNAIDS has estimated that treating HIV/AIDS will require $22.1bnin 2008, or approximately 30 per cent of all Overseas DevelopmentAssistance (ODA) from OECD countries. As more patients becomedrug resistant and are moved onto second-line therapies, the cost ofachieving the UN’s goal of putting 10 million on treatment couldeasily rise to $44bn by 2010 – not including the costs of corruption,recurrent costs, or the lavish running costs of international organisations(and their consultants), which could easily boost this figureto over $62 billion. At around 65 per cent of all ODA spendingglobally (Adelman et al., 2005), this would leave precious little totackle the myriad other diseases which afflict people in less developedcountries.PrioritisationThe politicisation of diseases such as HIV/AIDS has warped globalhealth priorities to the extent that the relatively simple and inexpensiveare often neglected in favour of the complex and expensive.Donors often lose sight of the fact, for instance, that HIV/AIDS isonly one of many health problems faced by less developed countries:the biggest killer of children is chest disorders caused byburning biomass fuels in poorly ventilated homes, followed by diarrhoealdiseases. As the chapter on the “10/90 gap” observed, thesediseases are easy and inexpensive to prevent, but have received relativelylittle attention from the international community.Another area which delivers extremely cost-effective and quickresults is vaccination. Because of vaccination programmes, preventablechildhood diseases such as polio, measles and pertussis
Introductionxxviionly account for 0.2 per cent of DALYs in high-income countries. Alack of such programmes in other parts of the world, however,means that these diseases account for an intolerable 5.2 per cent ofDALYs in high mortality lower income countries (WHO, 2002).Roughly 3 million people die from vaccine-preventable diseasesevery year (Center for Global Development, 2005).Part of the reason why vaccination programmes have been relativelyunder-resourced by the donor community, as David Bloom andhis colleagues argue in their chapter on ‘The value of vaccination’,is that policymakers have tended to look at the narrow benefits ofaverted medical costs, instead of looking at the broader economicadvantages of the healthier population that universal vaccinationwould create. As a result, the steady progress made towards achievinguniversal vaccination coverage in the 1970s and 1980s hasstalled in recent years as other health problems have risen up theinternational agenda.Who’s Health Organisation?This kind of activity should be a priority of transnational healthbureaucracies such as the World Health Organization, arguesRichard Wagner in his provocative final chapter. Wagner associatesthe images of smallpox and Mother Theresa with the WHO: theformer because of the WHO’s role in eradicating this deadly communicabledisease, and the latter because of the body’s commitmentto improving the lives of the poor. But how far does this visionreflect reality?Wagner’s examination of the WHO’s budget for 2006–7 showsthat less than half is spent on communicable diseases, suggestingthe image of smallpox is misrepresentative. In fact, the greatest proportionof the WHO’s resources are spent on issues that are neithertrans-boundary nor of primary concern to the poor, such as roadsafety and obesity. These activities, Wagner argues, are seeminglyintended to satisfy the political demands of the WHO’s funders –predominantly wealthy countries – and to ensure a steady flow of
xxviiiFighting the Diseases of Povertythe funds required to sustain its own bureaucracy. Mother Theresawould not have been proud of the large proportion of the WHO’sbudget (far in excess of 25 per cent) which is devoted to that bureaucracy.One way to refocus the WHO onto the issues that matterwould be to relocate its headquarters from comfortable Genevacloser to the coalface in a less developed country.ConclusionIn these opening years of the 21st century, we should reflect on andbe thankful for how far humanity has travelled in a few short centuries.Vast swathes of people have effectively escaped from hungerand premature death, to paraphrase the work of the Nobel LaureateRobert Fogel. For those countries that have stayed on the marginsof the global economy, there now exists an unprecedented numberof international and national bureaucracies, NGOs and philanthropicorganisations that are dedicated to improving the health of theircitizens.The danger is that often these well-intentioned organisationswill continue to advocate and pursue the same interventionistpolicies that have historically undermined wealth and health in somany parts of the world. In the end, the poorest countries of theworld need self-sustaining, efficient health-care systems that alloweffective distribution of life saving medicines, as well as the propagationof vital health education. Poverty and weak health infrastructurehave the same root causes: corruption and poorgovernance. Solve the latter and you solve the former. The reform ofgovernance structures must therefore be a priority; that meansstrengthening property rights, improving legal systems andentrenching the rule of law. This is the only way to achieve theeconomic growth required to tackle ill-health on a sustainable basis.In the interim, I hope that this book points to a more constructiveway forward, which may make the Declaration of Alma-Ata of“health for all” a reality instead of a utopian fantasy.
1 Wealth, health and thecycle of progressIndur Goklany“If present trends continue, the world in 2000 will be more crowded,more polluted, less stable ecologically, and more vulnerable todisruption than the world we live in now. Serious stresses involvingpopulation, resources, and environment are clearly visible ahead.Despite greater material output, the world’s people will be poorer inmany ways than they are today.”Global 2000 Report to the PresidentIntroductionWith this Neo-Malthusian vision of the future, the Global 2000 Reportto the President (Wrigley & Schofield, 1981) began a chilling descriptionof the problems that lay ahead for the world unless radicalchanges were made. Fifteen years later, Julian Simon (Simon, 1995)quoted these words in his introduction to the monumental collectionof essays, The State of Humanity. The point of that book, whichSimon also edited, was to determine whether trends in human wellbeingand environmental quality were in accord with a Neo-Malthusianworld view.The State of Humanity, in fifty-eight chapters by more than fiftyscholars, documented the tremendous strides in human well-beingover the centuries, as well as trends in natural resource use andenvironmental quality. Based on these discussions, Simon wrote:“Our species is better off in just about every measurable materialway” (Simon, 1995).
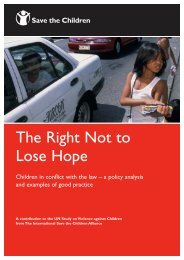
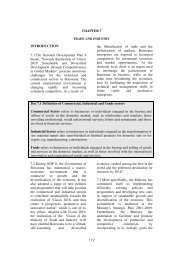
2 Fighting the Diseases of PovertyFigure 1 Global economic development, AD 1–2003Per capita GDP (1990 Int.$)35,00030,00025,00020,00015,00010,0005,000Western EuropeUnited StatesUSSR/Ex-USSRLatin AmericaChinaIndiaJapanAfricaWorld00 400 800 1200 1600 2000Source: Maddison (2005a); GGDC&CB (2005)Yet today anxiety about the future continues. Calls to restructureour economy to avoid the pending insurmountable problems aretypical. “The challenge facing the entire world is to design aneconomy that can satisfy the basic needs of people everywherewithout self-destructing,” said Lester Brown, president of WorldWatch Institute, in 1998 (Brown, 1998).This chapter is a conscious effort to emulate, build upon, andupdate the work of Julian Simon and to provide empirical data tohelp evaluate the heated rhetoric of Lester Brown and other Neo-Malthusian alarmists. While no one can confidently predict thefuture, it is possible to scrutinize the past and present to determinethe current state of humanity and identify which factors havehelped, and which hindered progress.Thus, the goal of this much smaller chapter is to collect in a convenientand portable volume the historical trends for indicators thatare widely used to illustrate human welfare. These trends are presentednot only across time, but, where data are available, across
Wealth, health and the cycle of progress 3countries with different levels of economic development. In somecases, the data go back to when modern economic growth began –around 1800 or even earlier (see Figure 1) (Maddison, 1999a; 2005a;GGDG 1981). 1This chapter will address whether and to what extent moderneconomic growth has improved humanity’s lot, using the followingindicators.◆◆◆◆◆◆Available food supplies per capita. Having sufficient food is thefirst step to a healthy society. It enables the average person tolive a productive life, while hunger and undernourishmentretard education and the development of human capital,slowing down technological change and economic growth.Life expectancy. To most people, this is the single mostvaluable indicator of human well-being. Longer lifeexpectancy is also generally accompanied by an increase indisability-free years.Infant mortality. Throughout history, high levels of death inearly childhood have produced enormous sorrow, reducedpopulation growth, and lengthened the time spent by womenin child-bearing.Economic development. Gross domestic product (GDP) per capitais a measure of people’s income. Thus, it measures the wealthor level of economic development of a country. While wealth isnot an end in itself, it indicates how well a nation can achievethe ends its people desire, from greater availability of food, safewater, and sanitation to higher levels of education and healthcare.Education. While education is an end in itself, it also adds tohuman capital and can accelerate the creation and diffusion oftechnology. Education (particularly of women) helps to spreadknowledge about nutrition and public health practices.Political rights and economic freedom. The ability to conductone’s life creatively and productively usually depends onhaving political rights and economic freedom. They are critical
4 Fighting the Diseases of Poverty◆to maintaining liberty and the pursuit of happiness, which areamong the inalienable rights of human beings.A composite human development index. Using an approachsimilar to that employed in the United Nations DevelopmentProgram (UNDP), this index combines indicators for lifeexpectancy, education, and per capita income (UNDP, 2000). 2After examining trends in the above indicators, this chapter willaddress whether differences in human well-being have widenedbetween developed and developing countries and whether urbanresidents fare worse than rural residents. Finally, it will discuss thefactors that appear to be responsible for the remarkable cycle ofprogress that has accompanied modern economic growth.Hunger and undernourishmentConcerns about the world’s ability to feed its burgeoning populationhave been around at least since Thomas Malthus’s “Essay onthe Principle of Population” two hundred years ago. Several Neo-Malthusians of the twentieth century confidently predicted apocalypticfamines in the latter part of the century in the developingcountries (Ehrlich, 1968; Paddock & Paddock, 1967). But even thoughthe world’s population is the largest it has ever been, the averageperson has never been better fed.Since 1950, the global population has increased by 150 per cent(FAO, 2005), increasing the demand for food, but at the same timethe real price of food commodities has declined 75 per cent (Mitchell& Ingco, 1995; World Resource Institute, 1998; World Bank, 2005).Greater agricultural productivity and international trade have madethis possible (Goklany, 1998). As a result, average daily food suppliesper person increased 24 per cent globally from 1961 to 2002, as indicatedby Table 1. The increase for developing countries was evenlarger, 38 per cent. The decline in real prices, moreover, increasedthe availability of food for people in the lower rungs of the economicladder.
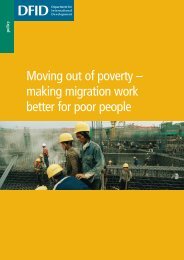
Wealth, health and the cycle of progress 5Table 1 Daily food supplies (Kcal/capita/day), c. 1800-2002Year(s)Pre- or earlyindustrialphase ab 1961 1975 1989 2002France 1,753 (1790) 3,194 3,247 3,563 3,654Developed countries 1,928 3,147 3,308 3,314Eastern Europe 3,118 3,412 3,436 3,194India 1,635 (1950–51) 2,072 1,942 2,417 2,459China 2,115 (1947–48) c 1,641 2,090 2,642 2,951Developing countries 1,930 2,144 2,519 2,666Sub-Saharan Africa 2,055 2,065 2,093 2,207World 2,254 2,422 2,710 2,804a Data are for the year(s) shown in brackets.b Many developing countries, e.g., India and China, barely embarked uponindustrialization until after World War II.c Based upon data for 22 provinces.Sources: Burnette and Mokyr (1995); Fogel (1995); Goklany (1999a); WRI (2005)The Food and Agriculture Organization estimates the minimumdaily energy requirement for maintaining health and body weightand engaging in light physical activity to be between 1,720 and1,960 Calories (properly, kilocalories) per person per day (FAO, 1996).Adding to this threshold an allowance for moderate activity resultsin an estimate of the national average requirement from 2,000 to2,310 Calories per person per day. (This assumes equal food provisionsare likely to be equally available to the population.)The improvements in the food situation in India and China sincethe middle of the twentieth century are especially remarkable. By2002, China’s food supplies had gone up 80 per cent from a barelysubsistence level of 1,636 Calories per person per day in 1961.India’s food supplies went up 50 per cent from 1,635 Calories perperson per day in 1950–51. Between 1969–71 and 2000–02 suchincreases in food supplies helped reduce the number of chronicallyundernourished people in developing countries from 956 million to815 million (or from 37 per cent to 17 per cent of their population)despite an 83 per cent growth in population (FAO, 2002; 2004; 2005).Figure 2, based on cross-country data for 1975 and 2002 from the
6 Fighting the Diseases of PovertyFigure 2 Food supplies per capita vs. income, 1975–20024,0003,500Kcals/capita/day3,0002,5002,0001,500fs1975fs2002fsp1975fsp20020 10,000 20,000 30,000 40,000 50,000 60,000GDP per capita (2000 <strong>International</strong> $, PPP)Source: Based on data from World Resources Institute (2005), World Bank (2005b)World Resources Institute and the World Bank 3 shows that availabledaily food supplies per capita (FS) increase with both GDP per capita– a surrogate for per capita income (or “income” or “affluence”) –and the passage of time. 4 The upward slope for each year probablyreflects the fact that the wealthier the country, the greater its abilityto afford more productive technologies to increase crop yields orpurchase food in the global market through trade. The upward shiftof the available food supply curve from 1975 to 2002 is consistentwith the fact that for any given level of resources (represented byGDP per capita), over time food production increased largely due totechnological change. 5According to Figure 2, if a hypothetical country’s per capitaincome were frozen at $1 per day (in 2000 <strong>International</strong> dollars),available daily food supplies would have increased from 1,652 to1,818 calories per capita per day from 1975 to 2002, an increase of10.0 per cent, due to technological change alone. And if income wereincreased to from $1 to $2 per day in 2002, available daily food
Wealth, health and the cycle of progress 7supplies would rise a further 13.5 per cent to 2,064 calories percapita. Thus, if a country had doubled its per capita income between1975 and 2002 (equivalent to an annual economic growth rate of 2.6per cent), available food supplies per capita would have increased by25 per cent.Life expectancyLife expectancy at birth is probably the single most important indicatorof human well-being. For much of human history, lifeexpectancy was between 20 to 30 years (Preston, 1995). By2000–2005 it had increased to 66.8 years worldwide, as Table 2 indicates(World Bank, 200?). For the wealthiest group of nations, theOrganization for Economic and Cooperative Development (OECD),life expectancy at birth was 78.5 years in 2003 (World Bank, 2005b).Life expectancy in the countries that are developed today fluctuatedin the early nineteenth century, followed by small declines in themiddle two quarters of the nineteenth century. Then, with a fewnotable exceptions and some minor fluctuations, it began a sustainedimprovement that continues to this day.In England and Wales, life expectancy was 35.9 years in 1801.After some ups and downs, it increased to 40.8 years in 1831 but thendeclined to 39.5 in 1851. After further fluctuations in the range of40.2 to 41.2 years, it has been climbing since 1871 (Floud & Harris,1997). The same broad pattern seems to fit the United States from the1850s to the present, with steady improvements from 1880 onwards(Haines, 1994). The nineteenth century fluctuations were probablydue to a combination of factors. Urbanization, ignorance of germs,and poor sanitation helped spread infectious and parasitic diseasessuch as cholera, smallpox, malaria, tuberculosis and typhoid.Once solutions to these diseases were identified – in some casesbefore understanding their causes – nations cleaned up their watersupplies and instituted basic public health measures, such as sanitation,pasteurization, and vaccination. Mortality rates droppedrapidly in the late nineteenth and early twentieth century.
8 Fighting the Diseases of PovertyTable 2 Life expectancy at birth (in years) from the Middle Ages to 2003Year(s) Middle Pre- or 1900 d 1950–55 e 1975–80 e 1985–90 e 2003 fages earlyindustrialphase abFrance ~30 47 66.5 73.7 76.0 79.4(1800)UK 20–30 35.9 50 69.2 72.8 75.0 78.3(1799–1803) cDeveloped countries 20–30 66.1 72.3 74.1 75.6 dEastern Europe 64.2 69.5 70.3 67.9 dIndia 24–25 24 38.7 53.3 57.2 63.1(1901–11)China 25–35 40.8 65.3 67.1 71.5(1929–31)Sub-Saharan Africa 37.4 47.2 49.4 45.9Developing countries 41.1 56.9 60.4 63.4 dWorld 20–30 30 46.6 59.9 62.9 65.4a Data are for the year(s) shown in brackets.b Many developing countries, e.g., India and China, had barely embarked upon industrialization until after World War II.c 1799–1803 data are for England and Wales, only. d Maddison (1999b). e UNPD (2004). f World Bank (2005b).Sources: Wrigley and Schofield (1981); Preston (1995); Lee and Feng (1999); Maddison (1999b); UNPD (2004); World Bank (2005b)
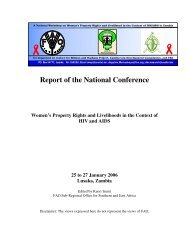
Wealth, health and the cycle of progress 9Figure 3 Access to safe water vs. income, 1990–2002100% population with access80604020asw1990asw2002aswt1990aswt20020 5,000 10,000 15,000 20,000GDP per capita (2000 <strong>International</strong> $, PPP)Source: Based on data from World Bank (2005b)Then, in the first half of the twentieth century, antibiotics, pesticidessuch as DDT and an array of vaccines were added to thearsenal of weapons against disease. Once the traditional infectiousand parasitic diseases were essentially conquered, the developedcountries turned to dealing with so-called diseases of affluence:cancer, heart diseases and strokes (plus HIV/AIDS, a nontraditionalinfectious disease).During the second half of the twentieth century, the diffusion oftechnology from the developed to developing countries, as well asgreater wealth in the developing countries, increased access to safewater and sanitation services in developing countries. Figure 3shows the increase in access to safe water (ASW) between 1990 and2002. 6 It indicates that if a country were to go from a per capitaincome of $1 a day to $2 a day that would have increased access tosafe water from 39.1 per cent of the population to 47.7 per cent in1990, and from 41.7 to 50.9 per cent in 2002.Such access, coupled with increases in per capita food supplies, 7
10 Fighting the Diseases of PovertyFigure 4 Life expectancy vs. income, 1977–20039080Life expectancy (yrs)7060504030le1977le2003lep1977lep20030 10,000 20,000 30,000 40,000 50,000 60,000GDP per capita (2000 <strong>International</strong> $, PPP)Source: Based on data from World Bank (2005b)basic public health services, greater knowledge of basic hygiene,and newer weapons (such as antibiotics and tests for early diagnosis)reduced mortality rates. 8 As a result of such advances, lifeexpectancies lengthened worldwide, not just in the richest nations.Average global life expectancy increased from 46.6 in 1950–1955 to66.8 years between 1950–1955 and 2003, as technology, includingknowledge, was diffused around the world (World Bank, 2005b).Figure 4 shows, using data for 1977 and 2003, that lifeexpectancy increases as GDP per capita increases. 9 Like the previousfigures, it also shows the gains from technological change with thepassage of time. A hypothetical doubling of GDP per capita from adollar to two dollars a day would increase life expectancy from 40.7to 46.2 years in 1977, and from 44.6 to 50.2 years in 2003. Thus, atthese levels of affluence the gain from technological changebetween 1975 and 2003 is 3.9–4.0 years.Figure 4 also suggests that because of technological changetoday’s developing countries may have higher life expectancies than
Wealth, health and the cycle of progress 11did the developed countries at equivalent levels of income. This,indeed, is the case for China and India, countries once synonymouswith poverty and wretchedness. In 1913 when the United States hada GDP per capita of $5,301 (in 1990 <strong>International</strong>, PPP-adjusteddollars) (Maddison, 2005a), its life expectancy at birth was 52.5years (Bureau of the Census, 1975). In 1977, when China and Indiahad GDP per capita of a mere $895 and $937 respectively (also in1990 <strong>International</strong> dollars) (Maddison, 2005a), they had lifeexpectancies of approximately 65.4 and 52.9 years (World Bank,2005b).Not only are we living longer; we are also healthier (OECD, 1998;Shalala, 1998). Disability in the older populations of such developednations as the United States, Canada, and France has been declining(U.S. Department of Health and Human Service, 1997). In the UnitedStates, for instance, the disability rate dropped 1.3 per cent per yearbetween 1982 and 1994 for persons aged 65 and over.Robert W. Fogel, the Nobel Prize-winning economic historian,notes that age-specific prevalence rates of specific chronic diseasesand disabilities were much higher in the century preceding WorldWar II than they are today. White males aged 60–64 are two-and-ahalftimes more likely to be free of chronic diseases today than theircounterparts of a century ago. During the course of the twentiethcentury, the onset of chronic diseases has been significantly delayed– by 9 years for heart diseases, about 11 years for respiratorydiseases (despite higher smoking rates), and nearly 8 years forcancers (Fogel, 2003). 10According to the World Health Organization, health-adjusted lifeexpectancy (HALE) for the U.S., China and India, were 69.3, 64.1 and53.5 years, respectively, in 2002 (WHO, 2004). 11 This is substantiallymore than these countries’ corresponding total life expectanciesbefore industrialization (see Table 2).Figure 5 shows trends in life expectancies from the years1950–55 to 2003 for various income groups and other entities. 12Although life expectancy has on average increased worldwide sincethe 1950s, more recently there have been dramatic declines in many
12 Fighting the Diseases of PovertyFigure 5 Life expectancy 1950–200380High incomeMiddle incomeLow incomeRussiaSub-Saharan AfricaZambiaWorld70Years605040301950 1960 1970 1980 1990 2000Source: World Bank (2005b), WRI (2005)areas of Sub-Saharan Africa as well as less pronounced declines inRussia (Becker & Bloom, 1998) (which is somewhat representative ofthe former Soviet Union.Russia’s decline since the late 1980s in large part reflectseconomic deterioration concurrent with , and following, the fall ofthe communist government. Between 1989 and 1998, GDP percapita (in 1990 <strong>International</strong> dollars) declined 44 per cent before itrebounded (GGDC&CB, 2005). However, in 2003 it was still 21 percent below its 1989 level. Yields of cereal, which represent 50 percent of all crops, fell, and food supplies per capita, nutritional levels,and public health services all declined (Goklany, 1998). Alcoholismincreased, as did accidental deaths, homicides, hypertension andsuicides (Becker & Bloom, 1998). Life expectancies similarly declinedin other countries in Eastern Europe and the former Soviet Union.
Wealth, health and the cycle of progress 13Table 3 Infant mortality (200 59.1 21.4 12.7 7.1 cRussia 97.5 27.7 23.7 16.0China 195.0 61.1 50.0 33.0India 190.0 132 94.5 63.0Developing countries 179.8 104.7 77.9 62.4 cSub-Saharan Africa 177.0 134.2 112.4 101.0World >200 156.9 93.2 70.4 56.8a Data are for the year(s) shown in brackets.b Many developing countries, e.g., India and China, had barely embarked uponindustrialization until after World War II.c Based on UNPD (2004).d Based on World Bank (2005b).Sources: Mitchell (1992); Hill (1995); UNPD (2004); World Bank (2005b)However, they have rebounded in the former region, as well as inmany countries in the former Soviet Union (World Bank, 2005b).Life expectancies have dropped much more dramatically sincethe late 1980s in a number of Sub-Saharan countries, due to avicious cycle involving new and resurgent diseases, particularly,malaria, HIV/AIDS and tuberculosis, and a drop in economic output(UNDP, 2000). No country for which data are readily available hashad a steeper decline than Zambia.Infant mortalityBefore industrialization, at least one out of every five children diedbefore reaching his or her first birthday. As Table 3 shows, infantmortality, measured as the number of children dying before reaching
14 Fighting the Diseases of PovertyFigure 6 Infant mortality vs. income, 1980–2003Deaths per 1,000 live births25020015010050im1980im2003imp1980imp200300 5,000 10,000 15,000 20,000 25,000 30,000Source: Based on data from World Bank (2005b)GDP per capita (2000 <strong>International</strong> $, PPP)one year, typically exceeded 200 per 1,000 live births (Hill, 1995).The rate fell to 57 worldwide in 2003 (World Bank, 2005b). This isroughly the same level that more developed countries had reachedin the 1950–55 period (World Research Institute, 1998; UN 2000). Inthe United States, as late as 1900, infant mortality was about 160;in 2004, it was about 6.6 (Bureau of the Census, 1975; NCHS, 2005a).In the developing countries, the declines started later but may beoccurring more rapidly in some areas. For instance, between1950–55 and 2003, India’s infant mortality fell from 190 to 63, andChina’s from 195 to 30 (UNPD, 2004a; World Bank, 2005b).These declines were most likely due to a combination of greatereconomic development and technological factors, including widerknowledge about the factors that contribute to infant mortality andhow to reduce them. 13 Figure 6, which uses data for 1980 and 2003from World Bank (2005b), shows that infant mortality drops withgreater affluence and with time. 14 According to this figure, if a hypotheticalcountry doubled its GDP per capita from a dollar to two
Wealth, health and the cycle of progress 15dollars a day it would have decreased infant mortality from 355deaths per 1,000 live births to 199 in 1980, and from 207 to 116 in2003.The declines in infant mortality were accompanied by declines inmaternal mortality that were equally, if not more, spectacular. In theUnited States, for instance, while infant mortality rates declinedfrom around 100 per 1,000 live births in 1915 to 6.8 in 2001,maternal mortality rates declined from 220 per 100,000 live birthsto 9.9 (Bureau of the Census, 1975; 2004).Economic developmentLong term trends in economic growth, based on data fromMaddison, are shown in Table 4 for various countries and regionsincluding the United States, India, China, Japan, Europe, LatinAmerica, Africa, the former Soviet Union and the world (Maddison,2005; GGDCECB, 200?). While these estimates are less than precise,they do indicate that for most of this millennium, GDP per capitaworldwide was below $600, measured in 1990 international dollars.Acceleration of economic growth began around 1800 and has beendramatic in recent years (see Figure 1). Today, it is more than tentimes that (see Figure 5).At the same time, the cost of basic necessities such as food hasdeclined substantially in the last few decades in real (constantdollar) terms. More importantly, they have declined relative toincome levels. For instance, between the years 1897 to 1901 and2001 to 2003, U.S. retail prices of flour, bacon, and potatoes relativeto per capita income dropped by 92 per cent, 85 per cent, and 82 percent, respectively (Bureau of the Census, 1975; 2004).Not only are basic necessities cheaper and the average person’sannual income higher, but workers spend fewer hours on the job.Between 1820 and 2001, average hours worked per personemployed declined 39, 20, and 45 per cent for the U.K., U.S., andJapan, respectively (Maddison, 2005). Ausubel and Grübler estimatethat for the average British worker, total life hours worked declined
16 Fighting the Diseases of PovertyTable 4 Gross domestic product per capita (in 1990 <strong>International</strong> $, PPP-adjusted), A.D. 0–2003Year 1 1000 1500 1700 1820 1913 1950 1989 1996 2001 2003 cWestern Europe 450 400 771 998 1,204 3,458 4,579 15,856 17,097 19,256United States 400A 400 a 400 527 1,257 5,301 9,561 23,059 25,066 27,948 28,797USSR/Ex-USSR 400 400 499 610 688 1,488 2,841 7,098 3,854 4,626 5,267Latin America 400 400 413B 441 b 692 1,481 2,506 5,123 5,556 5,811China 450 450 600 600 600 552 439 1,827 2,820 3,583 4,185India 450 450 550 550 533 673 619 1,270 1,630 1,957 2,194Japan 400 425 500 570 669 1,387 1,921 17,942 20,494 20,683 21,104Africa 430 425 414 421 420 637 894 1,463 1,403 1,489World 445 436 566 615 667 1,525 2,111 5,140 5,517 6,049a Based on Maddison (1999a) estimate for “North America.”b Based on the arithmetical average for Brazil and Mexico.c Based on GGDC (2005), adjusted per Maddison (2005a).Source: Maddison (2005a); GGDC (2005)
Wealth, health and the cycle of progress 17Figure 7 Global economic development, AD 1950–2003Per capita GDP (1990 Int.$)35,00030,00025,00020,00015,00010,0005,000Western EuropeUnited StatesUSSR/Ex-USSRLatin AmericaChinaIndiaJapanAfricaWorld01950 1960 1970 1980 1990 2000Source: Maddison (2005a); GGDC&CB (2005)from 124,000 in 1856 to 69,000 in 1981 (Ausubel & Grübler, 1995).Because the average Briton lives longer and works fewer hours eachyear, the life hours worked by the average British worker hasdeclined from 50 per cent to 20 per cent of his or her disposable lifehours. In other words, the average person has more disposable timefor leisure, hobbies, and personal development.Thus, trends in real wages measured in dollars per hour wouldshow an even more dramatic improvement than the incomegrowth shown in Figure 7. Between 1820 and 2001 GDP per manhourfor the U.K., U.S., and Japan increased 19-, 28- and 56-fold,respectively (Maddison, 2005b). However, even these trends substantiallyunderestimate the true improvements in economic wellbeingbecause methods to convert current dollars in one year toreal dollars in another year are not robust when there has been a
18 Fighting the Diseases of PovertyFigure 8 Post-secondary schooling vs. income, 1990–2002Enrolment (as % of eligible pop.)1009080706050403020100ed1990ed2002edp1990edp20020 5,000 10,000 15,000 20,000 25,000 30,000GDP per capita (2000 <strong>International</strong> $, PPP)Source: Based on data from World Bank (2005b)vast technological change between the two years. Goods andservices available in the year 1950, for instance, were vastly differentfrom those available in 1995. Personal computers, cell phones,VCRs, and instant access to the Library of Congress’s electronic catalogue,to mention a few, simply were not available in 1950. Today,for a few hundred dollars people can buy goods and services theycould not imagine, let alone buy for all the money in the world evena generation or two ago.Education and child laborFigure 8 shows that the per cent of the eligible population enrolledin postsecondary education increased with time and with affluenceacross a range of countries (World Bank 1999). 15 Table 5 shows longtermimprovements in the levels of education for the United States,France, China, and India based on data from Maddison (Maddison,1995; 1998). Globally, postsecondary enrolment increased from 6.8
Wealth, health and the cycle of progress 19Table 5 Education (average number of years per person aged 15–64), c. 1820–20011820 1870 1913 1950 1973 1992 2001France 6.99 9.58 11.69 15.96UK 2.00 4.44 8.82 10.60 11.66 14.09 15.45USA 1.75 3.92 7.86 11.27 14.58 18.04 20.21Japan 1.50 1.50 5.36 9.11 12.09 14.87 16.61India 1.35 2.60 5.55China 1.60 4.09 8.93Sources: Maddison (1995, 1998, 2005b).
20 Fighting the Diseases of PovertyFigure 9 Average income vs. economic freedom index, 2002Per capita income (PPP, 2002 US$)28,00024,00020,00016,00012,0008,0004,000026,10614,4616,5515,2852,8281st 2nd 3rd 4th 5thEconomic freedom index quintileSource: Gwartney & Lawson (2004)per cent in 1965 (World Bank 1999) to 25.6 per cent in 2001 (WorldBank 2005a).Literacy has increased worldwide as well. Between 1970 and theearly 2000s, global illiteracy rates dropped from 46 per cent to 18per cent (World Bank, 2005b; UNESCO, 2005). Complementing theseincreases are declines in the portion of the population aged 10 to 14years who are working. Worldwide child labor measured this wayhas declined from 24.9 per cent in 1960 to 10.5 per cent in 2003(World Bank, 2005b).Political and economic freedomIn 1900, no country had universal adult suffrage; and only 12.4 percent of the world’s population enjoyed even limited democracy(Freedom House, 2002). Today 44.1 per cent of the world’s populationis deemed free by Freedom House, while another 18.6 per centis considered partly free (Freedom House, 2005). Multiparty electoral
Wealth, health and the cycle of progress 21systems were introduced in 113 countries in the quarter century following1974 (UNDP, 2000).Economic freedom is also ascendant around the world. Gwartneyand his coworkers have constructed an index of economic freedomthat takes into consideration personal choice, protection of privateproperty, and freedom to use, exchange, or give property to another.According to this index, economic freedom increased from 1990 to2002 in 102 of the 113 countries for which they had data for bothyears (Gwartney & Lawson, 2004; Gwartney, 1998). Their analysisindicates that the more economically free a country’s population,the higher its economic growth (see Figure 9).Human development indexWhile the above indicators make a strong case for a steady increasein many aspects of human well-being, it is possible to create asingle indicator that incorporates a number of key measurementsof well-being. The United Nations Development Program (UNDP)has popularized this approach with its Human Development Index.This index is based on life expectancy, education, and GDP percapita. 16According to the UNDP’s latest Human Development Report, theHuman Development Index (HDI) has been going up for most countries(UNDP, 2004). This index is somewhat arbitrary. It probablyunderstates improvements for the majority of the world’s populationbecause it omits measurements of hunger and infant mortality,both of which have improved for the majority of the world’s population.Nevertheless, the data show that:◆All but three of the 102 countries for which data are availableshowed improvement in the human development indexbetween 1975 and 2002. The exceptions – Zambia, Zimbabwe,the Democratic Republic of Congo – were all in Sub-SaharanAfrica. Each had increased its HDI between 1975 and 1985 (dueto longer life expectancy and higher literacy rates despite a
22 Fighting the Diseases of Povertydecline in GDP per capita). 17 However, these gains have beenmore than erased since then due to continuing economicdeclines in affluence, lower life expectancy due to HIV/AIDSand the resurgence of malaria, and the conflict in theDemocratic Republic of Congo (which Zimbabwe chose toinvolve itself in, and which created refugee problems inneighboring countries, including Zambia) (Daily Mail andGuardian, 1998; UN High Commission on Refugees, 1998;1999a; 1999b). Intermittent droughts and their effects,exacerbated by poor governance, also contributed to declinesin Zambia and, to a greater extent, in Zimbabwe.◆ Twenty of the 138 countries with available data showed adecline in HDI between 1990 and 2002. The majority of thesecountries (thirteen) were in Sub-Saharan Africa. For this set ofcountries too, the declines could be attributed to HIV/AIDS,resurgent malaria, and, in some areas, declining affluence aswell as the direct or indirect effects of conflict within – or innearby – countries.◆ Of the 20 countries that had lower HDIs in 2002 than in 1990(based on UNDP data), five were in the former Soviet Union;none were in Eastern Europe. Following the collapse of thecommunist regimes in Eastern Europe and the former SovietUnion, the drop in affluence in those areas accompanied by thedeterioration in health status led to a decline in their HDIs.However, by the mid- to late-1990s, the economic situation inthese countries had bottomed out. As a result, despite drops inthe early-1990s, a number of these countries had higher HDIsin 2002 than in 1990.◆ The remaining two countries with HDIs known to be lower in2002 than 1990 were the Bahamas and Belize. Their declines,which were relatively minor, had nevertheless been reversed bythe mid- to late-1990s.In summary, the data indicate that human well-being hasimproved and continues to improve for the majority of the world’s
Wealth, health and the cycle of progress 23population. Over the past 15 to 20 years, however, well-being hasbeen reduced in many Sub-Saharan, and continues to deteriorate.On the other hand, while matters had also regressed in EasternEuropean and the former Soviet Union nations, they now seem to berebounding. These broad regional trends can be grasped when oneconsiders that between the mid-1970s and the early-2000s:◆◆Affluence broadly advanced around the world for most incomeand regional groups with some exceptions – major oilexporting countries, 18 Sub-Saharan Africa, the former SovietUnion and a handful of Latin American countries (e.g.,Nicaragua, Honduras, Peru, Bolivia and Argentina) (GGDC&CB2005; World Bank 2005b; see also Figure 7). A common threadfor the last three groups was that they all suffered frominternal conflicts and/or failed economic policies.Life expectancy also increased generally around the worldexcept in Sub-Saharan Africa and some areas in the formerSoviet Union (see Figure 5).The critical factor underlying declines in HDI is the lethal combinationof deteriorating wealth exacerbated by serious publichealth problems (e.g., deadly new diseases such as HIV/AIDS orresurgent diseases such as malaria and tuberculosis), and vice versa.This is most painfully illustrated by the experience of Sub-Saharancountries.When AIDS first appeared, it resulted in almost certain death.Developed countries, particularly the United States, launched amassive assault on the disease. U.S. deaths due to HIV/AIDS droppedfrom a high of approximately 52,000 in 1995 to 19,000 in 1998(Centers for Disease Control and Prevention, 2002; 2003, 2005;Martin et al., 1999). Since then fatalities have leveled off at around18,000 per year. In 1996, HIV/AIDS was the eighth leading cause ofdeath in the U.S.; by 1998 it had dropped off the worst-fifteen list.But similar improvement is unlikely to occur soon in Sub-Saharancountries because they cannot afford the cost of treatment unless
24 Fighting the Diseases of PovertyFigure 10 Human development index, US, 1850–2002Value of index, max = 11.00.80.60.40.2Life expectancyLiteracyGDP/capHDI0.01850 1900 1950 2000YearSource: see <strong>text</strong>it’s subsidized by the governments, charities, or industry from thericher nations.For the United States, I have constructed an index similar to theHDI. Instead of education per se, I use literacy data, which are morereadily available. 19 The minimum value for each of the three componentscorresponds roughly to what it was around 1820, approximatelythe start of industrialization. These are: 30 years for lifeexpectancy, 73.7 per cent for literacy, and $1,257 (in 1990 <strong>International</strong>dollars) for GDP per capita (Costa & Stecker, 1997; Maddison,2005a). For the maximum values, I assume 85 years, 100 per cent,and $40,000, respectively, similar to what UNDP assumes in itsHuman Development Reports (UNDP, 2000). My index assumes thatliteracy stays at 99 per cent after 1970. This actually understates thelevel of improvement since it does not account for long-termincreases in the educational level of the average American. Based onthese assumptions, Figure 10 shows trends in the composite HDIand its individual components for the United States from
Wealth, health and the cycle of progress 251870–2002. Despite minor fluctuations in the components, therehas been a general improvement in overall human well-being in theUnited States during the twentieth century. Each componentimproved throughout the century except for literacy, which reachedsaturation around 1970.Have gaps in human well-being widened?While human well-being has improved continually over the pasttwo centuries, it is often claimed that inequalities continue to widenbetween the developed and developing nations. A typical observationis the following from the United Nations DevelopmentProgram’s 1999 Human Development Report:Nearly 30 years ago the Pearson Commission began its reportwith the recognition that, “the widening gap between the developedand developing countries has become the central problem ofour times.’ But over the past three decades the income gap betweenthe richest fifth and the poorest fifth has more than doubled. Narrowingthe gaps between rich and poor … should become explicitglobal goals …” (UNDP, 1999).As Figure 7 showed, there are wide – and, in many cases,growing – disparities in income between the richer and poorercountries. The gaps in per capita income between Western Europeand the United States and other regions have ballooned since thestart of modern economic growth about two centuries ago, andmany people remain terribly poor (Maddison, 1998; 1999a).However, the increasing gap in incomes between the richer andpoorer countries does not mean that income gaps between allhuman beings in the world, regardless of where they live, is necessarilywidening (Economist, 2004). More importantly, it does notfollow that the well-being of the relatively poor groups is declining.In 2001, according to the World Bank, 1.1 billion people, mainlyin the developing world, lived in “absolute poverty” (defined as subsistingon less than one U.S. dollar per day based on 1993 purchasingpower parity) (Ravallion, 2004). Nevertheless, contrary to
26 Fighting the Diseases of Povertyconventional wisdom (Goklany, 2002), this was an improvementover matters in 1981 when 1.5 billion people fell into that category.In the intervening twenty years the world poverty rate declinedfrom 33 to 18 per cent mainly because of robust economic growthin Asia, especially China and, to a lesser extent, India (Ravallion,2004). On the other hand, the numbers and proportion of the populationliving in absolute poverty has increased in Africa, because ofits generally dismal economic performance and its inability to copenot only with new diseases such as AIDS/HIV but also the morefamiliar diseases of malaria and TB. Other analyses also affirm thatthe number and proportion of people living in absolute poverty hasdeclined worldwide, but not in Sub-Saharan Africa (Sala-i-Martin,2002; Bhalla, 2002). However, they estimate fewer people live inabsolute poverty worldwide than does the World Bank (Economist,2004; Sala-i-Martin, 2002; Bhalla, 2002).Measurements that describe human well-being more directly thanincome show the same general pattern. Yes, gaps in life expectancyand infant mortality between the more and less developed countriesare substantial. But, these gaps have narrowed by 50 percentsince the1950s. The gap in life expectancy was 25.0 years in the 1950–1955 butfell to 12.3 years in the 1995–2000, while the gap in infant mortalityfell from 121 to 59 deaths per 1,000 live births (UNPD, 2004a). Forthese indicators, the gaps between Sub-Saharan Africa and the developedcountries also shrank from the 1950s through the late 1980s,but since then, for reasons already articulated, the life expectancygap has grown substantially (see Table 2 and Figure 5) while theinfant mortality gap continued to shrink, but at a much reduced rate.Similarly, hunger is less prevalent worldwide than it was thirty yearsago, and except for Sub-Saharan Africa the number of people sufferingfrom chronic under-nourishment has declined in both absoluteand relative terms (FAO, 2002; 2004). And with respect to child labor,another critical indicator of human well-being, the gap betweenricher and poorer nations has shrunk since at least 1960. Here, too,the shrinkage has been least for the gap between Sub-Saharan Africaand other income groups (Goklany, 2002).
IndiaWealth, health and the cycle of progress 27Figure 11 Rural (R) vs. Urban (U) divide access to safe waterand sanitation, 2000100R-Safe H2OU-Safe H2OR-SanitationU-Sanitation7550250RussiaSouth AfricaNigeriaMexicoIndonesiaChinaBrazilBoliviaSource: World Resources Institute (2005)Thus, while income inequalities might have widened betweencountries, they seem to have shrunk between people. More importantly,in the aspects of human well-being that are truly critical – lifeexpectancy, infant mortality, hunger – the world is far more equaltoday than it was a half century ago, notwithstanding relapses inSub-Saharan Africa and, to a lesser extent, some countries in theformer Soviet Union.Are rural residents better off?Historically, as the currently developed countries embarked onmodern economic growth, the welfare of urban dwellers generallylagged behind that of their rural compatriots (Easterlin, 1996; Fogel,2000; Lerner & Anderson, 1965). Fogel notes that U.S. cities with
28 Fighting the Diseases of PovertyFigure 12 Cereal yield vs. income, 1975–2003Cereal yield (kg per hectare)10,0008,0006,0004,0002,000cy1975cy2003cyp1975cyp200300 10,000 20,000 30,000 40,000Source: Based on data from World Bank (2005b)GDP per capita (2000 <strong>International</strong> $, PPP)populations above 50,000 had twice the death rates of rural areas inthe 1830s (Fogel, 2000). Evidently, overcrowding, lack of knowledgeabout hygiene, and the lack of safe water and sanitation madeurban populations more susceptible to contagious diseases such ascholera, typhoid and tuberculosis. The image of urban sufferingcompared to a healthier rural life is reinforced in the mind of anyonewho visits the over-crowded and polluted urban areas of the developingworld, which give the impression that life in developing countriesis worsening as cities grow.In fact, however, urban residents are better off in most developingcountries. When measured by the United Nations’ Human DevelopmentIndex and its related Human Poverty Index, there is moreprogress and less deprivation in urban areas (UNDP, 2000). Forinstance, in Swaziland, the rural HDI was 35 per cent below theurban level in 1999, reflecting less access to safe water, sanitationand public health services; lower rates of literacy; and higher ratesof undernourishment. Figure 11 shows the urban–rural divide for
Wealth, health and the cycle of progress 29access to safe water and access to sanitation for 2000 in some oftoday’s more populous developing nations. In each case, rural residentshave lower access.The cycle of progressWe have seen that human welfare advanced more in the pastcentury than it did in all the rest of mankind’s tenure on earth. Icontend that this progress in human well-being was sustained,and perhaps even initiated, by a cycle composed of the mutuallyreinforcing, co-evolving forces of economic growth, technologicalchange and free trade.Technology increases food production through various mechanisms.It boosts yields through special seeds, mechanization, judiciousapplication of inputs such as fertilizers and lime, andreductions of losses to pests, spoilage and wastage. Use of this technologyis closely linked to economic development because noteveryone can afford it. One reason why poorer countries have lowercereal yields is that farmers cannot afford sufficient fertilizer andother yield-enhancing technologies (Goklany, 1998; 2000). Thus wesee in Figure 12 that yields increase over time and with wealth. 20Higher crop yields translate into more food. And if food deficits existdespite increases in domestic production, with greater wealth theycan augment food supplies by purchasing food and agriculturalproducts through trade on the open market (see Figure 2). Thus,global trade in conjunction with improved technology increasesfood security (Goklany, 1995; 1998). The infrastructure – ships,refrigerated trucks, roads, and rails – that trade depends on, as wellas financial mechanisms that transfer money and hedge risks, areproducts of technology, capital, and human resources.More food also means more healthy people who are less likely tosuccumb to infectious and parasitic diseases. That – along withcapital and human resources targeted on improvements in medicineand public health (see Figure 2) – has reduced mortality andincreased life expectancy worldwide (Fogel, 1995; World Health
30 Fighting the Diseases of PovertyOrganisation, 1999). Hence, as populations become more affluent,mortality decreases, as shown in Figure 6 for infant mortality, andlife expectancy increases, as shown in Figure 4 (Goklany, 1999b;Pritchett & Summers, 1996; World Bank 1993). Thus, a wealthierpopulation is healthier.A healthier population is also wealthier because it is more productive(Barro, 1997; Bloom, 1999; Fogel, 1995; World Bank, 1993;World Health Organisation, 1999). Fogel estimates that the level offood supplies in eighteenth century France were so low that thebottom 10 per cent of the labor force could not generate the energyneeded for regular work, and the next 10 per cent had enoughenergy for about half an hour of heavy work (or less than 3 hours oflight work) (Fogel, 1995).Citing a United Nations study, Easterlin notes that when malariawas eradicated in Mymensingh (now in Bangladesh), crop yieldsincreased 15 per cent because farmers could spend more time andeffort on cultivation (Easterlin, 1996). In other areas elimination ofseasonal malaria enabled farmers to plant a second crop. Accordingto the World Bank, the near-eradication of malaria in Sri Lankabetween 1947 and 1977 raised its national income by an estimated9 per cent (World Bank, 199?). A joint study by the Harvard UniversityCenter for <strong>International</strong> Development and the London School ofHygiene and Tropical Medicine estimated that if malaria had beeneradicated in 1965, Africa’s GDP would have been 32 per cent higherby 2000 (Malaria Foundation <strong>International</strong>, 2000; Guardian, 2000).A healthier and longer-lived population is also likely to investmore time and effort in developing its human capital which contributesto the creation and diffusion of technology. It is not surprisingthat levels of education have gone up with life expectancyor that researchers today spend what at one period was literally alifetime to acquire skills and expertise necessary for careers inresearch.In addition, several measures undertaken to improve publichealth provided a bonus in economic productivity. Draining swampsnot only reduced malaria but also added to the agricultural land
Wealth, health and the cycle of progress 31base (Easterlin, 1996). The World Bank reported that an internationalprogram to curtail river blindness, the Onchocersiasis ControlProgram, a mixture of drug therapy and insecticide spraying, hadprotected 30 million people (including 9 million children) from thedisease (World Bank, 1993), and would free up 25 million hectares(60 million acres) of land for cultivation and settlement. Similarly,improved food supplies and nutrition by themselves may aidlearning. This is one of the premises behind school meals programs(Watkins, 1997).Improvements specific to health, food, and agriculture alsobenefit from a larger, more general cycle in which broad technologicalchange, economic growth and global trade reinforce each other.Other technologies – invented for other reasons – have led tomedical advances and improved productivity or reduced the environmentalimpacts of the food and agricultural sector. For example,computers, lasers, and global positioning systems permit precisionagriculture to optimize the timing and quantities of fertilizers,water, and pesticides, increasing productivity while reducing environmentalimpacts. Plastics – essential for food packaging andpreservation – also increase productivity of the food and agriculturalsector. Transportation of every kind increases the ability tomove inputs and outputs from farms to markets, and vice versa.Broad advances in physics and engineering have led to new orimproved medical technologies, including electricity (without whichvirtually no present day hospital or operating room could function),x-rays, nuclear magnetic resonance, lasers and refrigeration.These specific impacts do not exhaust the benefits of broadeconomic growth, technological change and global trade. Technologicalchange in general reinforces economic growth (Barro, 1997;Goklany, 1998), giving countries more resources to research anddevelop technological improvements and to increase education(Goklany, 1995).As Figure 8 showed, the proportion of the eligible populationenrolled in postsecondary schools increases with wealth. Anecdotalevidence reinforces the importance of wealth in developing human
32 Fighting the Diseases of Povertycapital. Wealthy countries have the best education. An informalsurvey of fellow immigrants suggests that many of the mosttalented people from poorer countries end up in the universities andresearch establishments of the richer nations not only because theyexpect a higher quality of education but because they anticipate jobopportunities that will better use their education and talents. In1993, for instance, ten of the richest (and most well-educated) countriesaccounted for 84 per cent of global research and developmentand controlled more than 80 per cent of the patents acquired in theUnited States and in developing countries (UNDP, 1999).Freer trade contributes directly to greater economic growth,helps disseminate new technologies, and creates competitive pressuresto invent and innovate (Goklany, 1995). As an example, tradeaccelerated the cleanup of automobile emissions in the UnitedStates because the threat of cleaner cars from imports advanced theintroduction of catalytic converters in the 1970s (Barbour, 1980;Seskin, 1978).By expanding competition, trade helps contain the costs of basicinfrastructure, including water supply and sanitation systems. Avivid example of the importance of trade in improving human wellbeingcomes from Iraq. Because of trade sanctions, it was unable toproperly operate and maintain its water, sanitation, and electricitysystems, resulting in significant public health problems (UnitedNations, 200?).Trade also helps augment food supplies. In fact, between 2000and 2002, international trade allowed developing countries toenhance their grain supplies by 11.6 per cent (FAO, 2005). 21 The correspondingfigure for Sub-Saharan Africa was 23.5 per cent. Thus, inthe absence of trade, food prices would have been higher (whichwould have priced more poor people out of the market), and hungerand malnutrition would have been more prevalent in developingcountries. Also, cultivation of marginal lands would probably haveincreased to narrow the shortfall between food supply and demand.In terms of income alone, trade raises incomes for both the poorand the rich (Dollar & Kraay, 2000; Frankel & Romer, 1999). Dollar
Wealth, health and the cycle of progress 33and Kraay (Dollar & Kraay, 2000) also find that economic growthfavors rich and poor equally, confirming analyses by Ravallion andChen (Ravallion & Chen, 1997) and Easterly and Rebelo (Easterly &Rebelo, 1993). Similarly, increased protection of property rights andfiscal discipline (defined as low government consumption) raiseoverall incomes without increasing inequality. 112Thus, each link in the cycle – higher yields, increased foodsupplies, lower mortalities and higher life expectancies – isstrengthened by the general forces of economic growth, technologicalchange and trade. Qualitatively, at least, this explains why allthe figures for cereal yields (Figure 12), food supplies per capita(Figure 2), safe water (Figure 3), life expectancy (Figure 4) and postsecondaryeducation (Figure 8) when plotted against per capitaincome look similar, and all look like mirror images of Figure 6 forinfant mortality rates.However, the experience of Sub-Saharan Africa warns us that acycle that moves forward can also go into reverse if a deterioratingpublic health and a declining economy undermine each other.ConclusionSince 1800, global population has increased over six-fold (FAO, 2003;McEvedy & Jones, 1978). Manufacturing industries have increasedover seventy-five times in value (Bairoch, 1982) and carbon dioxideemissions from fossil fuel combustion has increased 600 times(Marland et al., 2005). Overall, global economic product has multipliedmore than sixty-fold. 22 Despite the environmental disruptionwhich might have been caused by all this activity, the state ofhumanity has never been better. Specifically:◆In the last two centuries, the average person’s life expectancyat birth has doubled, infant mortality is less than a third ofwhat it used to be, and real income has grown sevenfold. Foodis more affordable. A child is less likely to go to bed hungry anda woman is far less likely to die in child birth.
34 Fighting the Diseases of Poverty◆◆◆◆Children are more likely to be in school than at work. Peopleare more educated and freer to choose their rulers and expresstheir views. They are more likely to live under the rule of lawand are less fearful of being arbitrarily deprived of life or limb,freedom, property, wealth and other basic human rights. Notonly is work less physically demanding, but people work fewerhours and have more leisure time and money to devote tooptional pursuits.Although gaps between richer and poorer nations may beexpanding in terms of per capita income, gaps in the criticalaspects of human well-being (particularly life expectancy,infant mortality, hunger and malnourishment and literacy)have for the most part shrunk over the past half-century,despite regression in Sub-Saharan Africa and in the countries ofthe former Soviet Union.Developing nations on the whole have benefited fromknowledge and technology generated in developed countries.With respect to the most critical indicators of human wellbeing– life expectancy, infant mortality and hunger –developing countries are better off than were developedcountries at equivalent levels of income. These improvementshave come from reducing death and disease due to inadequatefood supplies and infectious and parasitic diseases such ascholera, malaria, typhoid, diarrhea, dysentery and other waterrelatedillnesses.The reductions in water-related diseases and diseases caused oraggravated by inadequate food and nutrition have not yet runtheir full course. Thus, improvements in infant mortality andlife expectancy in developing countries may continue,shrinking the gap between developing and developed countriesfor these indicators.However, once the easy and relatively cheap improvements inhealth and life expectancy have been captured, the gap may widenagain. Further improvements will come only through dealing with
Wealth, health and the cycle of progress 35nontraditional diseases such as AIDs and the diseases of affluence.While the United States has reduced deaths from HIV/AIDS byalmost 65 per cent between 1995 and 2003, treatment is expensiveand unaffordable to most in the developing world. This illustratesnot only the need for improved technology but also the importanceof economic growth as well as trade in ideas and products.It must be noted, however, that like other cycles, the Cycle ofProgress can also go in reverse. Whatever gains the last half-centurybrought to Sub-Saharan Africa, they could be more than erasedunless countries in that region undertake the policy and institutionalreforms necessary to break the vicious cycle of falling incomesand poorer health that currently grips many parts of that area.Economic growth, technological change and trade become evenmore crucial for the continued improvement in the state ofhumanity when one considers that global population may growanywhere between 15 and 120 per cent during this century, accordingto the United Nations’ latest projections (United Nations PopulationDivision, 2004a; 2004b).
2 South Africa’s healthcareunder threatJohan BiermannIntroductionSouth Africa’s health care is provided by the government (public)health sector, funded by taxpayers, and a private sector that isfinanced in various ways. The government sector provides care tothose who cannot afford private care and are not beneficiaries ofprivate philanthropy. The private sector provides services tomembers of medical aid funds, those who choose to pay out ofpocket for health care, employees of companies in company-ownedand funded facilities, government contract patients, and those whobenefit from private philanthropy.Under South Africa’s apartheid system, health services wereracially segregated. The demise of apartheid combined with rapidurbanisation resulted in an ever-increasing mismatch between thelocation of government hospitals and clinics and the geographicaldistribution of the population. Large centrally situated governmenthospitals in the cities, previously reserved for use by the white population,now serve everyone and are struggling to cope with thedemand for health care.The government health sector is under strain, suffering fromshortages of medicines, poor and unclean facilities, poor servicedelivery, rude personnel and a shortage of doctors and staff(National Dept of Health, 2002). In 2002, of the 197,898 provincialstaff positions across the various health professions 84,205 (42 percent) posts were vacant (Health Systems Trust, 2002).Large numbers of medical personnel have left, and are leaving
South Africa’s healthcare under threat 37the country for Australia, New Zealand, Canada, the UnitedKingdom and the United States. There are 600 South African doctorsregistered to practise in New Zealand while 10 per cent of Canada’shospital-based physicians and 6 per cent of the total health workforcein Britain is South African (Health Systems Trust, 2004).Associated with staff shortages, there is a severe lack of skillsacross the entire spectrum of health services provision, with thegovernment sector lacking highly trained personnel, sophisticatedtechnology and managerial skills (Health Systems Trust, 2003).By contrast, South Africa’s private health-care sector is one of thebest in the world. It provides health-care services to a large crosssectionof the population and attracts foreigners as health touristsbecause it offers an excellent service at internationally competitiveprices. South African private hospital groups have won tenders toprovide health services in the United Kingdom. Medical schemes areinnovative and are exporting some of their ideas to other countries.The world’s leading pharmaceutical companies are represented inthe country and many have manufacturing plants and carry outclinical trials in South Africa. Most governments of developing countrieswould welcome a private health-care sector of the high qualitythat exists in South Africa and to see such substantial investmentsin health care in their own countries since a relatively large privatehealth-care sector allows a government to utilise its scarce taxresources to provide better health care for the poor. Counter-intuitively,the South African National Health Department does not seemto recognise either the value of the private health-care sector to thepeople and the economy of South Africa, nor the benefit to poorSouth Africans. This must be puzzling to an impartial observer.The government is disturbed by the rapid growth of what itregards as an expensive private health sector, which it believes isproviding superior health care to the affluent few while theunder-resourced and under-staffed government health sector isstagnant and struggles to provide care to the many. In response,it has adopted legislation that aims to establish a unified nationalhealth system in which the government’s health department will
38 Fighting the Diseases of Povertytightly regulate, plan and manage public and private health-careprovision.This paper examines the threat to health-care delivery posed bySouth Africa’s recent health legislation, particularly the NationalHealth Act 2003, and offers suggestions for an alternative healthcaredispensation in which all patients, rich and poor, would receivehigh-quality private care.South Africa’s health-care challengeOne of the basic assumptions that characterises the debate aboutSouth Africa’s health care is the respective proportions of the populationthat are served by the government and private sectors. Thegovernment’s policy documents claim that 84 per cent of the SouthAfrican population depend on the government health sector(National Treasury, 2001; Ornell et al., 2001). This figure is apparentlybased on the assumption that the approximate 16 per cent ofthe population who are members of private medical schemes, arethe only patients treated in the private health sector.However, as explained below, the fact that approximately 16 percent of the population are members of private medical schemes doesnot necessarily mean that the remaining 84 per cent are treated inthe government health sector. This automatic but incorrect assumptionis perpetuated in the Draft Charter of the Health Sector of theRepublic of South Africa, published in 2005, which claims that thereis a small minority of South Africans (between 15 and 20 per cent ofthe population), who have a high degree of access to health servicesand a large majority (between 75 and 80 per cent of the population),who have either limited access to health services or no access at all(National Department of Health, 2005). The “high degree of access”refers to that proportion of the population who can afford privatehealth care and the “large majority” to those who, if they needed it,would obtain health care in the government health sector.Accurately determining the percentage of the population that isdependent on the government health sector is of vital importance.
South Africa’s healthcare under threat 39Figure 1 Number of public and private hospitals in SouthAfrica20045004004103002002041000PublicPrivateIt is even more important to determine how many people actuallyuse government health services, the frequency of that use, andnature of the services they utilise. The possibility that some peoplemay, or are entitled to, use a particular service does not mean thatthey will do so. If future policies are to be based on incorrect figuresfor the respective quantities of services provided by the governmentand private health services, it will have serious consequences forfuture health policies. It is thus essential that an effort be made toobtain a better understanding of the existing situation.A cursory glance at the available hospital and hospital bed statisticswould appear to support the government’s claim that thegovernment sector supplies health-care services to all but a smallproportion of the population. In 2004 there were 410 public hospitalswith 105 665 beds (79.6 per cent), and 204 private hospitalswith 26 593 beds (20.4 per cent) 1 (Figures 1 and 2)Despite the fact that only about 20 per cent of the hospital beds
40 Fighting the Diseases of PovertyFigure 2 Number of public and private hospital beds inSouth Africa2004120,000100,000105,66580,00060,00040,00020,00026,5930PublicPrivateare private, there are indications that close to half the populationmay use private health services. This can be shown by building apicture of the South African health market, bearing in mind thataccurate numbers are not available and wide variations are found inpopulation and poverty statistics.According to official figures, South Africa had a population of44.8 million people in October 2001 (Statistics South Africa, 2003).Poverty estimates range from 40 per cent (Government Communication& Information System 2002) to as high as 60 per cent (Departmentof Provincial & Local Government, 2001) of the population.Based on a poverty datum line of R800 per month for a household,52 per cent of households lived in poverty in 1996 (Health SystemsTrust, 2003). It would thus be safe to conclude that at least half thepopulation, or 22.4 million people in 2001, could not afford comprehensiveformal health care.Research shows that in 1999 about 20 per cent of the population
South Africa’s healthcare under threat 41Table 1 Comparison of sectors used by medical aid andnon-medical aid members (Doherty et al. 2002)Place of 1995 1998consultationWithout Medical Without Medicalmedical scheme medical schemescheme members scheme members% % % %Government sector 71.2 32.6 68.5 20.5Private sector 28.8 67.4 31.4 79.5had private medical insurance cover, consisting of medical schememembership (which covered an estimated 16 per cent of the population),other forms of health insurance, and workplace healthservices provided by private firms (National Treasury, 2001; NationalTreasury, 2003; Cornell etal., 2001). At that time it was estimated thatpotentially 30 per cent of non-scheme members (nearly 25 per centof the total population) used private health services on a directpayment basis (National Treasury, 2001; National Treasury, 2003;Cornell et al., 2001). Furthermore, those who paid out of pocket usedeither private or government care, while some used both, as didmembers of medical schemes. This was confirmed by surveys conductedin 1995 and 1998 (Doherty etal., 2002), summarised in Table 1.These figures reflect a slight trend towards greater use of privatehealth-care services.An important consideration too is that many South Africansconsult traditional healers and use traditional remedies. According tothe Minister of Health traditional healers are the first to be consultedin as many of 80 per cent of all consultations. 2 Also, there are manypeople who make little or no use of the services of health-careproviders.Based on the available evidence, a range of between 16 per centand 45 per cent of the population use private health care, and potentiallybetween 55 per cent and 84 per cent use the governmenthealth sector.
42 Fighting the Diseases of PovertyTable 2 Estimate of South African Medical Scheme Market2001% of RSA population PersonsMember of medical scheme 16 7,272,640Not a member but potential memberof medical scheme 30 13,636,200Poor (unable to afford medicalscheme membership) 54 23,891,160Total 100 44,800,000This can be compared to a study of the market potential formedical schemes, undertaken by a private medical insurer, whichestimated that 16 per cent of the population was covered by medicalinsurance in 2001, that a further 30 per cent could afford medicalinsurance but was not insured, and that 54 per cent of the populationwas unable to afford medical insurance (Gore, 2002). Amongthis last group are some who purchase private health care on anirregular basis and would not automatically become governmenthealth-service patients.As the estimates quoted in the above study are in broad agreementwith medical scheme membership and poverty estimates theyare used to construct a broad picture of the South African healthcaremarket in 2001. This is shown in Table 2 above.If the composition of the health-care market set out in the table iscorrect, the government health sector spends its money on a potential54 per cent of the population (24 million people) and not 84 percent as claimed. However, this makes the challenge of providinghealth care to the poor no less daunting. It is huge, not only in termsof the number of poor people, but also in terms of difficulty ofdelivery as 75 per cent (Government Communication & InformationSystem, 2002) of the poor live in rural areas where health services areleast developed.
South Africa’s healthcare under threat 43The National Health Act 2003By the government’s own admission its health sector is not copingwith the demand for health care. The Minister of Health, Dr MantoTshabalala-Msimang, has been quoted as stating that the healthsystem was ‘in shambles’ 3 and Dr Kgosi Letlape, chairman of theSouth African Medical Association, has described the situation in thegovernment health sector as ‘horrendous’. 4In response to the situation, the government has embarked on anongoing programme of expanding and upgrading governmenthealth facilities and services, while, on the regulatory level, it hasadopted the National Health Act 2003, which seeks to establish aunified national health system over which the National Departmentof Health will wield enormous power.The ostensible aim of the new health legislation is to allow thehealth department to control and manage the entire health system,so that it can reallocate and redistribute private and public healthresources in a “more equitable” manner. The unified national healthsystem envisaged in the legislation is to be characterised by(National Health Act, 2003; National Department of Health, 200?):◆◆◆◆Planning interventions in the form of national, provincial anddistrict health plans.Economic interventions in the form of price controls,compulsory minimum benefit requirements for medicalschemes, limitations on risk rating of patients by medicalschemes, prohibitions on re-insurance by medical schemes, andthe establishment of a system of social health insurance.Licensing in the form of certificates of need (CON) requirementsfor the establishment or expansion of facilities and theintroduction of new technologies, enabling the Minister ofHealth to control the number of private hospitals and beds, thelocation of new hospitals, where doctors may practise, and thedispensing of medicines by general practitioners.Compulsory public service for medical graduates, prescribedmedical education curricula emphasising primary health care
44 Fighting the Diseases of Povertyover specialist care, prohibition of insurance policies that covermedical expenses, compulsory acceptance of members bymedical aid funds, compulsory membership of medical aidschemes and limitations on medical aid funds and insurers,restricting their ability to introduce innovative and more costeffectiveservices.The Act introduces South Africa’s own version of a centrallyplanned, socialised health system, in which the facilities, theequipment, the doctors, nurses and other medical professionals, andservices, whether in the public or private sector, have been regulated,licensed, certified, approved and price-controlled by the government.A critique of the recent legislationThe unified national health system envisaged in the National HealthAct 2003 ignores the failures of the country’s existing governmenthealth sector and the evidence from other countries with government(socialised) health systems which shows that these systemsare inefficient, expensive, lack sophisticated medical equipment,have long waiting lists for medical procedures and appointmentswith specialists, do not provide equal access to and equal treatmentfor all citizens, provide lower quality health care than privatesystems, control costs by rationing care and medical technology, andfall far short of attaining their lofty ideals. The experience in thecountries that serve as role models for South Africa’s health-careplans, such as the United Kingdom and Canada, is particularlyrelevant (Goodman & Herrick, 2002; Esmail & Walker, 2005; Piper,2002).Centrally planned health careIn a fully socialised health system everything is centrally planned,controlled and co-ordinated. The government owns all the hospitalsand medical facilities and government health planners determine
South Africa’s healthcare under threat 45how many hospitals and beds there should be, where they shouldbe located, the type and quantity of services and medicines that willbe available, the salaries health-care professionals may earn, theamount of money that may be spent on particular procedures andtechnologies, the type of equipment that may be installed at hospitalsand clinics, and the prices that will be charged for health-careprocedures and medicines.South Africa’s new National Health Act subjects its privatehealth-care providers to the same controls applied in a socialisedhealth system. Private care, from now on, will thus be private onlyinsofar as health establishments will be privately owned. The governmentwill be planning the entire health-care system, with direconsequences for all patients, rich and poor.A government attempting to plan and/or provide health care to anentire nation is confronted by the insurmountable obstacles faced bycentrally planned and co-ordinated systems: the impossibility ofknowing everything necessary to ensure effective, efficient andequitable delivery of goods and services, the ignoring or obliterationof signals provided by prices, the complexity of centralisedplanning, the difficulty of forecasting the future, and the inefficiencyof governments in general.Centrally prohibited health careWhen governments impose plans on their citizens, whatever doesnot fit in with those plans becomes illegal. This observation lead theeconomist Murray N Rothbard to remark that a centrally plannedeconomy is a centrally prohibited economy (Rothhard, 2004).Socialised care becomes government-prohibited health care:nothing may be done without prior government approval. So, forexample, South African doctors will be prohibited from openingmedical practices in areas that government health-care plannersbelieve are adequately served. The planners will somehow knowexactly where all doctors should practise and what procedures andequipment they should use in order to meet the needs of allpatients.
46 Fighting the Diseases of PovertyGovernment health systems are inefficientCompared to its private health-care providers, South Africa’s governmenthealth sector is slow, unwieldy and inefficient because it isnot subject to the discipline entailed in making profits, avoidinglosses, and earning an adequate return on capital invested. The governmentsector can always obtain more funds from taxpayers, or, ifgovernment health costs and demands for service get really out ofhand, ration health care.The proponents of government health care regard the economicrationing of health care as inequitable, but regard rationing ofhealth care by governments as justifiable, notwithstanding thepromises to provide health-care services to all who need them. Ahealth department discussion document makes this admission:Consequently, the achievement of equity within the con<strong>text</strong> of abudget constraint implies the conscious application of a limit onthe services that are made available on an equitable basis. Inaddition, the introduction of new services would have to be on thebasis that they lower the costs and improve the outcomes ofexisting interventions. As the wealth of a country increases, it willbecome feasible to increase the amount of services provided on anequitable basis. (National Department of Health, 2002)In the government health-care sector, therefore, it is said to befor reasons of equity that health services are either limited or notavailable. However, when economic rationing occurs in the privatehealth sector the proponents of socialised health care describe suchrationing as inequitable.Government health systems, like all government activities worldwide, are encumbered by bureaucratic procedures and are consequentlyunavoidably inefficient. They cannot compete with privateproviders. The contracts awarded to private health-care providersby the British National Health Service (NHS), which is under severepressure to speed up the provision of medical care for the more thanone million NHS patients who are on waiting lists for surgical pro-
South Africa’s healthcare under threat 47cedures, provides an illustration of the greater efficiency of privateproviders.South African private hospital groups, Netcare and Life Healthcareare among the companies to whom contracts have beenawarded. 5 The contracts require the performance of thousands ofmedical procedures annually, such as cataract procedures,orthopaedic surgery (including hip and knee replacements), ambulatorysurgical procedures (including arthroscopies), general surgicalprocedures, and ear, nose, throat and oral procedures. Life Healthcare,in a joint venture with Care UK PLC, has been contracted toconstruct and operate three Diagnostic Treatment Centres inEngland, which include consulting rooms, radiology (including X-ray, CT scanner, MRI and ultrasound), pathology laboratories,theatres, ICU beds, general beds and a rehabilitation gymnasium.The contracts awarded confirm the superiority of private careover government care as well as the competency of South Africancompanies in providing world-class medical care. It is unfortunatefor government sector patients that these resources are not beingused locally to alleviate the pressure on the government sector.The quality of care and the competitive cost of private health carehave made South Africa a destination for medical tourism. Patientscome to South Africa from the United Kingdom, where they areentitled to free health care, and pay for medical treatment out oftheir own resources to avoid the long waiting times for medical carein the British National Health Service (NHS). 6The knowledge problemProponents of government health systems argue that such systemsensure the optimal and productive utilisation of the country’shealth-care resources. Their arguments are based on the fallacy thatthere is someone who actually knows how to allocate health-careresources in an equitable manner and what optimal utilisation ofhealth resources would comprise. However, as explained by Nobellaureate Friedrich Hayek, such a person or organisation cannot exist.Hayek’s writings teach us that government planning cannot achieve
48 Fighting the Diseases of Povertythe efficiency in the use of resources which market processes makepossible because the knowledge required to do so is dispersedamong thousands or millions of individuals (Hayek, 1944; 1976). Allgovernment enterprises and state-controlled economies fall prey towhat has become known as “the knowledge problem” and SouthAfrica is no exception.To see why it is impossible for government to centrally plan theentire health-care system, let us turn to the National Health Act2003 to see what the Act requires the health planners to take intoaccount when granting or refusing an application for a certificate ofneed.In issuing or renewing a certificate of need for a new hospital,clinic, day-care facility, or expanding an existing one, the introductionof new technologies such as CAT, Sonar and MRI scanners, oremployment of more nurses and doctors the Director-General ofHealth, under Section 36(3), must take into account:◆◆◆◆◆◆◆The need to ensure consistency of health services developmentin terms of national, provincial and municipal planning.The need to promote an equitable distribution andrationalisation of health services and health-care resources, andthe need to correct inequities based on racial, gender, economicand geographical factors.The need to promote an appropriate mix of public and privatehealth services.The demographics and epidemiological characteristics of thepopulation to be served.The potential advantages and disadvantages for existing publicand private health services and for any affected communities.The need to protect or advance persons or categories ofpersons designated in terms of the Employment Equity Act,1998 (Act No. 55 of 1998), within the emerging small, mediumand micro-enterprise sector.The potential benefits of research and development withrespect to the improvement of health service delivery.
South Africa’s healthcare under threat 49◆◆◆◆◆The need to ensure that ownership of facilities does not createperverse incentives for health service providers and healthworkers.If applicable, the quality of health services rendered by theapplicant in the past.The probability of the financial sustainability of the healthestablishment or health agency.The need to ensure the availability and appropriate utilisationof human resources and health technology.Whether the private health establishment is for profit or not.Section 36(4) of the Act empowers the Director-General to investigateany issue relating to an application for the issue or renewalof a certificate of need and may call for such further information asmay be necessary in order to make a decision upon a particularapplication. Section 36(5) stipulates that the Director-General mayissue or renew a certificate of need subject to:◆Compliance by the holder with national operational norms andstandards for health establishments and health agencies, as thecase may be.Any condition regarding:◆ The nature, type or quantum of services to be provided by thehealth establishment or health agency.◆ Human resources and diagnostic and therapeutic equipmentand the deployment of human resources or the use of suchequipment.◆ Public private partnerships.◆ Types of training to be provided by the health establishment orhealth agency.Section 37 stipulates that a certificate of need is valid for a prescribedperiod, but such prescribed period may not exceed 20 years.When an application for a certificate of need is received the
50 Fighting the Diseases of Povertyhealth planners in the offices of the Director-General of Health arefaced with an impossible task. To properly process an applicationthe health planners have to be all but omniscient, an impossibleexpectation. They need to know the health needs of everybody in agiven geographical area: the number likely to fall ill, the type of illnesseslikely to befall them, the existing number of facilities, beds,and equipment, the rates of utilisation of services and facilities, howeffective the doctors are, the effectiveness of treatments and medicines,and so on. The equation becomes even more complicatedwhen one considers that people do not necessarily use the healthservices located closest to them. How does the health planner thendetermine the trading area for a particular facility?Let us assume that a gynaecologist applies for a certificate ofneed to purchase a new sonar scanner. The health planner has todetermine the existing number of scanners serving the area, thenumber of women likely to fall pregnant, the number and utilisationof existing sonar scanners, the number of medical personnel andservices available for maternity purposes, the financial sustainabilityof existing gynaecological practices, and so on. And, once that isdone, how does a health planner or the Minister of Health determinefor how long a certificate of need should be valid?Add the policy considerations prescribed in the Act (such as the“appropriate mix” of public and private facilities, compliance withthe national, provincial and municipal health plans, correctinginequities based on race, gender, and economic and geographicalfactors) and a realistic assessment of all the factors becomes impossible.Since there is no objective way to decide on these issues, decisionswill ultimately be based on ideological and politicalexpediency.In view of the complexities, applicants will be required tomotivate their applications and provide the information and statisticaldata necessary to enable the health planners to make decisions.Doctors and service providers will have to pay consultants toprepare applications on their behalf, increasing the cost of providingmedical care. However, no matter what information is provided,
South Africa’s healthcare under threat 51health-care providers will be at the complete mercy of the healthbureaucracy.Planning and pricesSouth Africa’s health planners are instructed by the new laws andregulations to ignore demand, prices, and the wishes of patients.But, if prices are interfered with, or a market is not allowed tofunction, there is no way of reconciling supply with consumerdemand.The market and prices make the discovery process possible thatallows people to utilise more facts than any other known system.By means of prices we constantly discover new facts that improveour adaptation to the ever-changing circumstances of the world inwhich we live. (Hayek, 1976)In the absence of prices determined in a competitive market,economic calculation becomes not merely difficult, but impossible(Von Mises, 1990). To overcome this problem in the former communistcountries, economic planners had to copy prices set on worldmarkets. When one considers that central planners in the SovietUnion had to fix 24 million 7 prices, and had to keep adjusting them,relative to all other prices, as conditions changed, one realises thatcentral planning did not just happen to fail, it was impossible for itto succeed.In a market economy the task of “fixing” prices is undertaken byhundreds of millions of people individually keeping track of the relativelyfew prices they need to know for their own decision-making.In a health-care system under political and bureaucratic domination,price controls are invariably introduced, supposedly to makecare affordable and to contain costs. This obliterates the very priceinformation system that would allow health-care resources to beutilised most efficiently. By ignoring prices, politicians, health-careplanners and policy makers have no means of knowing what theoptimal allocation of health resources should be and the fact that
52 Fighting the Diseases of Povertythey are generally driven by non-economic motives makes mattersworse. As a result, health-care delivery becomes a product of politicaland bureaucratic expediency rather than a response to realhealth-care needs. Equity, efficiency and effective delivery becomethe casualties of the absence of market prices to co-ordinate production,supply and delivery of health care to consumers. This iswhat South Africa’s citizens will face if its health department continueson its current course.Dealing with complexityThe proponents of government health care argue that the marketcannot be relied on to allocate health-care resources equitably andefficiently. For example, while in the cities there are a number ofprivate hospitals, most rural towns have none. This leads to the conclusionthat urban dwellers are over-serviced due to a duplication ofservices and as a result rural residents are under-served anddeprived of the care they need. Planners then conclude that governmentshould take over the planning and direction of health carein order to resolve what they view as market failure. They ignorethe reality that the spatial distribution of economic activities,including private health-care facilities, are the result of a virtuallyendless number of variables, impossible to be grasped by any individualor planning agency. Modern economic activities are socomplex that no government can successfully centrally plan anddirect them or any of their components, including health-caredelivery.Evidence of the order achieved by the market surrounds us inSouth Africa. A patient can make an appointment to see a generalpractitioner or specialist at a scheduled time, leave the doctor’srooms with a script and present it to his or her pharmacist of choice.The pharmacist, not knowing that a patient would require that particularmedicine that day, would in almost all cases be in a positionto immediately supply the required product. In the case of a dispensingdoctor the patient has the added convenience of purchasingthe medicine directly from the doctor. Even in non-emergency
South Africa’s healthcare under threat 53cases advanced diagnostic procedures, such as Magnetic ResonanceImaging (MRI) and Computed Tomography (CT) scans are availablewithin hours. 8 Compare this level of availability with that found insocialised health-care systems. Across Canada the median waitingtime for CT scans is 5.2 weeks and that for MRI 12.6 weeks. 9 In theUnited Kingdom patients wait six months or more for MRI scans in40 per cent of NHS trusts and four months or more for CT scans inalmost a third of NHS trusts. 10Life for patients in South Africa’s centrally planned governmenthealth facilities is very different from that in the private health-caresector, with public facilities exhibiting many of the problemscommon to socialised health systems. Patients wait for hours, andsometimes days, to see a doctor, and medicines may or may not beavailable. If patients require specialised treatment they are referredto “higher order” facilities, such as district hospitals, where thewaiting starts all over again. However, while cross-country comparisonsare difficult, waiting times for services in South Africa’sgovernment health-care facilities appear to be shorter than those inthe national health systems of both the United Kingdom andCanada. In real emergencies patients also have the option ofscraping together the cash to utilise private services. The difficultiesexperienced by patients using South Africa’s government healthcarefacilities do not, however, indicate that the people who work inour government sector have no concern for their patients’ welfare.Provide the same people with the same incentives and disincentivesthey would have in a private facility and there would be a totaltransformation. The failure of any government health system todeliver adequate and effective health care is inherent in centralplanning.No mathematical equation or formula is available to assist ourhealth department to calculate what the health needs of thecountry’s 44.8 million people are at any time, nor what resources toprovide, where to provide them and in what quantities. They facethe same insurmountable obstacles as all other countries with governmentprovided or controlled health systems and experience the
54 Fighting the Diseases of Povertysame problems: patients waiting weeks and even months for treatment,a lack of modern equipment and resources, rationing of care,rising costs, budget constraints, and the like.The private health sector is superior to the government healthsector because complexity is reduced through the price system.Private doctors, medical practices and private hospitals make onlytheir own plans, which they constantly adjust and improve to attractand retain patients so as to stay in business. They respond directly tothe needs of their patients and have, until recently, not been compelledto fit into any government plan dictating what they may door not do. The National Health Act 2003 is scheduled to change thesituation and as a consequence the convenience and quality of carecurrently offered to private patients will be in jeopardy.The problem of introducing new technologyInventions, innovations and technological developments cannot bepredicted in advance and therefore cannot be centrally and bureaucraticallyplanned (Rothhard, 2004). Government health departmentplanners not only do not know what will be invented and when;they also do not know who will do the inventing. Medical advancesmake a mockery of health plans produced under a national healthsystem and the planners are therefore likely to oppose the introductionof new techniques and equipment.New technologies are expensive and as a government healthsystem cannot make them available to the whole population at once,it either finds a way to severely limit their use or does not introducethem at all. The higher the cost of the new technologies, the more difficultit becomes for a national health system to make quality healthcare available to everyone. The only exception is when a new technologyreduces the cost of treatment and improves the outcomes ofexisting treatments (National Department of Health, 2002). If thereare no private health-care providers to demonstrate to governmentplanners that new technology improves outcomes and lowers costs,they will have no way of knowing, and will have to make politicalrather than economic decisions in introducing new technology.
South Africa’s healthcare under threat 55Inequitable distribution of resourcesThe South African government is concerned by what it views as aninequitable distribution of health-care funding and resourcesbetween the private and government sectors. Officials claim thatthe private health sector consumes more than half the total healthexpenditure yet provides care for less than 20 per cent of the population.The validity of these generally quoted numbers for thesplit between government and private health-care provision wasearlier shown to be questionable yet, disturbingly, the figures arepersistently quoted in government policy statements. According tothe Minister of Health, the private health sector spent R43-billionon 6.9 million people in the 2003/2004 financial year while publicspending was R33.2-billion for 37.9 million people. 11 Anyone whois not a member of a medical scheme is by this logic automaticallyconsidered to be dependent on public sector health care, whetheror not they use the services. Basing policy proposals on this flawedlogic is intended to justify government intervention. The implicationis that, to obtain an equitable distribution of resources, moneyspent on private patients must be redirected to the governmenthealth system.There are several grounds for questioning both the logic behindthe “imbalance of resources argument” and any proposals for “rectification.”If we analyse the argument carefully, we see that theofficials are saying that some members of the population spend alot more of their own money on their own health care than thegovernment, utilising taxpayers’ money, spends on people who areunable to purchase health care. Compare this to a statement that“some members of the population spend a lot more of their ownmoney on their own food and clothing than the government, utilisingtaxpayers’ money, spends on people who are unable topurchase clothes and food”. There is an undoubted food andclothing “imbalance of resources,” but the government does notfeel compelled to increase the regulation of private-sectorproviders of these essential commodities, limit the expansion oftheir production facilities, and require them to obtain official
56 Fighting the Diseases of Povertyconsent before purchasing new equipment for use in their businesses.If government interfered in the same way in food andclothing production it would reduce rather than increase thequantity of food and clothing available to the poor. The economicrules for the supply of health care are the same as those for foodand clothing. Reduce investment, increase costs, and the supply willdiminish.The imbalance of resources argument creates the impression thathuge amounts of money are floating around in the private healthsector, just waiting for someone to use it. In fact, the R43 billionspent annually on private health care is money spent by peoplepaying out-of-pocket for care, and by medical schemes paying forthe medical expenses of their members and the cost of providingfor government-imposed reserve requirements, administration, andthe like. The medical schemes are funded entirely by their memberswho contribute either directly or through their employers. There isno surplus for government to plunder and spend in the governmenthealth sector.Private health-scheme members, by and large, also pay most ofthe taxes that government collects to fund its health system. Thus,what the imbalance of resources argument actually says is thatmembers of medical schemes must be denied the quality andquantity of services they currently purchase with their own moneyso that government can take even more of their money to spend ongovernment-provided health care for others.Everyone pays when government forecasters get it wrongWhen private health-care providers make mistakes in their predictions,they bear the costs of those mistakes. For example, when aprivate provider over-invests in hospital facilities, when medicalequipment remains unused, or when the provider overestimates thequantity of medicines needed over a given period, it loses money. Tocontinue operating, a private provider has to remain profitable, orat least break even financially, and therefore has every incentive tomake accurate forecasts and reduce mistakes.
South Africa’s healthcare under threat 57When government health planners make similar mistakes, themonetary costs are inflicted on the taxpayers. The responsibleplanners are seldom held accountable since they are “hidden”behind a veil of bureaucracy.Poor patients depend on wealthy patientsNot surprisingly, most new medicines and medical technologies areproduced in the USA because there are enough affluent Americanpatients who can afford to pay the high prices manufacturers chargeto recover the costs of research and development. Once the salesvolumes increase, the prices come down and the medicines andtechnologies become more widely accessible. Without the wealthycountries to pioneer technology and drug production, poorer countries,such as those in Africa, would never gain access to thembecause they would not be produced.South Africa’s wealthier patients perform the same function forthe poor that wealthy Americans perform for poorer countries: theypay to maintain the highly skilled professionals who carry out highquality,high-cost procedures, using expensive equipment. In SouthAfrica, without a pool of wealthy patients, skilled professionalswould leave for greener pastures and would no longer be here topass their skills on to others, and expensive equipment would nolonger be available. The notion that the wealthy deprive the poor ofhealth services is wrong. Wealthy South Africans “ensure” that poorSouth Africans have access to better health care.The “certificate of need,” introduced to control the purchase ofnew equipment by private health-care firms, is ostensibly aimed atcontrolling costs and the alleged “over-servicing” of patients byrationally allocating scarce resources. However, new technologiesthat begin as luxuries available only to the wealthy quickly becomestandard procedures in a rapidly evolving field such as medicine.The National Health Act will have the effect of delaying the introductionof new medical technologies and, therefore, will ultimatelyhave a detrimental effect on health care for all South Africans.
58 Fighting the Diseases of PovertyPoliticisation of health careAs the government health sector is under political control, the viewsof key government officials on a particular medical issue directlyaffect the manner in which the government health sector deals withit. The views of the South African President and Minister of Healthon HIV/Aids are considered to have been the main reason 12 for thecountry’s slow response in dealing with the HIV/Aids problemdespite the government’s commitment 13 to decreasing the incidenceof infection.In a government planned and controlled health system, patientsare at the mercy of politicians and those appointed by them tocontrol the system.The “free health care” mythGovernment health policy entitles certain categories of patients,including pregnant women and children younger than six years ofage, to receive “free” general care, while “free” primary health careis available to every citizen (Health Systems Trust, 2004). However,the health care is not free. It is provided to patients at the expenseof the taxpayer.The day after Nelson Mandela, during his presidency, announcedthat “all pregnant women and children under the age of 6 years”would be entitled to “free” health care; some public hospitals couldnot cope with the large number of women and children who arrivedon their doorstep seeking medical care. The event dramaticallydemonstrated that if the cost is reduced, especially if it is reducedto zero, the demand increases exponentially. To cope with thisdemand, government health-care providers have no option but toreduce availability or deny health care to patients.However, the difficulties that arise as a result of the introductionof so-called “free” care are not limited to rationing – it also meansless efficient and more expensive health care (Reisman, 1996). Alarge bureaucracy is needed to administer a socialised healthsystem, which together with the built-in bureaucratic inefficiencies,add even more to the costs of so-called “free” health care. To control
South Africa’s healthcare under threat 59costs, officials oppose the introduction of advances in medical technology.Advanced technologies and procedures such as MRI scannersand the implantation of artificial hearts, are a major threat to theirbudgets. 14“Free” health care is therefore not only, not free, it is expensive,it inevitably denies patients access to the latest medical proceduresand technologies, and it is not freely accessible..Quality health care for allThere are two very different approaches to the problem of ensuringthat people have adequate access to health care. One approach isfor the government to attempt to gradually nationalise all healthcareservices, ultimately ending with fully taxpayer-funded stateownedhealth services. This is the apparent aim of the NationalHealth Act of 2003 and also of the recently proposed “HealthCharter.” But economics and world experience tell us that nationalisedhealth care does not work, for three major reasons. The firstis that national health systems do not respond to the day-to-daydecisions of consumers and therefore fail totally to supply theirneeds. The second is that they invite unlimited demand, whichcannot be met with limited resources. The third is that a relativelypoor South Africa cannot hope to achieve success at implementinga system that some of the wealthiest countries, such as the UnitedKingdom and Canada, have for decades been trying vainly to makesucceed.The other approach is to establish a health-care environment inwhich private health-care funding and provision can grow rapidly,serving an increasing percentage of the population to the pointwhere all health services are privately provided. This option willwork, as the quality and efficiency of the existing private healthcareproviders have ably demonstrated, as long as they are notburdened with government demands that detrimentally affect theirefficiency.Whichever approach is chosen, one aspect will not change, one
60 Fighting the Diseases of Povertyhundred per cent of the funding will be from private sources, firstlythrough taxes, and secondly through voluntary medical aid or insuranceschemes and voluntary out-of-pocket payments.Citizens have the right to expect that the taxes they pay to fundthe health care of the poor will be used in a cost-effective, efficientand equitable manner. They can rightly demand that governmenthealth policy be conducive to the continued growth and developmentof private health care.South Africa’s health-care challenge will be best met if governmentexchanges its role in health-care provision for that of funderof health care for the poor, purchasing care from competing privatehealth-care providers. The most effective mechanism to achieve theempowerment of the poor is to provide them with resources topurchase health care directly from service providers of their choice.The implications for health-care reform are that government should:◆◆◆◆◆Refrain from unnecessarily interfering with and micromanagingprivate health-care provision and encourage thosewho can afford to pay for their own health care to do so.Direct its resources to ensuring that the poor receive adequatecare from providers of their own choice.Fund the needy directly through appropriate means such asvouchers, smart cards, or contributions on their behalf tocompeting medical aid funds, to allow poor patients topurchase quality health care.Encourage the development of health-care insurance productsfor the emerging market.Remove controls that increase health-care costs or prevent theprovision of care by scrapping all requirements for certificatesof need, price controls, compulsory community service,registration requirements for medicines already approved inthe European Union, the United States, Canada, Australia andNew Zealand, and such other countries that meet certaindefined standards.
South Africa’s healthcare under threat 61Implementing the above measures would relieve government ofthe burden of providing health care and would enable it to put substantialfinancial resources directly in the hands of those who needthem most. The essence of the reform programme would be tomaximise the role of the private health sector and for governmentto relieve itself of the liability of providing health care.The main beneficiaries of such a reform programme would be thepoor, who would be given a wide range of health-care choices.Benefits to the taxpayers would be a more efficient use of taxpayerfunds and certainty that tax monies earmarked for funding healthcare for the poor reaches them directly so that poor South Africanswould get more and better health care for the same or less money.State assistance to those who should be self-supporting would beeliminated, allowing greater assistance to those who really need it.A further benefit is that over time, those people who prosper sufficientlyto take care of their own health care would be removed fromthe health-care support list.The government would have responsibility for a thriving,growing, health-care sector that would be the envy of the developingand the developed world. Health professionals would startreturning to South Africa instead of leaving it.ConclusionGovernment’s policy and discussion documents do not explain howSouth Africa, a relatively poor country, will succeed in providingequitable health care to all through the envisaged national healthsystem, when wealthy countries have failed in their attempts to dothis.If government’s health-care plans continue in the direction ofnationalisation, which appears to be the ultimate goal, SouthAfricans will lose their world-class private health-care firms.Patients will lose the freedom to choose their own health care,which is such a vital and personal service, and bureaucratic healthcareplanners will be making decisions for them. This happens in
62 Fighting the Diseases of PovertyCanada, the United Kingdom and other countries that have nationalhealth systems. The whole national health system will functionbadly, just as it does in those countries.The health of the whole South African nation is threatened bythe centrally planned health system envisaged in the NationalHealth Act 2003.
3 Corruption in publichealthMaureen LewisInstitutions and governance have emerged as the back bone ofdevelopment, and are increasingly being shown as critical to incomelevels (Rigobon and Rodrik, 2004; Rodrik, Subramanian and Trebbi,2004; Kaufman and Kraay, 2002), fostering overall development(Kaufmann, Kraay and Mastruzzi, 2005), ensuring sound macroeconomicpolicies (IMF, 1997; Berg, 2005) and per capita income growth(World Bank, 2003b). The World Bank’s 2006 World DevelopmentReport looks again at the determinants of poverty and argues for anemphasis on equal opportunity and the institutional infrastructure(World Bank, 2006). The recent UK government’s Report on the Commissionfor Africa places a premium on governance and institutionsas complementary to other actions in bolstering developmentprospects in the region, and the US government’s Millennium ChallengeCorporation expects to spend billions of dollars on countriesthat demonstrate good governance. Thus both theory and empiricalevidence is accumulating to place governance at the center of developmentthinking, spending and action.At the same time the international community has pledged theirsupport in helping countries reach a set of ambitious MillenniumDevelopment Goals (MDGs) that would sharply reduce poverty, raiseeducational levels and reduce mortality, among other achievements.The combination of the two threads suggests the need to ensurethat institutional development is fostered in conjunction withefforts to accelerate progress on economic and social fronts.Improving human capital in reaching the MDGs and raising
64 Fighting the Diseases of Povertyliving standards has led to a focus on investments in the socialsectors, particularly education and health. These sectors receivedincreasing attention and support from the multi-lateral and bilateralinstitutions over the past decade (IMF and World Bank, 2005).Reaching the MDGs in health will require adequate funding (UnitedNations Millennium Project, 2005; Commission on Macroeconomicsand Health, 2001). However, it is equally important to ensure thathealth systems function so services can be delivered and health professionalsbe accountable to the public, government and, wherethey are providing funds, donors. The strategy to date emphasizesfunding and need, with much less concern for effectiveness or, surprisingly,impact, and has largely neglected institutions and governanceissues.The problem with the lack of concern for basic governance principlesin health care delivery is that well-intentioned spending mayhave no impact. Priorities cannot be met if institutions don’tfunction and scarce resources are wasted. Bribes, corrupt officialsand mis-procurement undermine health care delivery in much thesame way they do for police services, law courts and customs whosefunctions become compromised by the culture of poor governanceand corruption.This paper examines health systems from the perspective of governance,drawing on the knowledge and experience garnered overthe past decade at the national and firm levels and supplementingthat with health-specific evidence. It therefore examines the effectivenessof government and specifically the efficiency of its role inproducing health care services.The next section outlines the health care markets, the role of governmentand the definition and measurement of governance. Theevidence from developing countries on various elements of governanceand corruption in health care delivery is then reviewed, andthe last two sections lay out policy possibilities and implications forthe sector.
Corruption in public health 65Health care markets, public health care systems andgovernanceThe growth, governance and corruption literature (Elliott, 1997;Transparency <strong>International</strong>, 2005; World Bank, 1997; Commissionfor Africa, 2005) largely ignores governance when it comes to publicpolicies in the social sectors. Implicit in that neglect is that goodintentions surrounding these investments are such that governanceis secondary, if it has any importance at all. Efficiency in resource usewould suggest the need to consider such themes, however.Characteristics of health care marketsUnlike other goods and services health care services embody someunique characteristics stemming from inherent market failures.First is the asymmetry of information and agency challenge ofphysicians acting as agents for patients. Patients are aware theydon’t feel well but they rely on health professionals, often physicians,to act as their agents in diagnosing and treating ailments.Patients are ill-equipped to assess the adequacy and quality of physiciandecisions and actions, and therefore focus on the environmentaland interpersonal aspects of clinical services, the elements theyare best able to evaluate.Second, adverse selection practices by private health insurerslead to an uninsured population disproportionately made up ofthose most in need of health care: the chronically ill, the poor andthose having experienced a catastrophic illness. In settings withouthealth insurance ability to pay limits the same groups from obtainingcare so the same constraints apply. Government interventioncompensates for the market’s reluctance to insure the most vulnerable.And because of the random nature of illness or injury, governmentsubsidies protect the population against financial demands ofillness.Finally, the moral hazard of over-consumption by the insuredwho do not face the true cost of health care requires active cost containment,the key issue for OECD countries and relevant for developmentcountries as well. A second form of moral hazard is the over
66 Fighting the Diseases of Povertyproduction of care by physicians when third parties cover costs.Physician induced demand drives costs in much the same way thatconsumer behavior does, with similar implications for payers.In most countries market failures translate into publicly financedand delivered care, and/or regulation from public and private bodies.Most developing countries depend heavily on public interventionrather than regulation, hence the predominance of public healthcare systems in those countries.A limitation in assessing existing health care systems is the lackof any single measure of what constitutes a functioning system.Every OECD country has its own, unique health care arrangementswith a mix of public and private financing, delivery and regulations.OECD comparisons of system performance tend to be limited togross measures such as spending levels or mortality statistics. Themore meaningful comparisons are those based on specific diseaseswhere costs, treatment options and outcomes can be compared,though countries don’t necessarily collect comparable data limitingthe extent of meaningful comparisons. For developing countriessystems differ and information on comparable indicators simply donot yet exist.These characteristics explain why government’s role is so criticalto examine, and why the indicators used in this paper for healthcare delivery are so different from those used in other studies of governanceor health care delivery. This effort documents “governmentfailure” to live up to the objectives of public policy, looking specificallyat efficiency enhancement and redistribution, and focusing onincentives as a means to improve performance without compromisingequity objectives (Jack and Lewis, 2004).Producing public health care: a frameworkThe production function represents the core of public health caresystems embodying capital and labor and governance. A simple representationis the following:Health Outcomes = (L, K, G)
Corruption in public health 67where governance represents some measure of institutional qualityor governance. Increases in labor and capital can improve outcomes,but G may dampen or enhance these effects.Labor encompasses management, physicians, nurses, othermedical staff. Capital is made up of infrastructure, equipment andother fixed assets, as well as financing: government transfers forlocal purchase, in-kind provision of drugs and supplies, and thirdparty and consumer payments. The functioning of the public systemis determined by the incentives facing the actors in the system, themanner in which inputs are managed and the accountabilityimbedded in the incentive structure.While straightforward in concept, the production function itselfis far from simple and the market failures identified above plagueboth private and public systems (i.e., principal agent and informationasymmetry problems), which undermine incentives and limitthe extent of accountability. Accountability can be to a central government,local government, communities or patients, or some combinationof these.Measures to assess performance of public systems are lacking.Infant mortality, a readily available and commonly used measure ofoutcome, better reflects more aggregate measures of well being(such as income and education) rather than the health system,although once the IMR drops below 25–30 per 1000 it bettercaptures the quality and extent of medical interventions. Monitoringbasic functions such as hiring, existence of appropriate policies,purchase of drugs, building of clinics and procurement practices,can be easily accomplished but only represents the identification ofinputs.The more complex and important measures of health system performanceare such things as staff output, drug and medical supplyavailability, regularity of funding transfers, state of physical infrastructure,inventory and functionality of equipment, and existenceof patient records, factors which reflect whether health systems aremeeting minimal efficiency and quality standards. Utilization dataand patient satisfaction offer complementary metrics of health
68 Fighting the Diseases of Povertysystem effectiveness since under-utilized public facilities or their bypassingby target groups suggest implementation problems. Despitetheir relevance, such data rarely if ever are collected on a routinebasis in developing countries. Indeed such information only existsfor a subset of countries and often for only a segment of the healthsystem. In the absence of comparable monitorable indicators thiskind of information can inform policy makers about performanceand the pressure points of health systems development before largescale data collection is in place.Governance and corruption in health care deliveryHealth care provision depends on efficiently combining financialresources, human resources, and supplies, and delivering servicesin a timely fashion distributed spatially throughout a country. Thisrequires a “system” that mobilizes and distributes resources,processes information and acts upon it, and motivates providers’appropriate behavior by individuals, health care workers, andadministrators. Good governance is a critical factor in making sucha system function.In health care, good governance implies that health care systemsfunction effectively and with some level of efficiency. Though manygovernance indicators have been developed for countries in theaggregate, governance indicators for specific sectors, such as health,are not readily available. Consequently, it is necessary to look forproxies that reflect the quality of health sector governance. Thispaper will focus on one such proxy, evidence of corruption, thatresults when governance is poor. This section reviews the definitionof corruption and its application to the health sector.Sound institutions and good governance go hand-in-hand.Kaufman and Kraay (2003) define good governance as “the traditionsand institutions by which authority in a country is exercised”.More specifically it encompasses:◆capacity of government to formulate and implement soundpolicies, manage resources and provide services efficiently;
Corruption in public health 69◆◆the process that allows citizens to select, hold accountable,monitor and replace government; and,the respect of government and citizens for the institutions thatgovern economic and social interaction.Multiple institutions collect indicators of governance. Kaufman,Kraay and Mastruzzi (2005) have boiled them down to six dimensionsof governance: voice and accountability; political stability andlack of violence; government effectiveness; regulatory quality; ruleof law; and, control of corruption – all of which affect the environmentwithin which health care services function. The robustness ofthe private sector in health will be affected by factors such as poorregulation or an ineffective court system, the elements of particularrelevance to service delivery are voice and accountability, governmenteffectiveness and control of corruption.Voice and accountability reflect external accountability, the effectivenessof citizen and institutional influences on governmentaction. While much of the broader concerns are with human rights,in health factors such as the viability of the political system, mediaindependence and trust in government reflect the degree to whichcitizens can influence government decisions that affect them. Forexample, where local leaders are not elected, localities cannot holdpublic servants accountable for their decisions or actions, and publicbodies have little incentive to effectively serve the community. Thelack of voice leaves localities at the mercy of public sector whims.Voice and accountability permit communities to be involved in decisionsand oversight of health care services.Government effectiveness encompasses efficiency of the bureaucracyand public servants, roles and responsibilities of local andregional governments, including the administrative and technicalskills of government, effectiveness of policy and program formulation,governing capacity, and effective use of resources. Extendingthe example above, decentralization that comes without funding or
70 Fighting the Diseases of Povertylocal authority undermines potential effectiveness of local jurisdictionsas they have no power to affect resource allocations ordecision-making and can be the victim of “provider capture” wherecentrally deployed staff determine service, organization anddelivery.Control of corruption is straightforward. It captures the extent andnature of corruption among public officials, including tracking theincidence of nepotism, cronyism and bribes among civil servants,irregularities in public purchasing and oversight, and the nature andextent to which government manages corruption.Corruption can be defined as “use of public office for private gains”(Bardhan, 1997) or “the sale by government officials of governmentproperty for personal gain” (Shleifer and Vishny, 1993). With eitherdefinition good government hinges on the incentives for andaccountability of public servants.Forms of corruption vary. Sparrow (1996) describes the extent offraud in the US Medicare program, which is exacerbated by heavyreliance on electronic payments in compensating providers. Disintereston the part of law enforcement officials reflects a belief thatcosts appear to outweigh the benefits of investigation and prosecution.Large scale fraud discussed in Sparrow suggests the scope ofthe possible in developed countries where significant resources aredevoted to health care; there is heavy reliance on automatedpayment arrangements most of which are never checked byhumans; and inadequate controls are in place to prevent fraud andabuse. Similar types of fraud exist in some middle income countries,but there are far less sophisticated means employed with amplebenefit in developing countries.Governance indicators are built on perceptions of in-country andoutside observers, and their application has emphasized crosscountrycomparisons. On the first point, perceptions are powerfulfactors in shaping behavior. If investors perceive corruption orpatients perceive poor quality, it discourages private investment or
Corruption in public health 71health demand, respectively. But perceptions are only part of whatis of interest in assessing governance issues in healthLess corrupt and politically stable countries the more attractivethey are for private investors and donors (Kaufmann, Kraay andMastruzzi, 2005). Good governance has been shown to correlatewith property rights and civil liberties, and greater foreign investment(Hellman et al., 2000), and to “grease” the wheels of government(Kaufmann and Wei, 1999). Aid effectiveness also rises incountries with good governance. These clearly have relevance tohealth care.Capturing the effectiveness of public health care services, theextent of corruption and the degree of accountability pose seriouschallenges, which contribute to the lagging effort to address governancein the sector. Using national level indicators such as access tohealth services provides limited guidance on how well the sector isperforming. At the same time, performance indicators are scarce,and difficult to aggregate where they exist. The heterogeneousnature of health care and the large number of sui generis events; thehighly variable and unpredictable nature of health care demand; themultiple actors involved in ensuring effective service delivery; and,the limited choice of instruments for monitoring all contribute tothe challenge of defining and measuring governance in the healthsector.Correlates of poor governance and public health careacross countriesThe evidence on the link between institutions and health has largelyrelied on analyzing the cross-country relationships between corruptionand health outcome measures. With evidence for 89 countriesfor 1985 and 1997 Gupta, Davoodi and Tiongson (2000) showcorruption indicators (using Kaufman, Kraay and Zoido-Lobatón,1999) negatively associated with child and infant mortality, the likelihoodof an attended birth, immunization coverage and low-birthweight.The correlation of corruption in explaining the same healthoutcomes is reduced once factors such as mother’s education, public
72 Fighting the Diseases of Povertyhealth and education spending and urbanization are controlled for,but remains significant.In measuring the impact of corruption on the effectiveness ofhealth spending Rajkumar and Swaroop (2002) analyze data for1990 and 1997 controlling for GDP per capita, female educationalattainment, ethno-linguistic fractionalization, urbanization amongother factors, and find that the effectiveness of public healthspending in reducing child mortality hinges on the integrity rating(1–5 range based on level of perceived corruption), with higherintegrity associated with reduced mortality. Poor governance mayhelp to explain the inconclusive findings of Filmer and Pritchett(1999) on the lack of association between public health expendituresand infant and child mortality.Wagstaff and Claeson (2005) extend these analyses further anduse more recent data. They find that spending reduces under 5 mortality,but only where governance, as measured by the World Bank’sCPIA score (Country <strong>Policy</strong> and Institutional Assessment measurethat is scored between 1–5 depending on performance, part ofwhich regards corruption and governance), is sound (a CPIA above3.25). This study specifically explores the implications of additionalspending for reaching the MDGs, and concludes that more spendingin medium and low CPIA countries would not be expected to reducechild mortality, and that per capita income growth offers a betterinvestment if mortality declines are the objective.Because child mortality rates are measured with substantialerror, especially in the poorest countries, these results need to betaken with caution. The uncertainty of the direction of causalityintroduces further limitations in the interpretations of the results.Cross-country regressions are hard to interpret in any event, but asan aggregate assessment they provide general guidance on the relevanceof corruption and other factors in affecting health outcomesin developing countries. The inability of country level analysis toelucidate specific country problems leads to the subsequent sectionthat addresses these issues, complementing this introductory lookat the correlates of health outcomes.
Corruption in public health 73Figure 1 demonstrates the relationship between governanceindices and measures of health performance and outcomes. Measlesimmunization coverage provides a robust measure of public serviceperformance as it reflects government’s ability to perform a criticaland basic health service. Measles immunization by itself is particularlyimportant since when administered in infancy it sharplyreduces all causes of mortality in childhood (Koenig et al., 1991;Aaby 1995). It is also easily measured. Child mortality is a standardvariable for measuring health outcomes, is influenced by a widerange of factors beyond the quality and extent of health careservices, but has the advantage that it is available for a largenumber of countries.The six panels in Figure 1 show the scatter plots for both indicatorsand each of the three components of the KKM governanceindex: government effectiveness, control of corruption, and voiceand accountability. Of the three measures, and compared to theaggregate governance indicator (not shown), government effectivenessbest correlates with poor outcomes and performance in healthcare based on the smaller variation conveyed in the adjust R2. 1 Voicehas the least explanatory power and it is especially limited forimmunization coverage. The panel on voice and accountabilitysuggests why. The highly variable relationship especially among thecountries with the lowest governance scores makes any effort toexplain variation unconvincing. In higher performing countriesmore convergence occurs for government effectiveness and controlof corruption but much less so for voice. Immunization programsare typically the responsibility of central governments because it isa preventive measure for which demand tends to be low among allbut the most educated. 2 The dispersion in the voice and accountabilitypanel is consistent with that fact.Table 1 provides OLS results showing the strength of governancemeasures on measles immunization coverage controlling forother relevant factors. Of the various governance indices, governmenteffectiveness explains more of the differences in measlesimmunization and has a slightly stronger effect than the overall
74 Fighting the Diseases of PovertyFigure 1 Relationship between corruption indices and healthoutcomesImmunizationChild mortality120300100200R 2 = 0.3328010060R 2 = 0.293040-2 -1 0 1 2Government effectiveness (KKM 2005)-100-2 -1 0 1 2Government effectiveness (KKM 2005)120300100200801006040R 2 = 0.222-2 -1 0 1 2Control of corruption (KKM 2005)0-100-2 -1 0 1 2Control of corruption (KKM 2005)1003008020060100R 2 = 0.08540-2 -1 0 1Voice and accountability (KKM 2005)0-2 -1 0 1Voice and accountability (KKM 2005)
Corruption in public health 75Table 1 OLS results for measles immunization coverage (%of children ages 12–23 months)(1) (2) (3) (4) (5)Log of GDP per capita,PPP (const 2000 int’l $) 2.351 0.808 0.487 –0.136 –1.378(3.489) (3.561) (2.451) (2.609) (4.212)Aggregate governance 6.152 5.201(3.124)* (2.442) †Government effectiveness 7.026 6.812 8.221(3.218) † (2.345) ‡ (3.607) †Average years of schoolingof adults, female 1.888 1.763 2.337(0.981)* (1.008)* (1.071) †Primary completion rate,female 0.293 0.309(0.067) ‡ (0.073)Ethnolinguistic and religiousfractionalization –6.021 –4.059 –6.671(2.271) † (2.263)* (2.284)Road density –0.037(0.015) †Constant 56.180 77.120 57.689 66.128 94.809(25.664) † (27.959) ‡ (17.318) ‡ (19.704) (33.118)Observations 71 68 119 112 68R-squared 0.434 0.473 0.444 0.470 0.497Robust standard errors in parenthesesSources: Kaufmann, Kraay and Mastruzzi (2005); Barro and Lee (2000); Alesina, et al.(2003); World Bank World Development Indicators 2005; World Bank EdStats.*significant at 10%; † significant at 5%; ‡ significant at 1%corruption index, which would be expected since immunization isa relatively simple technology and requires basic governmentcapacity to do it well. Government effectiveness is consistent in itseffect on immunization coverage. Controlling corruption (notshown) is significant but less robust than the other two measures,and voice has no effect at all on the per cent of children immunized.Road density would also be expected to impede immunizationcoverage, which it does, and it is significant. GDP per capita strongly
76 Fighting the Diseases of Povertyaffects immunizations, but not when other controls are added.Reaching children appears to be more of an impediment due to dispersedpopulation or inadequate infrastructure. Per capita incomemay not be as important to increasing immunization given the generosityof donor funds, particularly for vertical programs like immunizations.The variable for women’s education, a key input inwhether children get immunized, is best captured by average yearsof schooling for females over age 15. However, the sample sizedeclines by 40 countries when this variable is used, so the completionrate of females, the proportion of girls who are currently finishingschool, is used as a proxy because girls’ current achievementsare a reflection of their mothers’ support for education and theirability to make household decisions about their children’s education.Table 2 shows the OLS results for child mortality. The R2s arealmost 50 per cent higher than those for measles immunizationcoverage, with income per capita and ethno-linguistic fractionalizationexplaining most of the variation. Average years of femaleschooling doesn’t have an effect, although girls’ completion ratesdo. Average years of female education becomes significant, however,when ethno-linguistic fragmentation is left out, suggesting eithersome substitution between these factors, or when the loss for somany observations affects the relationship. Governance is not significant,but it matters when the education variable is female educationrather than completion. Road density and urbanization (notshown) have no effect, and that pattern persists with other models.The established inverse relationship between income and child mortalitymakes these results unsurprising, but the lack of importanceof female education is odd given the strength of the relationship incountry level studies. These results provide the point of departurefor a more narrow focus on both the country level issues and thefactors that directly influence health care delivery.The next section summarizes accumulated evidence on specificcomponents of governance and corruption, including: perceptionsof corruption and performance; management challenges in public
Corruption in public health 77Table 2 OLS results for under-5 mortality rate(1) (2) (3) (4) (5)Log of GDP per capita,PPP (const 2000 int’l $) -66.447 -55.263 -29.148 -24.932 -55.649(7.853) ‡ (9.847) ‡ (8.403) ‡ (8.390) ‡ (9.856) ‡Aggregate governance 18.747 16.828 -3.069 18.644(9.167) † (9.426)* (7.588) (9.866)*Government effectiveness -4.773(8.576)Average years of schoolingof adults, female -3.819 -3.893 -3.563(2.483) (2.551) (2.504)Primary completion rate,female -1.261 -1.197(0.194) ‡ (0.213)Ethnolinguistic andreligious fractionalization 19.222 20.169 18.934(8.220) † (5.525) (8.155)Road density -0.054(0.073)Constant 639.747 521.888 408.635 342.705 526.372(60.938) ‡ (85.021) ‡ (60.448) ‡ (62.343) ‡ (85.128) ‡Observations 71 68 119 112 68R-squared 0.748 0.764 0.745 0.769 0.766Robust standard errors in parenthesesSources: Kaufmann, Kraay and Mastruzzi (2005); Barro and Lee (2000); Alesina, et.al. (2003); World Bank World Development Indicators 2005; World Bank EdStats.*significant at 10%; † significant at 5%; ‡ significant at 1%systems; staff absenteeism; under-the-table or informal paymentsfor health services; corrupt practices including misuse of publicfunds, irregularities in contracting and purchasing supplies, pettytheft and the selling of positions and promotions. As symptoms ofpoor performance, they provide an empirical base for exploringpriority areas for attention and intervention.
78 Fighting the Diseases of PovertyGovernment effectiveness, corruption andaccountability in health care deliverySeparating three components of governance – government effectiveness,corruption and accountability – allows targeting policiesto specific shortcomings. However, the information base is thin andthe elements so intertwined that a separate analysis of each yieldslittle benefit. For example, evidence from provider and other surveysin Mozambique, Nigeria and Uganda suggest that the level of mismanagement,vague and poorly understood performance expectations and thesingular lack of accountability to anyone or any institution makeshaphazard and corrupt practices difficult to identify, separate orcontrol ( Lindelow, Ward and Zorzi, 2004; Lindelow, Reinikka andSvensson, 2003; Das Gupta, Gauri and Khemani, 2003; McPake et.al., 1999).There is a fine line between inefficiency and corruption in manyinstances. Is poor service a function of corruption or simply mismanagement?Better accountability can address both, so should theapproach be combined or separated? In the interests of clarity, thissection will discuss governance, corruption and accountabilityjointly reviewing the evidence and offering an interpretation ofthose findings as they relate to each of these criteria.This discussion begins with an assessment of perceptions of corruptionin select countries to provide that con<strong>text</strong>. It then addressesthe production function elements in reviewing country levelevidence. The analysis tracks productivity of labor, and capitalinputs: drugs, supplies and national transfers, complementing thesewith a brief assessment of management, a central component forcorrecting many of the problems identified.Perceptions of corruption in public health care systemsWhile not strictly part of the production function, perceptionsabout corruption reflect how stakeholders view health systems andtheir effectiveness in producing acceptable health outcomes. Perceptionsprovide the basis for assessing governance at a national
Corruption in public health 79level, and similar estimates have been collected for the healthsector in a subset of countries. Extensive, cross-country surveys ofpublic officials, the business community and the general publicgauge perceptions of corruption in public service. At a sectorallevel a number of recent perception surveys of medical personnelin Latin American public hospitals provide a sense of the kinds andfrequency of corruption in facilities as well as the likely perpetratorsby profession (Di Tella and Savedoff, 2001). Both types ofsurveys indicate corrupt practices, which by their nature are nottypically visible. Perceptions may be the only alternative ininstances where hard data are either unobtainable or unreliable,and corruption in general does not lend itself to straightforwarddata collection.Figure 2 summarizes the perceptions of the general populationtoward corruption in health in a selection of countries for whichdata are available. Data come from various sources all largely basedon perceptions and they are not strictly comparable though theysuggest general levels of corruption in the included countries.Coverage is uneven with a bias towards the countries of EasternEurope and Central Asia (ECA) and South Asia where data are moreplentiful. Of those at or above 60 per cent of the population perceivingcorruption in the health sector half are ECA countries,results partly due to the disproportionate number of ECA countries.In corruption surveys interviewing public officials, businessexecutives and the general public in 23 countries, health ranked firstas the most corrupt sector in Moldova, Slovakia and Tajikistan,second in Bangladesh, India and Sri Lanka, and in the top four inKazakhstan, Kyrgyz Republic, Madagascar and Morocco. For themost part these countries also ranked highly on the per cent of thepopulation perceiving high levels of corruption in health – going ashigh as 95 per cent in Pakistan, 92 per cent in Sri Lanka, 85 per centin Tajikistan, 82 per cent in Moldova and 80 per cent in Morocco. 3Expectations on paying for public care correspond to the perceptionsof corruption, which in turn are closely related to the need forinformal payments, as will be discussed below.
80 Fighting the Diseases of PovertyA related 2001 perceptions survey conducted by USAID on corruptionamong public officials in Bosnia and Herzegovina, Bulgaria,Macedonia, Romania, Croatia, and Montenegro showed that 45–55per cent of respondents felt that corruption among doctors waswidespread. Albania and Serbia showed much higher levels – 61–71per cent range. Albania’s perception score for doctors was an outlierrelative to its score for other public officials, but Serbia exhibitedlevels above those of other countries for most categories of officials,suggesting a relatively more corrupt environment (Vitosha/USAID,2002).Business Environment and Enterprise Performance Surveys ofadministrative corruption in ECA capture business managers’ perceptionsof health service quality. Across 20 countries only SloveniaandCzechRepublichadpositiveassessmentsfrom60percentormoreof respondents, indicating management and governance problems inthe other 18 systems (Ryterman, Hellman, Jones et al., 2000).In Bolivia a local survey of patients considered the HealthMinistry and public hospitals less corrupt than customs or police,but ranked corruption 2.7 on a scale of 1–4, noting the nepotism,clientelism and higher charges for the unconnected as some keyindicators of corruption (Gatti, Gray-Molina and Klugman, 2004),evidence that has been corroborated in other studies as discussedbelow. Surveys from South Asia suggest similar perceptions of thehealth sector (Thampi, 2002).A comparison of corruption perceptions among households inthe Philippines and Uganda found 34 and 71 per cent, respectively,reported that corruption is common or very common in governmentgenerally. And among local officials, 25 per cent in the Philippinesand 61 per cent in Uganda acknowledged some kind ofcorruption in public services within the municipalities (Azfar andGurgur, 2001).Explanations from the surveyed on why corruption is so evidentin the health sector emphasize the lack of accountability and transparencyin health care operations, and in some the “power ofmonopoly” where other public or private alternatives simply do not
Corruption in public health 81Figure 2 Percent perceiving corruption in the health sectorPakistan (2002)Sri Lanka (2001)Tajikistan (2001)Moldova (2000)Morroco (2001)Serbia (2002)Madagascar (2001)Bolivia (2001)Albania (2002)Slovakia (2000)Macedonia (2002)Croatia (2002)Romania (2000)Bulgaria (2002)Senegal (2001)Bosnia (2000)Kyrgyz (2001)Bangladesh (2002)Peru (2001)Kazakhstan (2001)0 10 20 30 40 50 60 70 80 90 100Source: Appendix Iexist (Thampi, 2002; McPake et. al 1999; Lewis, 2000, 2002; Narayan,2000). While not definitive, perceptions highlight where abuses areassumed and widespread and they have become reliable indicatorsof corruption. Only a few countries have sector specific data on perceptions.Greater efforts to track such information can guide bothpolicymakers and donors providing a benchmark for individualcountries.
82 Fighting the Diseases of PovertyStaffing health care deliveryStaffing is arguably the single most important element of healthcare delivery as little can be achieved without it. Training of thestaff, their competencies and ability to function all determinewhether labor can drive the expected results. Training typically isadequate if not well beyond that needed in the lowest income countries,especially for physicians. Availability of the full range of competencies,however, often lags with particular inattention tomanagement needs, and lower paid staff with minimal skills canproliferate.Among the most serious issues in developing countries is thehigh rate of absenteeism, which undermines service delivery andleads to closed public clinics that compromise the equity and healthobjectives of publicly financed health care. Two other commonlyobserved constraints include low productivity of public medicalstaff, and the outright corruption that underlies the buying andselling of official positions. Capturing low productivity and poorservice poses greater difficulties; absenteeism already reflectsreduced output, and underperformance. Patient satisfactionprovides an additional window into adequacy of staff services.AbsenteeismAbsenteeism poses a chronic, but often unmeasured, problem inpublicly financed health care, and can severely limit patient accessto services (McPake et. al., 1999; Lewis, Eskeland and Traa-Valarezo,2004; Narayan, 2000), reduce quality (McPake et. al., 1999; Lewis, LaForgia and Sulvetta, 1996), and suggest corruption (DiTella andSavedoff, 2001).Absenteeism occurs for various reasons, many of them legitimateor necessary. For example, rural health workers often need to travelto larger towns to receive their paycheck, fetch supplies or drugs orare delayed by poor infrastructure or weather. All lead to absencesbut are necessitated by inadequate management or other shortcomingof the country con<strong>text</strong>. On the other hand, some staff haveother commitments or preferences and don’t show up. In effect they
Corruption in public health 83Figure 3 Absence rates among health workers in selectedcountriesHealth staffBangladesh(2004)India (2003)India (Udaipur*)(2004)IndonesiaPapua NewGuinea (2000)Honduras (2001)DominicanRepublic †Mozambique(2003)Uganda (2004)All MDsHealth staffLarge rural centresRural clinicsHealth staffHealth staffHealth staffHealth staffHealth staffRural MDsHospitalMDsUganda (1997)Rural MDs0 10 20 30 40 50 60 70 80 90 100*Udaipur district, Rajasthan, India. †Santo Dominigo hospital, Dominican Republic.Source: Chaudhury and Hammer (2005); Chaudhury et al. (2004); Banerjee and Duflo (2005);Kushnarova (2005); McPake et al. (1999); Lewis, La Forgia and Sulvetta (1996)receive a salary but provide minimal if any services. This is effectivelytheft, a form of “public office for private gain.”Capturing the extent of absenteeism among public service staffis made difficult by the lack of or incomplete nature of staff attendancerecords. Various alternatives have been applied to examinethe issue including perceptions of other providers (DiTella andSavedoff, 2001).Figure 3 compares absenteeism rates for studies that report such
84 Fighting the Diseases of Povertydata, and measurements vary, as do level of provider, number ofobservations within each provider unit and location. Chaudhury, etal., (2004) use a single surprise visit to a nationally representativesample of rural clinics in 5 countries; Banerjee, Deaton and Duflo(2004) tracked absences in 143 government facilities in Udaipardistrict in Rajasthan, India based on weekly visits over 18 months;Lewis, LaForgia and Sulvetta (1996) used time and motion studiesduring a two weeks period to track health provider attendance in asingle hospital in Santo Domingo, Dominican Republic; and, McPakeet al. (1999) directly observed clinics in 10 rural districts in Ugandaover the course of one week. Thus the reported absences arecaptured using different time frames, samples and providers.Absenteeism rates, measured in these particular studies, rangefrom a low in Mozambique and Papua New Guinea of 19 per cent toover 60 per cent among physicians in a Dominican hospital, in ruralBangladesh and Uganda, but cluster around 35–40 per cent for theothers. These results suggest a serious gap in health servicecoverage due to absent staff, levels considerably above those fromsimilar studies in the same countries for teachers (Chaudhury et al.,2004). As in Figure 2, these results rely on different types of surveysover varying time periods and for a variety of services. What is noteworthyare the range of methods, the lack of consistency and theneed to establish acceptable and regular means for tracking staffabsenteeism. Otherwise it will remain an ad hoc approach.Lewis, La Forgia and Sulvetta’s (1992; 1996) time and motionstudies in inpatient, outpatient, surgery and emergency found thatnot only did physicians only provide 12 per cent of contracted time,nurses provided virtually no care outside of inpatient services, andstaff physicians, residents and interns provided only 7, 4, and 8 percent of their contracted time, respectively. As found in Uganda (seebelow), absenteeism was lowest during the early morning hoursand in the outpatient department. In the DR, surgery was only conductedbefore noon during the availability of surgeons, leaving thefacility idle for the remainder of the 24 hour day. Interns, residentsand auxiliary nurses received virtually no supervision from staff
Corruption in public health 85physicians and nurses. The resulting services were under-staffedand reliant on untrained providers with virtually no supervision.The abuses translated into high costs for the public sector with littleoutput, and undermined the quality of health care across the boardby relying on ill-trained providers for care and under investing inthe quality of future providers.Residents and auxiliary nurses received virtually no supervisionfrom staff physicians and nurses. The resulting services were understaffedand reliant on untrained providers with virtually no supervision.The abuses translated into high costs for the public sectorwith little output, and undermined the quality of health care acrossthe board by relying on ill-trained providers for care and underinvesting in the quality of future providers.McPake et al., (1999) recorded attendance and clinic openings.Clinics only remained open for 2–3 hours in the morning withpartial coverage by health staff, often on a rotating basis. Doctors,medical assistance, midwives and nurses were available for anaverage of 12.9 hours per week while nursing aides, dressers andpharmacy orderlies worked an average of 18.5 hours. The lattergroup of lower level health workers provided 71 per cent of totalavailable hours of staff at the clinics compromising quality as wellas coverage. These estimates ignore the “ghost” workers who neverattend the facility, suggesting that the average attendance of contractedstaff is even lower than the estimates.Chaudhury and Hammer’s (2004) study of absenteeism in ruralhealth clinics in Bangladesh recorded availability of doctors andparamedics of filled positions. 4 On average 35 per cent of staff and42 per cent of physicians were absent across the 60 clinics visited.In eamining clinics by location, absenteeism in the most rural areaswas 74 per cent for doctors. Subsequent multivariate analysisshowed that living outside the service village, being female andpoor road access increased the likelihood of absenteeism amongphysicians. Absenteeism was associated with clinics in disrepair aswell as with lower patient demand, suggesting that absenteeismcompromises quality and quantity of services.
86 Fighting the Diseases of PovertyThe studies in Uganda and Rajasthan, India added a search forabsent primary health care workers. Over the course of 18 monthsIndian nurses were only to be found in villages served by the subcenter12 per cent of the time, and all were assigned to staff theclinic on a regular basis. The pattern of absences, and thereforeclosure of facilities, followed no pattern meaning that patients’ likelihoodof finding a provider was unpredictable (Banerjee, Deatonand Duflo, 2004). Health workers were often found at home inUganda, although some employees simply never attended thefacility and were designated as “ghost” workers (McPake et al.,1999). The costs represented by absent staff are not insignificantgiven the higher levels absenteeism, which are consistently higherthan those found in education.Absenteeism based on perceptions provide some orders of magnitudeof nonattendance, but may be less objective than therecorded observations or surprise visits discussed above. Nonethelessthey are instructive.Absenteeism is considered the most serious corruption problemin Colombia, but perception of absenteeism varies across the sixLatin American countries for which qualitative survey data are available(Giedion, Morales and Acosta, 2001). Surveys of hospital nurses’perceptions of the frequency of chronic absenteeism among doctorsreported rates of 98 per cent in Costa Rica, 30 per cent in Nicaragua,38 per cent in Colombia (Giedion, Morales and Acosta, 2001) andbetween 24–31 per cent across public and social security hospitalsin Argentina (Schargrodsky, Mera and Weinschelbaum, 2001). InPeru estimates of hours absent from work ranged from 12 to 36hours (Alc‡zar and Andrade, 2001) across the sampled hospitals.Shaving off hours is more commonly reported than absent days inall the Latin American country surveys. Late arrival and early departureonly represented 2–23 per cent of all absences in a four countrystudy (Uganda, Bangladesh, India and Indonesia) of medical personnelbased on surprise visits (Chaudhury, et al., 2004). The Colombiacase study above estimated that the cost of the lost time in the publichospitals of Bogot‡ was equivalent to over US$1 million per year.
Corruption in public health 87Focus groups in Ethiopia among health workers revealedcommon understaffing due to late arrivals, long breaks and ageneral disregard for the necessity of staffing clinics. Absences arefrequently motivated by responsibilities at second jobs. Lack of managementand manager’s reluctance to confront physicians inspireslower level workers to behave accordingly, leading to high absenteeismand low productivity at all levels. (Lindelow, Serneels andLemma, 2003)Where absenteeism is endemic, as was the case in Uganda,Rajasthan India and the Dominican Republic, such explanations arefar less compelling. One factor shared by all of the examples aboveis that absent health workers face almost no consequences. There isno accountability for public servants. Without accountability,abuses are more likely to proliferate and eventually undermine thehealth care system.Multivariate evidence for education provides some importantinsights. The correlates of teacher absences in five countriesproduced mixed findings but in at least three countries infrastructurequality mattered consistently, and, in some, Ministry of Educationinspections were also associated with lower absenteeism.Education of mothers, community oversight, location of schools andthe training of teachers, had perverse or insignificant effects onabsenteeism. To the extent that inspectors were indeed a tool ofaccountability, they had some effect in Ecuador, India and Indonesiabut no effect at all in Peru and Uganda. The consequences of highabsenteeism were not discussed nor were any other forms ofaccountability (Chaudhury et al., 2004).Absenteeism is symptomatic of an unaccountable and ineffectivegovernment, and leads to contempt for government, itspolicies and practices, and compromises both access to and qualityof health care services. Unproductive or absent workers who donot receive any punishment for substandard performance andwhose promotion and pay remain the same as those with betterperformance, undermine morale and reduce output, which in turnleads to a spiral of overall poor performance. Accountability is
88 Fighting the Diseases of Povertymeaningless or doesn’t exist without sanctions, and institutionssuffer accordingly.Purchasing public positionsThe insidious practices of selling public positions and requiringbribes for promotion fundamentally undermine good performanceand builds a corruption spiral since the newly hired and promotedmust find the resources to ensure their continued employment andadvancement. The practice has been documented for much ofEastern Europe and Central Asia where the breakdown of governmentled to the commercialization of public positions (Kaufman,Pradhan and Ryterman, 1988). Outright purchase of public employmentthrough bribes is often anecdotally accepted, but some recentwork has tried to quantify it. Evidence from surveys of public officialsin Latvia, Armenia and Georgia showed that the “cost” ofpublic positions was well known among public officials and thegeneral public. Interestingly the higher cost jobs were in the mostcorrupt enclaves of government (Kaufman, Pradhan and Ryterman,1988).In Bosnia and Herzegovina bribes were particularly common inthe health sector with surveys of officials and citizens reporting that75 per cent thought bribes were required for obtaining positionsand for promotion (World Bank, 2001e). In Ghana 25 per cent of jobswere allegedly bought in government hospitals. In Uganda 20 percent of municipal officials acknowledged that the practice occurredin the health sector, and in the Philippines 3 per cent noted it (Azfar,Kahkonen and Meagher, 2001).In focus groups in Ethiopia health officials complained aboutunfair hiring practices, nepotism and preferential treatment to wellconnected individuals. Similarly in the Dominican Republic “patronagepropelled personnel rolls” leading to one of the highest rates ofhealth personnel to population in the region. Promotions routinelyrely on recommendations from politicians, and military authoritiesthat lead to a mismatch between skills and needs (La Forgia et al.,2004). An earlier study found that most care was already provided
Corruption in public health 89by under-trained medical students operating on patients withoutsupervision (Lewis, La Forgia and Sulvetta, 1992).Staff accountability for misconduct is rare. Its absence inaccountability is noted for the Dominican Republic (La Forgia et al.,2004), although Cohen (2002) reports that in Costa Rica 27 per centof users know of a case where sanctions were imposed or a publicemployee was terminated for corruption or theft. So there are somecountries where at least egregious misconduct is disciplined.Collusion among public officials has also been identified as perpetuatingcorruption. In Bosnia and Herzegovina (World Bank,2001e) 35 per cent of officials said health colleagues who refusebribes face retribution, and similar views were expressed in focusgroup discussions among public health staff in Ethiopia.Supplies: mismanagement and corruptionAvailability of drugs and supplies complement health professionalsand their absence reflect poor management or corruption.Drug management and leakageVirtually all qualitative studies that have probed this issue haveemerged with the view that quality and drug availability are virtuallysynonymous, and lack of drugs has been repeatedly shown todiscourage utilization of public facilities (World Bank, 2005a). Arecent in depth assessment of the Costa Rican pharmaceuticalsystem’s registration, drug selection, procurement, distribution andservice delivery revealed both great strengths and glaring weaknesses.The study used a combination of (i) interviews with publicofficials; (ii) industry interviews with local pharmacies and multinationalcompanies; (iii) focus groups with health care professionals;and, (iv) exit surveys for a representative sample of patients.Clear publicly available procedures, pharmaceutical lists andcriteria; reliance on defined, generic drugs; and distribution auditswere deemed excellent. The greatest weaknesses were in procurement,specifically in the lack of performance monitoring, qualitymonitoring, audits and uncontrolled political interference; and in
90 Fighting the Diseases of Povertydistribution where inventory management, security and informationsystems were found particularly deficient. Alleged abuses inservice delivery by both health professionals and patients wereattributed to lack of controls in prescribing and supplying drugs topatients.Surprisingly, half of exit survey respondents had not received aprescribed drug due to non-availability, an important indicator ofineffectiveness (Cohen, 2002). Costa Rica’s strong record in healthcare delivery and its relatively higher income, greater healthspending and education levels among developing countriessuggests the difficulty and challenges inherent in managing healthsystems and drugs in particular.Drugs tend to be a commonly “leaked” product given that it canfetch a higher price in the private market. In Ethiopia users andproviders explained in focus groups the rampant stealing of publicsector drugs, their resale in the private market and the commondealings in contraband medicines. They acknowledge the lack ofdrugs in the public sector and the ready availability of those drugsin private pharmacies and clinics. A health officer in Addis Ababanoted that “most health workers are involved in such things [theft]”attributing this to “outside temptations” and low pay of publicservants (Lindelow, Serneels and Lemma, 2003). Surveys in Nigeriafound that 28 PHC facilities had not received drugs from the federalgovernment in two years, and a World Bank study reported that lesthan half the facilities in Lagos and Kogi states had governmentsupplied drug stock in 2001 (Adeniyi, 2001). In Costa Rica 32 per centof users indicated that they had prior knowledge of theft in governmentpharmacies (Cohen, 2002), and in a hospital study in theDominican Republic comparing patient prescriptions and records ofadministered drugs a significant proportion of drugs went missing.The average leakage rate for drugs in Uganda was estimated at 73per cent, ranging from 40 to 94 per cent across 10 public facilities.High demand drugs, such as those to treat malaria, were the leastavailable to patients because health workers and the Health UnitManagement Committee members, the entities meant to provide
Corruption in public health 91local oversight, expropriated them (McPake et al., 1999). A laterfacility exit survey in Uganda shows much higher drug availabilityand distribution, however (Lindelow, Reinikka and Svensson, 2003).In China various studies indicate that on average about 30 per cent ofpublic drug supplies are expired or counterfeit (Hsiao, 2005), suggestingpoor logistics management, limited oversight and graft.More insidious and difficult is drug mishandling from the importationof substandard medications, to the repackaging of drugs, substitutinglower cost/quality medications, to the pilfering of drugsupplies at points of service (e.g., clinics and hospitals). The healthconsequences of tampering can be serious, but rarely traced to thesource of the problem due to ignorance, lack of regulation andenforcement.In-kind supplies from patientsInterviews and focus groups from around the world reveal thecommon need to either bring or purchase basic supplies (e.g., bedsheets, bandages) or drugs (Narayan, 2000; Lewis, 2000, 2002) andin some instances equipment. The concentration of private healthservices adjacent to public hospitals and clinics in many countriesattests to the chronic shortages of basic inputs and malfunctioningequipment. In Kyrgyz Republic in 2001 among hospitalized patients98 per cent brought food, 73 per cent linens, 80 per cent had familymembers purchase drugs and 76 per cent supplied medical supplies(Falkingham, 2002). Similarly in Tajikistan in 1999 77 per cent spenton food, 93 per cent on medicines and 51 per cent for medicalsupplies (Falkingham, 2004). Thus the health care system suppliedlittle of the operating inputs in either country. Patients paid for 50per cent of drugs in the Dominican Republic hospital (Lewis,LaForgia and Sulvetta, 1996).In Nigeria 25 per cent of health facilities had about half of theminimum package of equipment, while 40 per cent had less than aquarter of what was needed (World Bank, forthcoming). In Ethiopiatwo separate surveys revealed that only 21 per cent of public hospitalshad autoclaves (sterilizers) and 46 per cent had functioning
92 Fighting the Diseases of Povertyoperating theaters, both serous shortcomings given the spreadingAIDS epidemic and the high volume of patients (World Bank, 2005b).A study in Udaipur district in Rajasthan, India found patchy availabilityof basic equipment in health facilities with only a quarterhaving sterilizers. A third of sub-centers lacked a stethoscope, thermometeror scale (Banerjee and Duflo, 2005).Corruption in the supply chainGraft and padding of billings form a commonly identified form ofcorruption in the public sector, and health care is no exception. Theconstant need for supplies to complement the skills and infrastructureinvestments of government offer an opportunity for petty theft.Siphoning of public funds for private gain can occur in thetransfer of funds from public treasuries to ministries of health, fromthe ministries to their provider units, and within the provider unitsthemselves. All of these levels provide opportunity for theft. Misuseof funds often occurs in the process of tendering and payment,something all countries need to guard against through required proceduresand regular audits. Having clearly articulated policies andprocedures, adherence to policies and regulations, and consistentenforcement of rules discourage illegal behaviors.In a 4 province survey across 80 municipalities in the Philippinescorruption perceptions of households was negatively associatedwith providers’ knowledge (of required immunizations), which inturn was strongly related to immunization coverage and diseaseincidence in the survey areas. Although significance is not highlyrobust in all cases, the analysis illuminates the negative relationshipbetween corruption and performance at the local level (Azfar,Kahkonen and Meagher, 2001).The contracting process for construction and the purchase ofsupplies offers a traditionally rich source of returns for corrupt officialsand suppliers through kickbacks, over-invoicing or outrightgraft. A recent study of 7 Latin American countries provides insightson overpayment for supplies (DiTella and Savedoff, 2001).In Argentina, Bolivia, Colombia and Venezuela overpayment for
Corruption in public health 93supplies in public hospitals points to corruption. Perceptions ofstaff, their assessment of the probabilities of getting caught andbeing punished, and examination of hospital records and comparingthese with market prices suggest that irregularities are rife. Figure4 shows the ratio of highest to lowest purchase price for fourcommonly stocked medical supplies – saline solution, cotton,dextrose and penicillin – across hospitals in each of the four LatinAmerican countries for which data exist. The poor procurement performanceunderlying the purchases were attributed to gross mismanagementor corruption (Di Tella and Savedoff, 2001).In Colombia, it is estimated that about 11 per cent of costs couldhave been saved if accepted public tendering rules had beenfollowed (Giedion, Morales and Acosta, 2001). Results from surveysof physicians and nurses in Argentina (Schargrodsky, Mera andWeinschelbaum, 2001), Colombia (Giedion, Morales and Acosta,2001) and Venezuela (JaÎn and Paravisini, 2001) show that corruptionwithin facilities leads to overpayment of suppliers, and thatcombined with the lack of punishment and the low probability ofgetting caught make it possible. In short, the lack of enforced rules,procedures and accountability effectively allows irregularities inpurchasing practices.In Argentina a similar finding emerged. When the health systemtransparency policy was introduced the prices of procured suppliesdropped sharply but rose again once the policy was no longerenforced (Schargrodsky, Mera and Weinschelbaum, 2001). InColombia price variations were statistically significant across purchasesof public hospitals, and particularly different where theyignored the price lists negotiated and endorsed by a local NGOunder contract to the government (Giedion, Morales and Acosta,2001).Direct and specific evidence is harder to come by. However, inGhana interviews with officials and the public suggest that 21 percent of procurements in government hospitals are corrupt, and 18per cent of the value of contracts is required in kickbacks to publicofficials (World Bank, 2000d). Petty theft in the aggregate can lead
94 Fighting the Diseases of PovertyFigure 4 Comparison of purchase price difference for selectedmedical supplies across public hospitals in four LatinAmerican countriesRatio of highest to lowest price40 Bolivia (1998)353025Argentina (1997)Venezuela (1998)Colombia (1998)20151050Saline solution Cotton Dextrose PenicillinSource: Di Tella and Savedoff, 2001to significant losses, making it not so petty. Anecdotal evidence isabundant, but hard evidence elusive. Qualitative work hasunearthed some strong perceptions and knowledge of petty theftproviding a sense of its importance, and lending credence to allegationsof theft.Petty theft was considered very common in Costa Rican hospitalswhere 83 per cent of nurses reported thefts (Di Tella and Savedoff,2001), and in Venezuela where roughly two-thirds of health personnelwere aware of stolen materials, equipment or drugs (JaÎn andParavisini, 2001). In Peru, theft by both physicians and nurses wasviewed as the most common form of corruption, with the highestestimated prevalence in Ministry of Health hospitals – 22 per cent,double that reported for Social Security hospitals (Alc‡zar andAndrade, 2001).
Corruption in public health 95The lack of discipline and oversight makes it easy for corrupt officialsto report higher costs for supplies, food and other goods andto pocket the difference. Even in developed countries, pharmaceuticalsand supplies tend to be locked and closely inventoried to tracksupplies and drugs on a continuous basis because theft poses somuch of a threat. Most public health systems in developing andtransition countries lack the ability to limit access to drug suppliesand the infrastructure to control access, although there are someexceptions. The absence of information systems for supplies anddrugs, and an inability to sanction (or hold accountable) abusingstaff makes control of theft particularly challenging.Flow of fundsSubsidized health care is meant to rely on public funding and minimally,if at all, on patients. In many places, bureaucratic problems,corruption and mismanagement lead to inadequate public funds atthe point of service and the informal charging of patients compensatesfor inadequate salaries and gaps in discretionary budgets. Atthe same time informal charging may have serious equity implicationsundermining the objectives of subsidies.Leakage of public fundsWhether public resources for staff and other inputs reach the frontline – the clinics and hospitals that deliver the services to the population– is critical to a functioning health system. The World Bankhas pioneered efforts to measure the extent of leakage, that is, theamount of the line ministries’ budgets that reaches the intendedcommunities and the schools, clinics and hospitals funded throughnational transfers. These public expenditure tracking studies (PETS)simply follow the flow of funds through the labyrinth of governmentbureaucracy to determine if funds reach each of the designatedlevels.First applied in education, PETS identified key problems of effectivepublic management. In Uganda, 87 per cent of funds neverreached the schools (Dehn, Reinikka and Svensson, 2003). In Zambia
96 Fighting the Diseases of PovertyTable 3 Leakage rates for health care, selected countriesCountry Year Leakage rate Type of expenditureGhana 2000 80% Non-salary budgetPeru 2001 71 “Glass of Milk” ProgramTanzania 1999 40 Non-salary budgetUganda 2000 70 Drugs and suppliesSource: Lindelow, Kushnarova, and Kaiser, 2005it was 60 per cent. Table 3 summarizes available evidence for thehealth sector in four countries: Ghana, Peru, Tanzania and Ugandawhere leakage is 70 per cent or higher in all but Tanzania. Highleakage means inadequate funding for non-salary spending, whichmakes the job of service delivery exceedingly difficult and necessarilyimposes on patients to finance “free” health care throughfinancial or in-kind contributions. In Nigeria, Papua New Guinea,Rwanda, Senegal, there is evidence of leakage but neither the levelsnor the sources of the problem have been determined. Leakages area reflection of delays and bottlenecks in budget execution andsupply management, poor record keeping and underutilization ofaudits, as well as incompetence and criminal acts. Incomplete anderror riddled records complicate efforts to track financial flows,which is why so few countries have comparable data despite thenumber of country studies undertaken.In the case of education in Uganda, informing the public ofexpected school transfers and reporting receipt of funds to the communityled to dramatic increases in non-salary budgets. Effectivelythe community monitored and pressured local officials to make surethat funds were applied as intended (Reinikka and Svensson, 2004).Informal paymentsInformal payments can be defined as “payments to individual andinstitutional providers, in kind or in cash, that are made outsideofficial payment channels or are purchases meant to be covered bythe health care system. This encompasses ‘envelope’ payments to
Corruption in public health 97physicians and ‘contributions’ to hospitals as well as the value ofmedical supplies purchased by patients and drugs obtained fromprivate pharmacies but intended to be part of government-financedhealth care services.” (Lewis, 2000, 2002). More specifically they areunder-the-table payments to doctors, nurses and other medical stafffor jumping the queue, receiving better or more care, obtainingdrugs, or just simply for any care at all.Informal payments create a parallel market for services withinpublic health care systems, and, like the informal sector, informalpayments are typically illegal and unreported. They can be considereda form of corruption, but may just be symptomatic of bad management.While only recently defined and discussed, what emergesfrom the data is, surprisingly, how widespread informal paymentshave become.A major challenge is differentiating informal and gratitudepayments given the official co-payment, bribes and gifts thatpatients pay. Where all fees have been banned any payment byhouseholds is clearly unofficial, but in many countries formal feesexist, blurring the dichotomy. It then becomes the level of payment,the nature of the transaction and its timing that become relevant fordistinguishing the nature of the payment. For example, in KyrgyzRepublic in 2001 95 per cent of those who paid for services did notreceive a receipt while only 3 per cent reported giving a gift to thehealth personnel and the time of service (Falkingham, 2002). ABolivia study showed that perception of corruption was associatedwith the size of informal payment with a significant coefficient of.34 (Gatti, Gray-Molina and Klugman, 2004).Ex post transactions are particularly problematic because postservicegratitude gestures are common and often expected. Whereproviders insist on direct pre-payment without involvement ofofficial cash windows, refuse patient care without the fee, receivedirect payments for specific tasks, or refuse basic services without a“tip” (e.g., such as moving patients from room to room, or givinginjections) informality of payment is likely.Figure 5 summarizes the frequency of informal payments to
98 Fighting the Diseases of Povertypublic health care workers among users of health services based onsurvey data from various sources. The frequency range is enormousfrom 3 per cent in Peru to 96 per cent in Pakistan. Regionally SouthAsia stands out for its heavy reliance on informal payments. EastAsian experience is split between Thailand and Indonesia with lowlevels and the former Communist countries, with Cambodia at 55per cent and a dated estimate for Vietnam at 81 per cent. The proportionsfor Latin America and Eastern Europe have a wide distributionwith low levels in some countries and among the highest inothers, making generalizations meaningless. Recent evidence fromsmaller samples in Africa suggests that informal payments ofvarious kinds are common in Uganda (McPake et al., 1999), Mozambique(Lindelow, Ward and Zorzi, 2004) and Ethiopia (Lindelow,Serneels and Lemma, 2003). In all three, patients pay publicproviders directly for consultations and drugs over and above anyformal charges.Data sources vary with much of the information coming fromeither household surveys or governance and corruption studies,although some, like Bolivia (2002), Moldova, Kazakhstan (1999) andPoland used dedicated health facility exit surveys 5 , and Albania(2002), Bolivia (2001) and China used province level surveys, and theIndia data are from a district in Rajastan. Where both large householdsurveys and smaller studies exist for the same country, thelatter always shows higher informal payments. Kazakhstan exhibitsdramatically higher payments in the 2002 survey over the 2001LSMS. Albania’s overall LSMS estimate in 1996 was 22 per cent, butjumped to 28 and 60 per cent, respectively, for outpatient and inpatientcare in the smaller 2001 survey.Whether this is due to the greater attention to the issue withdedicated surveys and smaller samples that allow drilling down sufficientlyto obtain reliable information on a sensitive subject, orother factors it suggests that some of the broader surveys underestimatethe extent of patient payments.Low levels of informal payments in Peru, Paraguay, Thailandand Kosovo may reflect the existence of and reliance on private
Corruption in public health 99Figure 5 Proportion who make informal payments amongusers of health services, selected countriesAlbania (2001)Armenia (2001)Bosnia (2002)Bulgaria (2001)Croatia (2002)Czech Republic (2002)Hungary (2002)Kosovo (2000)Kyrgyz Republic (2001)Latvia (1998)Macedonia (2002)Moldova (2002)Romania (2000)Russia (2002)Slovakia (2000)Bangladesh (2002)India (2002)Nepal (2002)Pakistan (2002)Sri Lanka (2001)Bolivia (2002)Colombia (2001)Paraguay (1999)Peru (2001)Cambodia (2000)Indonesia (2001)Thailand (2000)Vietnam (1992)Ghana (2000)0 20 40 60 80 100 120Source: See Source Appendix Isector alternatives that require significant out-of-pocket paymentswhere consumers tend to have more influence on performance.The Czech Republic appears odd given the rest of ECA but consis-
100 Fighting the Diseases of Povertytent with other findings. Public providers with a monopolyposition are in a stronger position to charge patients extra for theirservices.Kosovars have not had access to public health care for decadesand have financed care out of pocket to private providers. Thais toorely on the private sector for some of their health care. The higherrates reported for Colombia and Bolivia, however, would questionthat explanation since Colombia has a large private health systemnot too different from Peru’s. The differences may reflect differentdegrees of oversight in public clinics and hospitals, but more indepthwork would be necessary to reach a firm conclusion since theapproach to measuring informal payments varies across countries.Figure 6 extends the informal payment distribution to encompassdifferences in outpatient and inpatient payments and includessome countries from Figure 5. With the exception of Bulgaria, inpatientcare is more likely to be financed via informal payments, andoften the disparity between the two types of services is dramatic, asis the case with Bangladesh, Tajikistan, Armenia and Albania.Evidence for four Eastern European countries (Czech Republic,Hungary, Poland and Romania) reveals that formal payment areassociated with primary and outpatient specialist care and informalpayments with surgery and inpatient services (Belli, 2002). Householdseither feel the need to pay for hospitalizations or providersdon’t give them a choice insisting on payment if services are to berendered.Perception surveys of providers or citizens offer additionalinsights. In Costa Rica 85 per cent of medical staffs indicated thatunder-the-table payments to physicians were common, and half ofpatients said they made payments in public facilities roughly equivalentto 50 per cent of a private sector consultation. In Bolivia theincidence of informal payments was significantly correlated withperceptions of corruption in specific public hospitals, and 40 percent of interviewed patients acknowledged making illicit paymentsfor care (Gray-Molina et. al, 2001), this is similar to the results of ahousehold survey in 106 Bolivian municipalities reportedly that 45
Corruption in public health 101Figure 6 Proportion of patients making informal paymentsby type of service, selected countriesAlbania (2001)Armenia (2001)OutpatientHospitalBangladesh (2002)Bulgaria (2001)China (n.d.)Ghana (2000)Kazakhstan (1999)*Kazakhstan (2001)Kosovo (2000)Poland (2002)Romania (2000)Russia (2002)Slovakia (2000)Tajikistan (1999)Uganda (2003)0 10 20 30 40 50 60 70 80 90 100*Date of survey.Source: See Source Appendix Iper cent of patients paid informally (Chakraborty et al., 2002). Interestingly,national surveys for Bolivia show that over 60 per cent ofthose interviewed considered health to be corrupt.A comparative study in five South Asian countries (Bangladesh,India, Nepal, Pakistan and Sri Lanka) found that in all but Sri Lankamost payments were ex ante demands from providers. Bribes arerequired in all five countries for admission to the hospital, toobtain a bed, and to receive subsidized medications (Thampi,
102 Fighting the Diseases of Poverty2002). In Bangalore, India citizen feedback surveys revealed thatinformal payments were made to ensure proper treatment, butthey were typically demanded by providers and 51 per cent ofthose interviewed indicated they had paid bribes in governmenthospitals and 89 per cent in hospitals in small cities, but they alsopaid informally in the private hospitals (24 per cent). More dramatically,bribes were paid to nurses in maternity homes somothers could see their infants (Gopakumar, 1998). In Albaniaamong the 60 per cent of patients who received care 43 per centsaid the gift was requested (World Bank, 2003a). Using focusgroups of patients and providers Shahriari, Belli and Lewis (2001)explain the virtual market for publicly provided care in Poland.Informal payments have become the way to obtain the services ofspecific physicians, with pricing reflecting reputation and demand.It is an implicit form of insurance for possible future needs, andprices are commonly known. Thus the process of negotiation andpayment for health services may be informal but it has become avery sophisticated market in Poland.The motivations of health staff and patients in relying on underthe table payments are strong. Physicians argue that low pay, irregularsalary payments, lack of government attention and the need tokeep services going requires drastic action, and patient contributionsoffer the only source of funds to fill the gap (Bloom Han andLi, 2001; Belli, Shahriari, Lewis, 2001; Lindelow, Serneels andLemma, 2003; Kutzin et al., 2003). Patients on the other hand alsosee low pay as an impetus to contribute, but traditions of gratitudeas well as concerns for some future need also play a role.In Ethiopia feedback from policymakers, experts and healthworkers revealed that inappropriate payments are rife in the healthsector. Patients typically must pay for every service and each item,from registering to paying bribes for changing bed sheets to drugsand supplies (Lindelow, Serneels and Lemma, 2003). Similar reportsof itemized charging emerged from qualitative work in Georgia(Belli, Shahriari and Gotzadze, 2004) and Poland (Belli, Shahriari andLewis, 2001) where there too the public system has become a fee-for
Corruption in public health 103service entity. Qualitative studies explore this in some depth.Consumer confusion about the official or unofficial nature ofpayments is common. Patients pay but they don’t always know whyand they often do so at multiple locations or for different “services”(Belli, Shahriari and Gotzadze, 2004; Narayan, 2000; Killingsworth etal., 1999).Multivariate analysis sheds further light on some of the underlyingmotivations for informal payment as well as whether patientrevenues are well spent. In Kazakhstan Thompson’s (2004) econometricanalysis of patients discharged from three hospitals inAlmaty City concluded that informal payments made in the admissiondepartment before treatment, and the amount paid subsequentlyat both admissions and hospital wards shortened admissiontime for surgery. He found longer lengths of stay associated withpayments to both the admission department and directly to individualproviders on the wards, and perceived patient qualityincreased with the amount paid informally. These results confirmthe assumption that patients pay to receive more attentive and“higher quality” care as they perceive it. Longer lengths of stay donot necessarily mean better clinical care, but shorter waits, longerhospital stays and better treatment by medical staff tend to bevalued by patients. In Kazakhstan paying ensures that health caremeets the demands and perceived needs of patients.Of concern is the relative cost of the services to patients, andnumerous studies point out the impact on the poor. Figure 7 summarizesthe available data showing the average cost of an outpatientvisit or hospital admission as a per cent of half monthlyincome, roughly equivalent to median income (source). The level ofinpatient payments far exceeds the amounts paid out for outpatientservices and numerous studies document the extent of hardshipsome households face in meeting these costs. Inpatient costs canexceed annual family income forcing the sale of assets or the accumulationof debt in order to afford care (Lewis 2000, 2002; Falkingham2002, 2004; Killingsworth et al., 1999). Selected studies inChina of “red packages” paid to providers report that payments
104 Fighting the Diseases of PovertyFigure 7 Average informal payments as percentage of halfmonthlyper capita income, selected countries(int’l $ PPP)Albania (2002)Albania (2002)*Armenia (2001)Bangladesh (2002)Bolivia (2001)Bulgaria (2001)Cambodia (1999)China (1994) ‡Ghana (2000)India (2002)India (2003)Kazakhstan (2002) †Krygyz (2001)Pakistan (2002)Peru (2001)Russia (2002)Sri Lanka (2001)Tajikistan (1999)Thailand (1999)InpatientOutpatient0 50 100 150 200 250*Survey of 2,000 households in three Albanian provinces. †Based on hospital exit surveys.‡Percent calculated as average across various studies. Striped bar indicates referral hospitals.Sources: World Bank LSMS; Murrugarra 2003; Falkingham 2000 and 2001; Transparency <strong>International</strong>2002; World Bank 2000b, 2000d, 2001a; Phongpaichit 2000; Bloom, Han and Li 2001; Banerjee andDuflo (2005)average between 140–320 yuan per hospital visit (US$16–36), withreferral hospitals averaging 400 yuan (US$44), roughly 90 per centof half monthly income (Bloom, Han and Li, 2001).Two studies in Albania showed different aspects of the informalpayment issue. The analysis of a three province survey showed thatrural residents were more likely to pay for services though they paid
Corruption in public health 105about the same as those in other income brackets when they didpay, and income had no effect on the probability of having to pay(Hotchkiss et al., 2005). Estimates of the price elasticity of smallincreases in the price of health services using a national representativesurvey found almost no effect, indicating that patients are notparticularly price sensitive in Albania (World Bank, 2003a).Exemption for fees offers the potential for husbanding scarceresources for those least able to afford health care. Many systemshave instituted such procedures to retain the benefits of copaymentswithout unduly burdening the poor (World Bank, 2004).Evidence on effectiveness, however, suggests problems with theapproach. In Bangladesh data from interviews and observation in asample of four hospitals showed that 75 per cent of the time thelowest income group paid the least amount both officially and unofficially.In the outlier institution the poor paid more than the wealthiestgroup but the same as or less than the middle income patients.Payments are also standardized and routinized with specific timeperiods for charging during inpatient stays rather than at discharge(Killingsworth et al., 1999).In Rajasthan, India patients regularly pay for “free” outpatientcare, though the poorest patients pay 40 per cent less than thehighest income patients, though it should be noted that in thispart of India everyone is poor it is simply a matter of degree. Onaverage 7.3 per cent of total household spending goes to payingfor health care (Banerjee, Deaton and Duflo, 2004). In Ugandaexemptions were extended to the politically powerful and thoseoverseeing the local health care program (McPake et al., 1999), aperverse version of exemption meant to ensure equal access butin this case subsidizing the better off. Central Asia’s experiencehas not been encouraging either with minimal exemptions forlower income patients (Falkingham, 2004). Evidence from Kazakhstanshowed that for major illnesses the lowest income householdsspent more than twice their monthly income for health carewhile the wealthiest households spent the equivalent of half theirmonthly income reflecting the lack of exemptions for the poor
106 Fighting the Diseases of Poverty(Sari, Langenbrunner and Lewis, 2000).Informal payments are much more widespread than commonlythought. Indeed, donors and governments have urged banning usercharges in the interests of equity in access to health services.Sweeping removal of a reliable source of revenue for equity reasonsmeans that those who can and cannot pay receive free care.However the strategy could simply encourage under-the-tablepayments from both sets of patients since patients already pay andin some cases can afford treatment. While there is some suggestionfrom Kyrgyz Republic (Kutzin et al., 2003) and Cambodia (Barber,Bonnet and Bekedam, 2004) that instituting formal fees can serve tocurtail informal payments, the impact of removing fees has not beenassessed. Anecdotal evidence suggests a rise in informal arrangements,but documentation has not confirmed this.Mismanagement in health care service deliveryOften irregularities and poor governance simply stem from poormanagement. Where incentives for strong performance either don’texist or are undermined by ineffective management it is not surprisingthat productivity and performance suffer. For example, ifstaff advancement caps after a single promotion, a common patternin many countries, then the incentives to excel are diminished. Bythe same token the inability to fire public sector staff even in theface of embezzlement or nonattendance erodes managers’ authorityand the public sector’s ability to hold staff accountable. The lackof carrots and sticks dis-empowers public management and thwartsefforts at accountability.Evidence on mismanagement is spotty. The core issues includehuman resource management and supervision, basic subsystemsfunction (e.g., procurement, drug logistics), efficiency of fiduciarytransfers, input availability, and satisfaction of the target population.Overall management of health systems, hospitals and clinics typicallyfall to physicians, few of whom have the training or experiencenecessary to effectively carry out their jobs. This poses a major
Corruption in public health 107problem in Turkey as they move to reform the health system (WorldBank, 2003c), and was at the heart of ineffective service delivery inthe Dominican Republic (La Forgia et al., 2004). Disincentives togood performance often are due to rigid civil service rules that limitpromotion and pay differentials that could be used to rewardsuperior performance. At the same time low productivity or outrightabuses can go unnoticed (Lewis, LaForgia and Sulvetta. 1992).Low wages also lead workers to seek additional employmentoutside government. In Kogi State, Nigeria, 42 per cent of the staffhad not been paid their salaries for more than 6 months in the pastyear (Das Gupta, Gauri and Khemani, 2003), converting staff intovirtual volunteers and eroding the credibility of the health system.In addition to the Nigeria state, reports from Ethiopia, Mozambiqueand Uganda (Lindelow, Serneels and Lemma, 2003; Lindelow, Wardand Zorzi, 2003; Azfar and Gurgur, 2001) indicated that the need tohave additional sources of income effectively compromisedproviders’ ability to carry out their public duties on the scaleintended. In qualitative surveys health workers said they missedwork or cut short their hours to devote time to other economicactivities. Another study in Nigeria showed that the greater the lagin paying salaries the more likely health workers were to engage inpharmaceutical sales and seek other employment in the privatesector (Khemani, 2004). Family survival therefore plays a role inabsenteeism and low productivity.Evidence from a number of countries suggests that vague andpoorly understood policies, uneven recordkeeping and minimal useof such information contribute to poor management. An assessmentin Nigeria found a low level of knowledge among Federal Ministryof Health (FMOH) staff regarding standard procedures and regulations,and current budget allocations. Moreover, current budgetsand expenditures did not correspond (World Bank, forthcoming). InUganda staff records were inadequate. At the facility level only 56per cent of the staff are to be found in district records, but at thedistrict level there were an additional 109 staff (out of a total of 465)who do not show up on facility rosters (Lindelow, Reinikka and
108 Fighting the Diseases of PovertySvensson, 2003). In Honduras 2.4 per cent of staff were “ghost”workers and 5 per cent of staff had unilaterally moved to other locations(World Bank, 2001f).Poor recordkeeping capacity and failures to require acceptablereports in Mozambique (Lindelow, Ward and Zorzi, 2004) underminedhealth care delivery and regular availability of inputs. InNigeria, existing management information systems were deemedineffective due to complicated and obscure reporting requirements,incomplete record keeping and low capacity (World Bank, forthcoming).Drug management in Costa Rica, a well run middle incomecountry, exhibits particular weaknesses in logistics and distributionattributed to flawed information systems and inadequate monitoring(Cohen, 2002). Each of these represent deficient aspects ofrecordkeeping that compromise efforts at management.Poor management also appears to signal corruption in someinstances. In Bolivia multivariate analysis showed a significant associationbetween longer waiting time and corruption indicators(Gatti, Gray-Molina and Klugman, 2003), and in the Philippines perceptionsof corruption in public health services discouraged use ofpublic facilities, particularly in poor communities (Azfar and Gurgur,2001). Corruption no doubt is associated with bad management, thequestion remains as to whether and how management flaws lead tocorruption.This brief review does not do justice to the complexity of theissue, and more attention to the problem of incentives and managementare warranted. Although a chronic weakness of healthsystems, management is critical to performance and improved effectiveness.Ensuring the availability of funds, hiring and deployingstaff, maintaining basic record systems, and tracking facility performanceare the basic ingredients for improving management andoverall health care delivery.<strong>Policy</strong> options for promoting better governanceImproving governance poses an important challenge to govern-
Corruption in public health 109ments in transition and developing countries, but there are goodexamples of things that can be done based on actual experiences.This section is divided by category to summarize the evidence andlink these lessons to specific agendas. Accountability and incentivesserve as threads across the components because they represent thekeys to better policy and outcomes.Key accountability measures include (i) information on performanceand impact, (ii) the ability to audit, (iii) the authority toreward performance, and discipline, transfer and terminate employeeswho engage in abuses; and (iv) answering to stakeholders onthe performance of public services. Accountability tends to beabsent due in part to measurement problems but also to minimalmanagement, oversight or evaluation of performance. The highdemand from patients for diagnosis and care when they fall ill, andthe difficulty in generalizing across medical conditions further complicateoversight and accountability.Improving government effectivenessThe health system that delivers health care is only as good as itsmanagement. This section focuses on government initiatives andmanagement tools that can raise effectiveness and performance.Adequate incentives for health professionals lie more in thestructure of the health care system and its financing than in limitedactions that fix existing arrangements. Fundamentally money needsto follow patients at least in terms of tying medical staff time tospecific patients. Paying providers whether they see (or areassigned) patients or not, and compensating under and over-performanceequally is both unfair and unlikely to build the trustneeded in a public health system. How that is accomplished is thechallenge, and there are options.The exception to money following patients may be capitatedpayments where physicians receive a fixed prospective payment foreach patient and extends services as needed. It has been shown tobe highly effective at providing the necessary incentives forproviders, but typically is combined with clear management and
110 Fighting the Diseases of Povertyoversight to ensure accountability. Physicians who don’t seepatients under capitation are managed to assure that they complywith requirements of contracts, so in the end money does followpatients.Adjustments to pay and benefits, clear criteria for hiring and promotion,defined discipline for misconduct and adequate training toequip workers with needed skills foster a functioning health system.How providers are paid has dramatic effects on performance, asevidence from the OECD countries attests. Payment methods are thecornerstone of incentives for productivity and performance andincreasingly developed countries have sought alternatives or atleast complementary means to reward performance and productivity.In most developing countries physician compensation remainssalary based. A review of the limited literature on the effect of salaryearnings on physician clinical behavior across the OECD concludedthat physicians whose earnings are based on salary rather than feefor-service,bonus payments or capitation showed lower productivity,lower levels of care and higher wound rates from surgery.However, salaried doctors facilitated cost control, a major concernin OECD health systems (Gosden, Pedersen and Torgerson, 1999).Low wages represent one area of potential temptation for corruption.Where earnings are low individuals have second and thirdjobs, but they also perceive that low wages entitle them to demandcontributions from patients. Civil service reform is often required toaddress egregious structural problems related to postings, promotionand pay, but the health sector can also serve as a pilot to launchimprovements that stimulate better performance. Alternativelyexperimentation with other payment arrangements may provemore effective.In Bolivia corruption was lower where management wasstronger and some form of oversight of staff existed, in this case,frequent written evaluations of performance, key inputs for rewardingand disciplining staff (Gatti, Gray-Molina and Klugman, 2004). Ineducation, inspectors were associated with lower absenteeism in
Corruption in public health 111some cases, and it may apply in health care. However, businesseffectiveness studies in the FSU show how inspectors can underminethe system through bribes to certify acceptable performance,so it is important to ensure that such arrangements are working asintended if they are adopted.In a recent experiment, Leonard (2005) assesses the importanceof training and incentives in determining physician performance inTanzania across a sample of public and private providers. He concludesthat while ability is important, institutional incentives, particularlythe ability to hire and fire staff, are far more powerful thaneducation or experience in explaining the quality of care providedpatients, offering an empirical basis for the priority of putting inplace incentives to foster improvements in health care.A fundamental initiative is the establishment of clear procurementand contracting rules. Evidence for Argentina and Colombiashows a potential role for effective oversight as discussed. To effectivelyachieve such results requires existence of clear rules, effectiveoversight to detect problems, enforcement of rules, and rewards andpunishments for good and unacceptable behavior, respectively. Thelack of minimal managerial order and oversight are fundamentalweaknesses in many public health systems which permit suchabuses. In fairness, however, battling these kinds of problemspersist in even the wealthiest countries and relentless effort arerequired to control corrupt practices.In the Philippines multivariate analysis found that the frequencyof audit by central government and autonomy of local governmentincreased immunization coverage, suggesting that local governmentscan benefit from authority, and auditing will furtherencourage responsible public performance (Azfar and Gurgur, 2001).In Madagascar, sanctions for misuse of funds led to systematic followingof financial procedures. Most important among sanctionswas criticism from supervisors and transfer to less desirable locations.Though the effect of accountability is diluted by the fact thatthe most common reasons for transfer is displeasing local officialswithout discussion or vetting of the merits of the transfer, frequent
112 Fighting the Diseases of Povertyaudits of financial records combined with consequences for staffwere successful in improving financing management, a cornerstoneof government effectiveness (Brinkerhoff, 2005).The nature of accountability and how to structure incentives isnot apparent from the evidence assembled here. Ostensible communityoversight has been assessed in Bolivia, Madagascar, thePhilippines, Uganda. The centralized hiring, promotion and deploymentof public health workers in all countries effectively neutralizesthe role of local supervision. If the consequences ofabsenteeism, taking of bribes and stealing of drugs are beyond theauthority of local boards or community oversight bodies then thoseinstitutions may bring the community together but they will haveno influence over the centrally managed health staffs, or servicedelivery responsiveness and access.Even where systems exist to promote accountability it does notnecessarily mean that they are effective. In Jigawa state in Nigeriahospital management committees meant to oversee and advisehospital managers rarely met, were unclear on their responsibilities,and had little involvement with strategic planning, targeting orbudget control (World Bank, forthcoming). In Madagascar, the factthat local committees were powerless beyond moral suasion ledproviders to ignore their hollow authority and instead respond tosupervisors who had a say in their destiny (Brinkerhoff, 2005). To beeffective community leaders need authority, and at the same timethey need to be accountable to the local citizenry.Local control where it goes beyond simply oversight holdspromise. Under the “Bamako Initiative” that gave communities inselected African countries control over health facilities in exchangefor sharing the financing burden showed impressive health statusimprovements in at least three countries. In Ceara, Brazil the stateinstituted a health worker outreach program with hired healthoutreach workers under contract to the state, and handed responsibilityfor supervision to municipalities. Local control led to betterhealth in the communities covered by the new state program(sources). In Bolivia corruption was lower where local organizing
Corruption in public health 113groups were active (Gatti, Gray-Molina and Klugman, 2003). Incontrast local control proved ineffective in Nigeria, Madagascar andUganda (World Bank, forthcoming; McPake et al., 1999; Brinkerhoff,2005) leaving the issue unresolved, but more experimentation andsystematic evaluations can help address this.Strategies to control informal payments entail both findingalternative sources of funding and better management. Raisingofficial fees as a substitute for under-the-table payments showedpositive effects on patient payment and utilization in two pilotprograms: in two regions in the Kyrgyz Republic, and a majorreferral hospital in Cambodia. In Kyrgyz Republic formal feesreduced informal charges as confirmed by both multivariateanalysis and data which showed the proportion of patients makingdirect payments to providers declined from 60 per cent to 38 percent while informal payments for the country as a whole rose to 70per cent. In-kind spending by patients for food and linens in thepilot regions with formal fees remained constant but spending fordrugs and medical supplies declined by over 50 per cent thoughthere was no change in the country as a whole. That combined withinsurance payments helped to make health care more affordable andquelled under-the-table payments (Kutzin et al., 2003).In Cambodia reorganization of hospital staffing combined with atransparent official fee policy, clearly designated exemptions, andretained fee revenue that supplemented physician salaries at levelscomparable to those earned under the informal arrangements led tomore reliable pricing, stable revenue and higher demand. Focusgroups identified the deterrent of informal payments to healthservice use, and the subsequent predictability and equity adjustmentsimproved access without compromising utilization orhospital revenue, the latter a critical component of compensationgiven salary levels (Barber, Bonnet and Bekedam, 2004). Twoinstances do not allow sweeping conclusions, but the fact that substitutinglegal for illegal payments and allowing the points ofservice to retain revenues proved effective suggests that it is astrategy worth pursuing further
114 Fighting the Diseases of PovertyAddressing some of the incentives behind informal paymentsprovide options for reform. Some alternative policies include: standardizingquality and access (e.g., waiting time), allowing and promotingalternative financing mechanisms through the privatesector (e.g., private insurance arrangements), and, within the publicsector, balancing the number of staff and resources so as to havefewer positions with higher pay. As discussed elsewhere higher paywill not necessarily address corruption by itself, but paying wagesthat are appropriate to existing labor market conditions, prohibitingside payments and holding providers accountable could togetherencourage more transparent and fair transactions, and offer incentivesfor better provider performance. Although it is expensive forcountries to raise wages in public health care services, a reform thatregularizes and improves pay has the potential to raise productivity.Higher productivity, in turn, would make it possible to providethe same amount of services or more, with fewer workers, therebyoffsetting some of the expected increase in the total wage bill. Inaddition, greater transparency in all fiduciary functions wouldimprove fairness and bolster effectiveness.In Venezuela, a study of public hospitals found that theft andunjustified absences declined with greater accountability,although the rate of approved absences rose, so reforms can beeffective but management objectives can sometimes be toonarrowly defined (Jaen and Paravinski, 2001). The issue should notbe absences per se but performance and both management andaccountability mechanism need to focus on these.Having government contract out services can often improve performanceof publicly subsidized services, partly because holdingcontractors accountable is far easier than doing so with publicworkers. Often government has few incentives to offer publicservants given rigidity in most civil service rules, but retainsleverage over contractors. Nonetheless contracting out is far from apanacea as it means developing regulatory capacity which variesfrom the standard tasks of providers and managers who operatepoints of service. Experience in Haiti (Eichler, Auzilia and Pollock,
Corruption in public health 1152001), Cambodia (World Bank, 2004) and Central America (La Forgia,2005) suggest that contracting out can work even in the lowestincome environments, the challenge is ensuring continued oversightand accountability of contractors. To date only the four CentralAmerican cases have a track record across elections.Consumer satisfaction surveys help build accountability. Exitsurveys, mini-household surveys or focus groups to elicit responseshelp gauge the strengths and weaknesses of public programs.Including these in annual reporting up the chain of command, andencouraging points of service to use these for managementpurposes would provide benchmarks for making public servicesmore responsive, and bolstering their impact and effectiveness.Controlling corruptionThis paper has described the wide range of irregularities that characterizehealth care services in developing countries and suggeststhat corruption flourishes where there are no standards of performance,oversight, or penalties for unacceptable behaviors. Theoptions discussed here have a track record, but the policy con<strong>text</strong>and actions taken by officials provide the needed detail that explainswhy certain policies were found effective. Policies themselves arenecessary but not sufficient as enforcement is equally important.Game results from an experiment in Ethiopia used to determinetemptation for corruption concluded that higher pay curtails thelevel of corruption, but only slightly, and that public servants appearto expropriate fewer resources when observability is higher, indicatingthat better oversight and exposing of inappropriate behaviorcan have a dampening effect on corruption (Barr, Lindelow andSerneels, 2004). In short, the potential for getting caught offers astrong disincentive for corrupt behavior.Corruption in the health sector is unlikely to be an isolated publicservice failure. Addressing irregularities across the functions of thesector – construction, procurement and distribution of drugs andsupplies, deployment of underpaid staff, under-the-table payments– requires an integrated, mutually reinforcing anti-corruption
116 Fighting the Diseases of Povertystrategy with strong political backing and a willingness to take aposition and follow through. Indeed, it may well require a government-wideanti-corruption agenda, as Poland has undertaken. Eventhere it isn’t enough to remove informal charges as the studies discussedhere indicate. Making clean government a priority allowsirregularities to be identified and addressed, which bolsters effortsin the sector to put in place effective oversight and detection, andendorses disciplining corrupt practices once detected. Without thewillingness to act on identified corruption countries are unlikely tobe able to control such practices.Highersalariesforpublicsectorworkersarefrequentlyproposedas a way to curb corruption, but the evidence is complicated and notstraightforward. Moreover, as discussed above, there may be bettermeans of compensating health professionals. In a study of the effectof civil service pay on corruption using cross-country regression andcontrolling for a wide array of factors, showed that wage levels couldaffect corruption but must rise dramatically to seriously reducecorrupt behavior (Van Rijkeghem and Weder, 2001). Although challengedon their corruption measures, Rauch and Evans (2000) find noeffect on corruption of higher public sector wages, and insteadpropose that employment security, recruitment and promotioncriteria, and management are of greater importance than salaryincreases. A study in Venezuela found a perverse effect with higherwages correlating with more corruption. Jaen and Paravinski (2001)interpret this as corrupt wage earners capturing wage settingthrougheitherinfluenceorbribes.Insum,despitetheviewthatsalaryadjustments will solve corruption the evidence suggests that whilewage levels may play a role in controlling corruption it is not guaranteedand other changes need to accompany higher earnings.An issue is whether the necessary increases required to eradicatecorruption are affordable and realistic for most low income countries.Some increases may be warranted but it would also mean staffreductions to accommodate higher pay. These are considerationsthat should accompany civil service reform plans meant to raisesalaries and curb corruption.
Corruption in public health 117The absence of basic information, regular audits and monitoringevidence define an environment that invites misconduct. AsColombia implemented Law 100 reforming its health care systemit unearthed extensive corruption and mismanagement in reportingand record keeping in public programs. In response theMinistry of Health set up a nationwide database for data matchingand payment controls to identify and correct abuses that wereresulting in paying “ghost” workers, among other problems. Thatcombined with a multimedia campaign informing citizens of theirrights and obligations under the newly reformed system provideda segue-way into better oversight and involvement of citizens(Soto, 2002).Drug procurement poses multiple challenges and Chile’s experienceis instructive in how to institute reforms that serve multipleobjectives. Chile’s drug and medical supply system run by the government,CENEBAST, was plagued with poor management, frequentstock outs and overstocks of other medicines. The reform was builtaround a shift from a rules-based system to one grounded in transparencyand good incentive structures. Its main components were:(1) introducing electronic bidding for pharmaceuticals; (2) reform ofCENEBAST to change its mandate to procurement agent for hospitalsand other providers who define drug priorities; and (3) informationdissemination that let it be known that pharmaceuticalprocurement would be under scrutiny. An important element of theinstitutional reform was allowing other agencies and the privatesector to purchase, store and transport drugs, removing CENEBAST’smonopoly position.The reform reduced information asymmetries between providersand the procurers of pharmaceuticals. and produced clear and fairrules resulting in bids from a broader spectrum of companies andlower prices for government hospitals and clinics. Overall in 1997,US$ 4 million was saved just in pharmaceutical purchases (Cohenand Montoya, 2001).Nigeria has taken an aggressive stance on the issue and has rootedout considerable illegal manufacturing, identified substandard
118 Fighting the Diseases of Povertyimportation, recalled all “repackaged” drugs, and ensured thatdrugs meet a basic standard of potency, labels are clear and correct,distribution is achieved through legal channels and oversight of provision,storing and handling are systematically regulated. Evidencefrom elsewhere, however, is scarce as this is an area where littleaction has taken place at the country level and/ or these have notbeen evaluated. Middle income countries, like Costa Rica, tend todeal with the problem more aggressively (Cohen, 2002), but regulationremains inadequate given the ease and lucrative nature of drugcorruption.More information to citizens about resource flows fromcentral and local governments and clarity on the roles andresponsibilities of local authorities. Though it requires better dataon performance, tying local outputs and resource allocations fromcentral government (conditional resource transfers) offers a structureto undermine corruption and improve service delivery. Wherecitizens are informed and empowered to oversee the process, theyhave both a financial stake and the tools to enforce policies.Without the latter, citizens will be far less likely to view involvementas worthwhile.Citizen report cards offer another possible means of engagingcitizens in oversight to improve the quality and integrity of publicservices. Pioneered in public services generally, report cards havenot yet been assessed as a means of improving health services, butthrough investigative studies they equip citizens with informationon the shortcomings or failures of health services. Use of pressreports based on the studies provides both evidence (rather thananecdotes) as well as a public forum for debate, which together helplocalities identify where change is needed (Gopakumar, 1998; WorldBank 2004). Like information more generally, having authority totake action is the sine qua non of effectiveness in report card use.VoiceAlthough not strongly associated with health outcomes, voicecaptures citizens’ ability to get information, challenge government
Corruption in public health 119and ensure that services meet their needs. The record is mixed onthe effectiveness of voice in improving service delivery, but someuseful lessons emerge.Information is necessary but not sufficient for citizens’ to beempowered. Without the information citizen action can only berandom stabs at perceived problems. Information allows concertedaction. In Uganda informing citizens of fiscal transfers from thecentral government by posting budget receipts on school doors andannouncing them in the local press led to significantly higherreceipts, a more informed public and a better financed schoolsystem (Reinikka and Svensson, 2004). Similar initiatives wouldapply in health since local health districts are financed throughcentral allocations. In Colombia regular press reports on procurementregularities reduced overpayment by almost 200 per cent.Despite the scope of these findings, conclusions are tentative giventhe small number of cases, but these suggest promising directions.The evidence on the role of local voting is uneven. It appears tohave a minimal if any effect on corruption at the local level, thoughthe number of studies is small and therefore not necessarily representativeof the developing world. In Bolivia no association wasfound between perceived corruption and voter turnout, participationof citizens in cultural and religious associations (a proxy forsocial capital) or the number of NGOs, the institutions that aremeant to represent citizen voice in municipal budget councils (Gatti,Gray-Molina and Klugman, 2003).In the Philippines and Uganda surveys showed that despite highelection turnouts for both local and national elections voternumbers were unrelated to corruption levels, and electoral preferencesin both countries were shaped by other factors. A multivariateanalysis of the Philippine data showed that low levels ofcorruption (as measured by an index of household and public officialresponses) were correlated with voting in local elections andreading national newspapers. Moreover, in both countries civicactivities were common, suggesting that citizens remain active ingovernment despite a corrupt environment. That environment may
120 Fighting the Diseases of Povertyhelp to explain why voting had little effect on corruption (Azfar,Kahkonen and Meagher, 2001). Other factors clearly have a strongerinfluence on voter choices.These results lead to the tentative conclusion that voice can takemany forms and none by itself will necessarily lead to the effectivecontrol of corruption. However, the expression of voice via the pressor direct community involvement appear to be more powerful toolsthan voting in influencing public performance. Public servicedelivery does not affect voting patterns or candidate selection sufficiently.Voting may be too blunt of an indicator, one that capturesa range of interests of constituents. Health will only predominate ifit is the pressing issue of the moment. Otherwise other concernsdrive voter preferences. Some of this may be due to entrenched corruptionwhere localities regardless of their oversight simply do nothave enough clout to influence public sector behavior. Where hiringand promotion remain centralized, local voice will have less effectin any case. Popularity of candidates, other factors that appeal tovoters and insufficient evidence on things like corruption no doubtplay a role, but it is difficult to be definitive given the paltryevidence and the complexity of the issue.Community oversight can work but it doesn’t always. In Boliivacorruption is lower where local oversight groups are active “suggestingthat bottom-up accountability can be effective in keepingcorruption in check” (Gatti, Gray-Molina and Klugman, 2004). Incontrast, Uganda’s Health Management Committees expropriateddrugs and supplies providing virtually no oversight or support tolocal service delivery (McPake et al., 1999), and in Nigeria villagedevelopment committees and PHC Management Committees hadlittle impact on health care performance largely due to their lack ofauthority (World Bank, forthcoming).Efforts by a local NGO in Kenya attempted to empower communitiesto monitor teacher attendance using both reports to theschool hierarchy on performance and community awarded prizes tothe best performing teacher. Neither served to improve attendance,despite the active participation of communities. In contrast, an NGO
Corruption in public health 121experiment in India using cameras to record teacher attendance,which are tied to compensation bonuses resulted in a dramaticimprovement in delinquent behavior (Banerjee and Duflo, 2004). Itmay be that voice has less weight in influencing behavior than moreremunerative approaches combined with air tight monitoring. Ascellular phones become cheaper and more functional in rural areasphotos sent electronically offer another possible alternative meansof monitoring progress at the local level.While voice matters in many service delivery instances, its rolein health seems to be less straightforward. The specialized nature ofmedicine, the heterogeneous products of the sector and the statusof physicians in most societies complicates oversight by communities,and voting is a relatively blunt instrument for influencing thequality and responsiveness of health services.ConclusionsThe review of country evidence and the examination of the crosscountryfactors that influence performance (and to some extentoutcomes) in health care suggest that governance plays an importantrole. If the health system is not governed well, health workersare absent, patients pay illegal fees, and basic inputs are stolenwithout any consequences for those who mismanage or corrupt thesystem, performance of health services will be poor and populationhealth will suffer.Many health systems rely on anecdotal evidence to guide policy.What this paper has attempted to do is provide the evidence andoutline the major challenges facing health systems, dealing withissues typically ignored or unaddressed. Better country level datacan help in diagnosing the problem and some of the experimentshere may offer possible solutions.The second conclusion is that the returns to health investmentsmay be very low where governance is not addressed. Even with atime lag, investments such as those seen in Uganda, DominicanRepublic and Ethiopia, countries for which detailed data exist, will
122 Fighting the Diseases of Povertybe unlikely to see high returns from public health spending. Asincomes and education rise a shift to private provision may offerhigher returns – something that is already underway in the DominicanRepublic and India, and something likely to occur in lowerincome countries where governance is poor and the private sectorsteps in to replace public service. There may be individual returns tothe shift, but equity objectives are likely to suffer. Even the poorselect to pay significant amounts of disposable income to obtainprivate care, a sad commentary when public services go underutilized.Third, a countries’ health system is the institution that must beengaged and on the front line if governance is to improve governmenteffectiveness and control corruption in the sector. Withoutbolstering the key institution for the sector it is unlikely that thegoals of reducing poverty, mortality and morbidity can be achieved.The evidence here points to serious problems of governance acrossthe globe in developing and transition countries, which thwart thegoals.Finally, achieving the dramatic and permanent declines in mortalityenvisioned by the Millennium Development Goals is doubtfulunless governments shift their attention to the institutional factorsthat affect performance in the health sector. A dysfunctional environmentlimits the chances that more funding can have an impact,and much of the discussion above highlights situations that will notnecessarily benefit from large increases in funding unless more isdone to bolster the capacity of the institutions expected to implementthe agenda. Funding without the necessary institutionalstrengthening could lead to perverse results, and assistance for bothgovernance and financing will be needed in the health sector.This review demonstrates that as a first attempt to compileevidence, what is striking is the fragmented nature of the evidenceis surprisingly fragmented. It also shows the lack of meaningfulindicators for cross country comparison, and an absence of criticaldata at the country level. One issue not discussed but obviously ofimportance to policy is the variations in government capacity across
Corruption in public health 123income levels. Reforms in Chile apply to many countries, but somewill have resources too limited to take on similar reforms. Nonetheless,there are elements that can be adopted. For example, theChilean drug procurement reforms in electronic bidding and institutionalreform of drug purchasing agencies are well within thepurview and capacity of most countries, even if the shifts are moremodest in scale. Reforms in any case are entirely country specificgiven the political nature of health care. What the examples providehere are possible directions, all of which will necessarily be adaptedto country circumstances.Even without these important inputs simply having benchmarkcountries with which to compare countries would strengthen thecross country evidence. Acceptable indicators, benchmarks andadditional attention to systemic issues would enable more robustindicators of overall performance, which in turn would inform policymakersand donors of challenges and opportunities for improvinghealth institutions.What needs addressing is the con<strong>text</strong> and framework underwhich health systems function. First and foremost is better accountability.Greater professionalism among health staff, effectivetraining and supervision of staff at all levels, routine audits of allaspects of fiduciary transactions, improved records and recordkeepingto provide systematic data to managers and the bureaucracy,and procedures that can facilitate service delivery in a more userfriendly fashion all need to be addressed. Running hospitals, clinicsand other points of service in the manner of a business or of aministry of finance would be particularly helpful. The disciplineimplied and the need to be accountable provides the incentives thatimprove productivity, patient satisfaction and performance. That iswhere health systems need to move.Incentives that raise performance – ensuring appropriate,targeted training so health professionals are equipped to do their job;linking pay and performance; reviewing and auditing performance;improving recordkeeping; and upgrading logistics for drugs andsupplies – need to be an integral part of health systems. Investments
124 Fighting the Diseases of Povertyin institutions require these kinds of initiatives, and donors are in aposition to foster such improvements with both funding and adviceto oil the wheels of progress and support the emergence of stronginstitutions.Where public services are free or subsidized, with the intentionto promote access and utilization of vital health services, the abusesrelated to lack of drugs, staff absences and informal paymentsundermine these objectives as well as the credibility and effectivenessof public services more generally. Without attention to thesenon-medical issues, clinical care quality and equity in access will belost, leading to both lower health status and poorly spent publicrevenues. Addressing these public program failures are critical toeffective government to and functioning health care systems.Because good governance promotes economic growth and effectivepublic services, the health sector cannot afford to be sidelined onthis agenda.Source appendix 1: figures 4 and 5Country Data SourceyearAlbania 2002 Vitosha, 2002Albania 2002 World Bank LSMS SurveyArmenia 2001 Murrugarra & Cnobloch, 2003Bangladesh 2002 Transparency <strong>International</strong>, 2002Bolivia 2001 World Bank 2001bBosnia 2000 World Bank, 2001eBosnia 2002 Vitosha, 2002Bulgaria 2001 LSMS SurveyBulgaria 2002 Vitosha, 2002Cambodia 1999 World Bank, 2000bChina n.d. Bloom, Han and Li, 2001Colombia n.d. Corruption SurveyCroatia 2002 Vitosha, 2002Czech Republic 2002 Horthava, Maly', 2002Georgia 2000 Chawla, 2001Ghana 1998 Worldbank LSMS Survey
Corruption in public health 125Ghana 2000 World Bank, 2000dHungary 2002 Gaal, 2002India 2002 Transparency <strong>International</strong>, 2002Indonesia 2001 Partnership for Governance Reform, 2002Khazakhstan 2001 World Bank, 2001cKosovo 2000 LSMS SurveyKrygyz 2001 Falkingham, 2002Kyrgyz 2001 LSMS SurveyLatvia 1998 Anderson, 1998Macedonia 2002 Vitosha, 2002Madagascar 2001 Tranparency <strong>International</strong>, 2003Moldova 2000 Carasciuc, 2001Moldova 2002 Stempovscaia, 2002Morroco 2001 Tranparency <strong>International</strong>, 2003Nepal 2002 Transparency <strong>International</strong>, 2002Pakistan 2002 Transparency <strong>International</strong>, 2002Paraguay 1999 World Bank, 2000cPeru 2001 World Bank, 2001Poland 1998 Chawla, Berman & Kawiorska, 2001Romania 2000 World Bank, 2001dRomania 2002 FBSRussia 2002 Shishkin (2003)Senegal 2001 Tranparency <strong>International</strong>, 2003Serbia 2002 Vitosha, 2002Slovakia 2000 Anderson, 2000Sri Lanka 2001 Transparency <strong>International</strong>, 2002Tajikistan 1999 Falkingham, 2000Tajikistan 2001 Carasciuc, 2001Thailand 1999 Phongpaichit, Treerat, Chaiyapong & Baker, 2000Vietnam 1998 LSMS SurveyUzkbekistan 2001 FBS
4 Diseases of poverty andthe 10/90 GapPhilip StevensIntroduction: What is the 10/90 Gap?Activists claim that only 10 per cent of global health research isdevoted to conditions that account for 90 per cent of the globaldisease burden – the so-called ‘10/90 Gap’ (Medecins Sans Frontiers,2001). They argue that virtually all diseases prevalent in low incomecountries are ‘neglected’ and that the pharmaceutical industry hasinvested almost nothing in research and development (R&D) forthese diseases.Citing this alleged imbalance as justification, activists have forsome years been calling for a complete redesign of the current R&Dparadigm in order to ensure that more attention is paid to these‘neglected diseases’ (Love & Hubbard, 2003). This could includemeasures such as an ‘essential research obligation’ that wouldrequire companies to reinvest a percentage of pharmaceutical salesinto R&D for neglected diseases, either directly or through publicR&D programs (Medecins Sans Frontiers, 2001), or the creation of anew public entity to direct R&D. This topic is now under discussionby a World Health Organisation working group following the reportof its Commission on Intellectual Property, Innovation and PublicHealth. 1But does such an imbalance really exist and what would be theeffect of redesigning the R&D system? This chapter investigates therealities of the 10/90 gap and its relation to the diseases of poverty.
Diseases of poverty and the 10/90 gap 127Neglected diseasesMany scholars and activists have suggested that because there islittle market for treatments for tropical infectious diseases such asleishmaniasis, lymphatic filariasis, Chagas’ disease, leprosy, Guineaworm, onchocerciasis and schistosomiasis, there is a consequentlack of suitable drugs. These so-called ‘neglected’ diseases predominantlyeffect poor populations in low income countries (Murray etal., 2001), and pose particular social and economic problems forthose affected.Patrick Trouiller, for example, has pointed out that of the 1,393total new drugs approved between 1975 and 1999, only 1 per cent(13 drugs) were specifically indicated for a tropical disease (Trouilleret al., 2002). Research conducted by the DND Working Group andthe Harvard School of Public Health in 2001 revealed that of the 20global pharmaceutical companies surveyed, only two had researchprojects underway for the ‘neglected’ diseases of Chagas and leishmaniasis(Wirth, 2001)Neglected diseases are a tiny fraction of total mortalityHowever, these bare statistics serve to mislead people into thinkingthat the poor are suffering at the expense of the rich. The reality isthat ‘neglected’ diseases often do not represent the most pressingpublic health priorities in low income countries. They constitute asmall fraction of their total disease burden (Figure 1). According tothe 2002 World Health Organisation’s (WHO) World Health Report,tropical diseases accounted for only 0.5 per cent of deaths in highmortalitypoor countries, and only 0.3 per cent of deaths in lowmortalitypoor countries.Moreover, treatments already exist for many of these diseases.Schistostomiasis (bilharzia), which predominantly affects children inAfrica, can be treated with praziquantel at a cost of just 8 cents per600mg tablet (Fenwick, 2006). Onchocerciasis (river blindness) is controllablewith ivermectin. A range of treatments exist for lymphaticfilariasis (elephantiasis). In fact, the WHO acknowledges that there are
128 Fighting the Diseases of PovertyFigure 1 Number of daily deaths from diseases 7 10,814RespiratoryinfectionsHIV/AIDSDiarrhoealdiseasesTuberculosisChildhooddiseasesMalaria5,4824,5043,6113,0797,852Neglecteddiseases*3780 2,000 4,000 6,000 8,000 10,000 12,000*Neglected diseases are defined as African trypanosomiasis, Chagas disease and leishmaniasisonly three diseases that are genuinely ‘neglected’: African trypanosomiasis,leishmaniasis and Chagas disease (WHO/IFPMA, 2001).This notwithstanding, research and development into thediseases of poverty is far from moribund. Several public-privatepartnerships exist that specifically focus on diseases of poverty. Inparticular, the Medicines for Malaria Venture (MMV), the Global TBVaccine Foundation (Aeras), 2 the <strong>International</strong> Aids Vaccine Initiative(IAVI), and the Infectious Disease Research Institute (IDRI) 3 coordinatepublicly-funded R&D projects with private companies. Duein part to these arrangements, there are at least 63 drugs in the R&Dpipeline targeting HIV/AIDS, including 15 vaccines (Moran et al.,2005). There are at least 30 more drugs in the R&D pipeline formalaria, and 22 for tuberculosis. 4
Diseases of poverty and the 10/90 gap 129In addition, there are now PPPs that focus on developing drugsfor African Trypanosomiasis, Chagas Disease, Leishmaniasis, andDengue Fever, which have bolstered the number of potential treatmentsin the R&D pipeline for diseases that disproportionately affectpeople in poor countries. There are currently at least eight potentialtreatments in varying stages of clinical trials, and a further 16 inpreclinical development. 5Research at the London School of Economics shows that the PPPapproach has outperformed stand-alone industry efforts in producingdrugs that are particularly suited for conditions in less developedcountries. PPPs have often proved to be a quicker way to getdrugs to market, generally equalling or exceeding industry standards.Finally, it appears that PPPs are more cost-effective than otherapproaches. For example, the Medicine for Malaria Venture’s syntheticperoxide project has moved to Phase I clinical trials for a totalcost of US $11.5 million – lower than the industry norm for developinga New Chemical Entity for western markets (Moran et al.,2005).Most disease in lower-income countries is caused bypovertyDespite this increased activity, it is worth pointing out that a largeproportion of illnesses in low-income countries are entirely avoidableor treatable with existing medicines or interventions. Most ofthe disease burden in low-income countries finds its roots in theconsequences of poverty, such as poor nutrition, indoor air pollutionand lack of access to proper sanitation and health education.The WHO estimates that diseases associated with poverty accountfor 45 per cent of the disease burden in the poorest countries (WHO,2002). They include:◆Tuberculosis, malaria and HIV/AIDS, which account for nearly18 per cent of the disease burden in the poorest countries(WHO, 2004).
130 Fighting the Diseases of Poverty◆◆◆◆◆Respiratory infections caused by burning biomass fuels andlow-grade coal in poorly ventilated areas also constitute asignificant health burden for poor people. According to theWHO, exposure to biomass smoke increases the risk of acutelower respiratory infections (ALRI) in childhood, particularlypneumonia. Globally, ALRI represent the single most importantcause of death in children under 5 years and account for atleast two million deaths annually in this age group (Bruce etal., 2002).Diarrhoeal diseases, caused by the poor sanitation which isendemic in economically deprived areas, may be easily andcheaply treated through oral re-hydration therapy. However,diarrhoeal diseases still claim 1.8 million lives each year, (WHO,1999) and are the second biggest killer of children worldwide,after respiratory infections.Malaria can be prevented through a combination of indoorresidual spraying of dwellings with insecticides, the use ofinsecticide treated bed nets and the use of prophylacticmedicines. Malaria infections can be cured with drugs such asquinine, mefloquine or artemisinin combination therapy(Muheki, et al., 2004; PAHO, 2006).Yellow fever – a vector-borne, viral disease with high mortalityrates – can be prevented by using prophylactic vaccination. Anaffordable and effective vaccine is available, but nearly allcountries in which the disease is enzootic prefer to wait untilan epidemic is evident before mass-treatment of the affectedpopulation is undertaken (Monath & Nasidi, 1993; Monath2005). Education can also play an important role in reducingthe incidence of insect-borne diseases, for example byencouraging people to remove sources of stagnant water(insect breeding sites) from near their dwellings.Tuberculosis can be prevented by improving nutrition, and canbe treated with DOTS therapy. This method can detect and curedisease in up to 95 per cent of infectious patients, even in thepoorest countries (WHO, 1999).
Diseases of poverty and the 10/90 gap 131◆◆◆◆◆Education is vital for the prevention of HIV/AIDS – and thisentails the full engagement of civil society. A combination ofanti-retrovirals (ARVs) and good nutrition can help to controlthe viral load and suppress the symptoms of HIV/AIDS.Treatable childhood diseases such as polio, measles andpertussis, account for only 0.2 per cent of Disability AdjustedLife Years (DALYs) in high-income countries, while they accountfor 5.2 per cent of DALYs in high mortality lower incomecountries (WHO, 2002). Vaccines for these diseases have existedfor at least 50 years, yet only 53 per cent of children in sub-Saharan Africa were immunised with the diphtheria-tetanuspertussis (DTP) jab in 2000 (WHO, 2002a).Malnutrition particularly affects people in poor countries. Inparticular, micronutrient deficiencies contribute to illness andpoor health. For example, as a result of Vitamin A deficiency,500,000 children become blind each year (WHO, 1995) andmany of them die, despite the fact that such outcomes can beavoided by inexpensive, easy-to-administer food supplements(WHO, 1997). Vitamin A deficiency also weakens the immunesystem, leaving children vulnerable to other illnesses such asdiarrhoea and measles. Estimates suggest that Vitamin Adeficiency contributes to or causes approximately 800,000childhood deaths each year (Rice et al., 2004).Dengue is a mosquito-borne viral infection prevalent in over100 countries. According to the WHO, two-fifths of the world’spopulation is at risk from dengue, and there are around 50million infections every year. 6 Dengue can be prevented with arange of techniques to control insects. These include coveringwater containers and applying insecticides to larval habitats.During the 1950s the principal vector, Aedes aegypti, waseradicated from 22 countries in the Americas by the applicationof DDT.Pertussis (whooping cough) is a particular threat to infants.Somewhere in the range of 20 to 40 million cases occur everyyear, mostly in less developed countries, and as a result,
132 Fighting the Diseases of PovertyTable 1 Deaths caused by ‘developed country’ diseases 21% of deaths caused by/in High mortality Low mortality Developeddeveloping developing countriescountries countriesMalignant neoplasms (cancers) 6.3 9.9 21.2Diabetes 0.6 1.5 1.7Neuropsychiatric disorders 1.3 1.4 2.9Cardiovascular diseases 18.9 23.4 47.8Respiratory diseases (asthma) 4.0 6.7 5.0Digestive diseases 2.7 3.4 3.7Total ‘developed-countries’diseases 33.8 46.4 82.3◆between 200,000 and 400,000 die every year. 7 An effectivevaccine against pertussis has existed for some years, butcurrently 20 per cent of children worldwide do not receive it.Leprosy was for many centuries an incurable and widespreaddisease. However, the development and adoption, in the early1980s, of multidrug therapy (dapsone, rifampicin andclofazimine) has led to a 90 per cent decline in its prevalence. 8Poverty-related diseases cause far higher levels of mortality inlow-income than high-income countries (Table 1). Most of thesediseases and deaths can be prevented with pre-existing treatmentsand prevention programmes. Diseases for which there is no treatmentcurrently available, such as dengue fever, contribute towardsa far smaller proportion of low-income country mortality rates thandiseases which are easily preventable or treatable. It is estimatedthat 88 per cent of child diarrhoeas, 91 per cent of malaria and upto 100 per cent of childhood illness such as measles and tetanus canbe prevented among children using existing treatments (Jones et al.,2004). This means that up to 3 million child lives could be savedeach year if these medicines could be distributed effectively to allareas of need.
Diseases of poverty and the 10/90 gap 133Figure 2 Projected global deaths by cause2005 (all ages), millions20151050MalariaCancerHIV/AIDSTuberculosisDiabetesCardiovasculardiseasesChronic respiratorydiseasesSource: WHO (2005a).Illnesses of low and high-income countries areconvergingExponents of the 10/90 Gap are also inaccurate when they claim thatlow-income countries, which constitute the majority of the world’spopulation and disease burden, suffer from completely differentdiseases than high-income countries. The premise that only 10 percent of the global health research budget, both private and public,is used for research into 90 per cent of the world’s health problemsis factually incorrect.In reality, the nature and spread of diseases suffered in both richand poor countries is converging rapidly. According to the WHO,ailments such as cardiovascular disease, cancer and diabetes nowaccount for 45 per cent of the global disease burden. Around 80 percent of this burden now occurs in low and middle-income countries(WHO, 2005a). Chronic diseases cause four out of five deaths inlower-income countries. In absolute terms, more people in thelower-income countries (compared to higher-income countries) die
134 Fighting the Diseases of PovertyFigure 3 Projected death rates by specific causes for selectedcountries2005 (all ages), thousands700 HIV/AIDS, tuberculosis and malaria6005004003002001000Cadiovascular diseasesNigeriaIndiaChinaCanadaBrazilPakistanRussianUnited Republicof TanzaniaUnited KingdomFederationSource: WHO (2005a).as a result of non-communicable diseases. Cardiovascular diseasesare one of the most significant causes of death in lower-incomecountries (Figures 2 and 3).The WHO argues that much of this disease burden is attributableto less healthy diets and increasing physical inactivity. This may beso, yet the global rise of chronic diseases is also partly the result ofmore people living beyond middle age, thanks to greater globaleconomic growth and prosperity. The prevalence of chronic disease,however, does challenge the myth that the current commercial R&Dparadigm is failing to produce drugs that meet the needs of theglobal disease burden. Significant resources currently are beingdeployed towards developing treatments for cancers, cardiovasculardiseases, neuropsychiatric diseases and diabetes. In fact, levels ofdrug development increasingly reflect the global disease burden, solower-income countries therefore stand to benefit from drugs thatare currently in the R&D pipeline (Figure 4).
Diseases of poverty and the 10/90 gap 135Figure 4 The global disease burden vs. number of compounds in developmentSense organdisorderDigestivediseasesRespiratorydiseasesBurden of disease in DALYs, millionsNumber of coumpounds in developmentby major disease catagoriesDiabetesMusculoskeletaldiseasesHIV/AIDSNeuropsychiatricdiseasesCardiovasculardiseasesInfectious diseases &respiratory infectionsCancers400 350 300 250 200 150 100 50 0 50 100 150 200 250 300 350 400Sources: PhRMA (2005) and WHO (2004)
136 Fighting the Diseases of PovertyLower-income countries also currently benefit from drugs thatwere originally developed for wealthier markets. Polio, pertussis(whooping cough) and diphtheria, for example, were once endemicin wealthier countries, but have been practically eradicated fromthese areas due to simple vaccines that were developed a fewdecades ago.Now, three-quarters of the world’s children – including millionsin low-income countries – are vaccinated against such diseases,saving at least three million lives a year and preventing long termillness and disability in millions more. Tuberculosis treatments wereoriginally devised to combat the disease in wealthier countries, andmany populations in lower-income countries now reap the dividendsof this advance in medical science in the form of mass vaccinationprogrammes. HIV/AIDS treatments in the form of ARVs wereoriginally developed with wealthy consumers in mind. Those treatmentshave now spread to poorer countries which are most affectedby the disease, but are unable themselves to bear the cost of R&D forsuch treatments.Statins are also an increasingly important tool in the fightagainst cardiovascular diseases in lower-income countries, withmany of these powerful drugs now off-patent and open to genericcompetition. Again, these treatments originated – and are still beingdeveloped – in wealthier countries under the current commercialR&D paradigm.Access is the real problem – not innovationIf treatments exist for the majority of poor countries’ healthproblems, why then do mortality rates remain so high? Any discussionof this question must address the problem of access to essentialmedicines, which remains an intractable political and economicproblem. According to the WHO, an estimated 30 per cent of theworld population lacks regular access to existing drugs, with thisfigure rising to over 50 per cent in the poorest parts of Africa andAsia (Figure 5).
Diseases of poverty and the 10/90 gap 137Figure 5Percentage of WHO regions lacking access toessential medicines 29All countries30ChinaWest Pacific1514India65South-East Asian26European14East Mediterranean29American22African470 10 20 30 40 50 60 70Within these populations, it is the poorest socio-economicgroups that disproportionately suffer from a lack of access toexisting medicines. 9 The implications of this failure of public healthpolicy on global mortality are profound – according to one study,over 10 million children die unnecessarily each year, almost all inlow-income or poor areas of middle income countries, mostly froma short list of preventable diseases such as diarrhoea, measles,malaria and causes related to malnutrition (Black, 2003).Only one-half (approximately) of sub-Saharan African childrenare vaccinated against childhood diseases, and in isolated areas thatnumber is as low as one child in 20 (WHO, 2002a). A variety offactors conspire to create this desperate situation, many of themcaused by government mismanagement and interference. These
138 Fighting the Diseases of Poverty“An estimated one-third of the world population lacksregular access to essential drugs, with this figure rising toover 50 per cent in the poorest parts of Africa and Asia. Andeven if drugs are available, weak drug regulation may meanthat they are substandard or counterfeit.”WHO Medicines Strategy Report 2002–2003include weak healthcare systems, taxes and tariffs on medicines andinadequate risk pooling mechanisms. These and other barriers toaccess are discussed in detail in chapter 8.The 10/90 Gap is a red herringThe evidence presented here suggests that activists who cite the10/90 gap as justification for the wholesale reform of the R&Dparadigm are setting their sights on the wrong target. It is fallaciousand misleading to argue that commercial R&D neglects almostentirely the diseases of the poorer parts of the world. Private companiesare responsible for developing and producing majority of thedrugs that already exist on the WHO’s essential medicines list, andhundreds of private research initiatives are currently underway toaddress the world’s biggest killers that impact both rich and poorcountries. The so-called ‘neglected diseases’ rarely constitute acountry’s most pressing health priorities. The WHO itself has arguedthat the key factors behind the excessive mortality caused by thesediseases include unavailability of health services and failure to useprevention and treatment strategies, rather than the unavailabilityof medicines (WHO, 1999).The health problems faced by the world’s poorest populationsare not caused by the non-existence of drugs specifically related totheir problems and diseases. The real problem is ensuring that thesepopulations can actually access vital medicines. Many governmentsfail their populations in this respect by imposing punitive tariffs and
Diseases of poverty and the 10/90 gap 139taxes on medicines, and by failing to foster healthcare systems orfunctional risk pooling mechanisms. The governments of poor countriesalso hinder the creation of wealth, imposing obstacles in theway of owning and transferring property, imposing unnecessaryregulatory barriers on entrepreneurs and businesses, and restrictingtrade through extortionate tariffs. It is these and other politicalfailures that have left poor populations without the necessaryresources to access the medicines that could so easily transformtheir quality of life.Campaigners who cite the 10/90 Gap as the prime mover behindthe health problems of the poor are in fact betraying the very peoplethey are attempting to help. In seeking to radically alter the currentR&D paradigm, they risk undermining the incentive system that hasled to the development of treatments for a great majority of thehealth problems suffered by both high and low income countries.Emerging health threats, ranging from drug-resistant strains ofAIDS and tuberculosis to avian flu, remind us of the importance ofensuring that the pharmaceutical industry continues to discoverand develop new drugs. Innovation is a fragile process, and it canbe weakened or thwarted by poor public policies. Heavy taxation,regulation or public vilification of pharmaceutical companies willreduce their incentives to invest in researching these vital drugs,because shareholders will be uncertain of generating a return. Ifcommercial companies are no longer able to prioritise and managetheir own R&D spending unmolested by government, the consequencesfor global health will be tragic.Furthermore, the public sector offers no panacea for activistswho seek to wrest the ability to conduct R&D away from commercialenterprises and towards the public sector. The public sector’strophy cupboard of health R&D successes is almost empty, becausegovernments lack both the technical skills and the ability to pickwinners that have rendered many pharmaceutical companies socommercially successful.In the 1980s, the US Agency for <strong>International</strong> Developmentfunded research into a vaccine for malaria, which absorbed $60
140 Fighting the Diseases of Povertymillion and failed to achieve any of its goals. This failure is a neatillustration of the drawbacks to the public procurement of R&D.Because the researchers were operating to the demands of a publicsector employer rather than the market, they gave out wildly optimisticstatements about the progress of their work in order toensure a continued supply of funds. Government-funded projectdirectors also have an incentive to fund unpromising work – illustratedby the project leader’s demand for further funds, despite theunpromising nature of his early work. Finally, because the recipientsof government subsidies are paid before delivery, they remove incentivesto properly conclude the research.By seeking to derail the R&D capabilities of the pharmaceuticalindustry, exponents of the ‘10/90 gap’ are in danger of creating aself-fulfilling prophesy. A global R&D treaty, in which the profits ofpharmaceutical companies are heavily taxed and their intellectualproperty rights undermined, would be almost certain to have theunintended consequence of effectively turning off the tap of innovationthat is essential to dealing with the world’s changing healthproblems.
5 Increasing access tomedicinesProf Khalil Ahmed, 1 Franklin Cudjoe, 2 Eustace Davie, 3Dr John Kilama, 4 Prof Martín Krause, 5 Andrés Mejia, 6Barun Mitra, 7 Nonoy Oplas, 8 Martín Simonetta, 9Philip Stevens, 10 Jose Luis Tapia, 11 Margaret Tse, 12Jasson Urbach 13Ashasbeendemonstratedinthepreviouschapter,accesstomedicinesin many less developed countries is extremely low. According to theWHO, an estimated 30 per cent of the world population lacks regularaccess to existing drugs, with this figure rising to over 50 per cent inthe poorest parts of Africa and Asia (WHO, 2003). As chapter 4 has alsoshown, there is some concern that certain diseases unique to lessdevelopedcountriesdonotrepresentaviablecommercialprospectforwould-be innovators of new medicines, resulting in a shortage ofappropriate treatments. Citing this alleged ‘market-failure’ as justification,some have proposed alternative mechanisms to the commercialR&D paradigm in order to stimulate research into these areas.This chapter examines some of the factors that prevent existingmedicines from being distributed in the most effective manner, aswell as those elements of governance which actively undermine thesupply of new medicines.We begin with a description of the major barriers to access,which include weak healthcare systems, taxes on imported medicines,and poorly functioning insurance markets. We then examineseveral related issues, including the impact of poor governmentpolicy on the supply of medicine and the impact of pre-marketregulations and price controls.
142 Fighting the Diseases of PovertyWeak healthcare systemsHealthcare systems and associated infrastructure are vital for theeffective distribution of medicines. If healthcare systems are starvedof resources, it is unlikely that they will be able either to procurenecessary drugs or be able to employ sufficient numbers of doctorsand other trained personnel necessary to prescribe and administermedicines.The majority of low-income countries lack the basic infrastructurerequired to distribute medicine successfully. Road networks areoften unreliable or non-existent, making it difficult to ensure aconstant supply of medicines to remote areas (Saleh & Ibrahim,2005). Electricity is often unavailable, especially in rural areas;where it is available, it is often supplied in an erratic fashion. Thisincreases the cost and difficulty of running refrigeration systems inclinics and hospitals. As a result, vaccines are often not maintainedat sufficiently low temperatures to ensure product stability. Proteaseinhibitors (used in second-line ARV treatments) are one example ofa drug that needs to be refrigerated (Kumarasamy, 2004), yet due toerratic power supplies and other issues, it is impossible to ensureconstant refrigeration in the world’s poorest countries.In this situation, it is extremely difficult to ensure the distributionof the safe and effective medicines that have already beendeveloped to tackle the diseases of poverty. For example, a relativelyeffective treatment for tuberculosis is Directly Observed TherapyShort Course (DOTS), which requires between 6 to 8 months withclose patient monitoring to ensure compliance. ARV treatment forAIDS sufferers also requires close supervision over the lifetime of thepatient. Even in the relatively efficient health care systems of highincomecountries, maintaining adherence to HAART (Highly ActiveAnti-Retroviral Therapy) treatment during clinical trials is fraughtwith complexity (Kumarasamy, 2004). Achieving such adherence inpoor countries with weak health care systems is practically impossible.Intervention by global public health authorities and the provisionof public funds is not a guarantee that existing medicines will
Increasing access to medicines 143be effectively distributed. Consider the example of malaria, discussedin the next chapter: despite the establishment of the RollBack Malaria initiative and the injection of specific funds, the mostmodern and potent anti-malarial drugs were still not being correctlyused six years after the initiative began (Attaran, 2004).Weak healthcare systems do not simply result in a failure to distributeexisting treatments. They also have a knock-on effect for thedemand for new drugs, and can act as a serious disincentive towould-be innovators of new medicines. If a product is unlikely toreach its intended market, what is the point of developing it in thefirst place? Well-equipped and properly staffed modern medicalfacilities are adept at disseminating the latest medical tools anddrugs (Dussault & Dubois, 2003). Conversely, inefficient distributionand communications channels have an adverse effect on the speedwith which new medicines reach patients, if they reach them at all(Gambardella et al., 2000).Frequently, public spending and foreign aid injections intonational health systems do not translate into the delivery of servicesand medicines to the poor. A multi-country study by Filmer andPritchett (1999) showed that public spending on health in lowerincomecountries has only a minute impact on mortality. Theauthors showed that a significant proportion of deaths of childrenbelow five years could be averted for as little as US $10 each, yeteven in the poorest countries, the average amount spent by governmentsper child death averted is a staggering US$50,000–$100,000.There are many reasons for this low level of performance. First,public health agencies tend to be woefully inefficient and corrupt,especially in lower-income countries. As a result, the proportion ofa donor’s contribution that actually results in delivery of healthcareservices (whether they are vaccines or nurses’ salaries) is often verylow. Health officials may sell aid-financed drugs on the black market.Studies in Guinea, Cameroon, Uganda, and Tanzania estimated that30 to 70 per cent of government drugs disappeared before reachingthe intended patients (Filmer, Hammer & Pritchett, 2000).
144 Fighting the Diseases of PovertySecond, social programs nominally targeted at low-incomegroups are frequently captured by the articulate and influential rich(Deolalikar, 1995; Castro-Leal et al., 1999; Barat et al., 2003).Third, public funding and provision can crowd out privatefunding and provision of healthcare. If a government starts toprovide a good or service for ‘free’, this is a clear signal to privateproviders to exit the market. The net amount of healthcare providedmay remain constant – but where there was once diversity of provision,there is now an effective monopoly, which has its own efficiencyproblems. As a result, public funding and provision typicallyhas little to no impact on actual health outcomes (Filmer, Hammer& Pritchett, 2000).Case study: How the South African health systemhinders access to medicinesJasson Urbach, Free Market Foundation, South AfricaThe experience of the South African public health system offerssome insights as to why 20 per cent of the country’s populationis unable to access essential medicines (UN, 1999).At the outset it should be made clear that there are twodistinct and separate health sectors in South Africa. Thedichotomy is largely a hangover from past policies formulatedunder the apartheid regime. On the one hand the private healthsector provides a world-class health service, with excellentfacilities, advanced technology, well-remunerated staff andgood access to all medicines. On the other hand the publicsector is plagued with inefficiency and for the most part SouthAfrica’s public health care system struggles to meet the needsof the patients it is supposed to be serving. The result is thatpatients seldom receive the level of care that they deserve.The South African government receives medicines atsubstantially reduced costs from large multinationalpharmaceutical companies. However, historic and ongoing lackof infrastructure, personnel and poor logistics means thatfrequently the medicines do not reach those for whom they
Increasing access to medicines 145were intended. Furthermore, those that do have access topublic sector health facilities usually end up queuing for hours,and are often turned away, trying to get even the most basicmedicines. Not surprisingly, in 2000 the World HealthOrganisation (WHO) ranked South Africa’s health-care system175th out of the 191 member countries.There is also a great deal of theft in public hospitals. Forinstance, in Mpumalanga province, 46 medical professionalsended up behind bars in the first two months of 2003,charged with the theft and resale of government medicinesmeant for the rural poor in Mpumalanga. Those arrestedincluded a manager of a rural hospital, doctors, pharmacistsand medical technicians as well as a syndicate of ‘bag men’who delivered stolen drugs, including birth control pills, painkillers and antibiotics, to private doctors.The medicine shortages caused by the syndicate’s medicinethefts reportedly prevented routine operations from beingperformed, and complicated the day-to-day treatment ofpatients at the Rob Ferreira and Themba hospitals in Nelspruit,the capital of Mpumalanga. 14 The extent and nature of theftand corruption in the public health system reinforces the severeshortcomings in hospital management, administration andcontrol systems.The South African drug regulator, the Medicines ControlCouncil (MCC), is notoriously inefficient and tardy with itsapproval process. On average, drugs that have already beenregistered for use in the US, EU and Japan can wait for 39months to be approved by the South African system. A furtherbarrier to access in South Africa is Value Added Tax(VAT). The SA government continues to charge VAT onpharmaceuticals despite the fact that the tax is highly regressivesince it disproportionately affects the poorest members ofsociety.If the South African government is serious about increasingaccess to medicines to the poorest of the poor, then they will
146 Fighting the Diseases of Povertywaive VAT on all medicines. VAT is counter-intuitive in the sensethat if one of government’s primary objectives is to have ahealthy and productive workforce, surely it does not want to taxthe sick and vulnerable. The VAT received by government onpharmaceuticals is relatively insignificant. However sick peoplecould use the money that would have been spent on VAT for anumber of beneficial alternatives, including food.According to the latest estimates by the official governmentstatistical agency, Statistics South Africa (SSA), approximately 26per cent of the South African labour force is unemployed. Ifdiscouraged work seekers are also included, this figure jumps toapproximately 41 per cent. The consequence of massunemployment is that there are large numbers of individualsthat currently live in extreme poverty. Indeed, it is estimatedthat there approximately 5 million people in South Africa live onless than a dollar a day. Therefore, it is not unreasonable toassume that many of them simply cannot afford to buy evenbasic pharmaceutical drugs. While the government claims totake responsibility for the health care of the indigent, it isobviously not capable of meeting unlimited demands.How do we remedy this situation? In the long run, the onlyway to increase access to medicines is through increasing thewealth of the citizens of a country and this is only possiblethrough economic growth. In the short term, the governmentcan substantially improve its distribution of drugs by privatisingthe distribution process and reducewaiting times by simply approving drugs that have already beenapproved for use in developed countries. Finally, the SouthAfrican government’s preferred policy of price controls will notincrease access. On the contrary, it will simply reduce supply byeroding the incentives of potential suppliers.Jasson Urbach is a research economist with the Free MarketFoundation (Southern Africa) and assistant director of the healthadvocacy group Africa Fighting Malaria.
Increasing access to medicines 147Taxes and tariffsMany governments of lower-income countries compound theproblem of weak healthcare systems by imposing a range of taxeson medicines, including port charges, central, regional and localtaxation, as well as import tariffs and VAT. Other governmentimposedmeasures or regulations may include pre-shipment andinspection costs, and pharmacy board fees. Taken together, theseadd significantly to a drug’s retail price, with negative consequencesfor access to medicines, especially for the poorest.In a survey of nine countries, Levison and Laing found that thatcosts resulting from government policy or regulation added anaverage of 68.6 per cent to the cost of imported pharmaceuticals(Levison & Laing, 2003).Why Do Governments Tax Medicines?Given the massive negative impact of local price inflators onthe cost of medicines for the poor, it must be asked whygovernments choose to implement such policies. There aretwo main reasons: to protect local industry and to raiserevenue.Protection of local industry. In some cases, policies aredesigned to protect domestic industry, without little if anyregard for how this may affect citizens. Both Levison (2003)and the European Commission (2003) observe that Nigeria,Pakistan, India and China all have significant local industriesand are included in the group of countries with the highestimport duties. Opponents of tariff removal support thispolicy, suggesting that reducing or abolishing tariffs couldundermine the domestic industry which relies on highimport barriers to survive. This argument is somewhattenuous, as very few low-income countries – other thanthose listed above – have indigenous pharmaceuticalindustries of any significance. At any rate, industry
148 Fighting the Diseases of Povertyprotection via tariffs often leads to entrenched inefficienciesand results in expensive, poor quality products.Income Generation. Taxes and tariffs generate revenue forthe government. In some very poor countries, import tariffsin general represent an important source of income forgovernments where collection of other sorts of taxes isdifficult. However, tariffs on medicines are rarely asignificant source of revenue.Taxes and tariffs under the microscopeTariffs are often a particularly important factor in determining theend-user price of pharmaceuticals in low-income countries (Bate etal., 2005). A 57-country study conducted on behalf of the EuropeanCommission in 2003 examined taxes and tariffs on pharmaceuticalproducts used in the treatment of communicable diseases. 15 Thestudy found that the countries that apply the highest tariff ratesinclude Nigeria, Pakistan, India and China (European Commission,2003). As a result, large sections of the populations of these countriesare being priced out of treatment by their own governments. 16Another disturbing government levy on pharmaceuticals is valueadded tax (VAT). VAT is a revenue-raising instrument that can existat several levels of the political system, and may be applied to differentclasses of products, or certain sectors (Levison & Laing, 2003).The European Commission (2003) found that VAT was imposed onpharmaceuticals at average rates of over 12 per cent.Table 2 shows the combined impact of taxes and tariffs (customsduty + VAT + other duties) on the retail price of medicines inselected poor countries. The global average is 18 per cent, withMalaysia having the lowest rate (0.01 per cent) and India the highest(55 per cent). 20By driving up the cost of medicines, these taxes and tariffs pricethe poorest people out of the market for life-saving treatments.
Increasing access to medicines 149Table 2 Duties and taxes on retail medicinesCountry Combined total duties and taxesIndia 55%Sierra Leone 40%Nigeria 34%Pakistan 33%Bolivia 32%Bangladesh 29%China 28%Jamaica 27%Morocco 25%Georgia 25%Mexico 24%Table adapted from European Commission, 2003.They are regressive because they adversely affect the poor and thesick. Such government policies effectively impose a wedge betweenthe demand for drugs and their supply. In markets where profitmargins are already low, drug companies have fewer incentives tosupply their existing products, much less to innovate new productsspecifically aimed at these markets. As Levison (2003) observes:“Economically…tariffs impede the action of a competitive marketwhere the best drug will achieve the best price and [they] protectinefficient [local] producers who charge high drug prices.”(Appendix Figure 2 shows how taxes restrict the demand for medicines.)Non-tariff barriersBeyond visible barriers such as tariffs, manufacturers wishing toexport to overseas markets often face significant hurdles and complexityin registering their products. These tend to emanate from localdrug approval agencies, and often appear to be designed to protectlocal industry rather than achieving better outcomes for patients.
150 Fighting the Diseases of PovertySome examples of such non-tariff barriers are the following:◆◆◆◆◆Harmonisation. Certain countries are guilty of requiringimporters to attain standards higher than those required byrelevant trade bodies, often without any scientific justification.Transparency: Many countries fail to provide adequateinformation regarding the regulations and procedural normsconcerning methods of sampling, inspection and testing ofdrugs. New regulations are often introduced without givingthe producers in exporting countries an opportunity tounderstand and/or comply those regulations. Often thestandards are available only in the language of the importingcountry or are presented in a very complicated manner. As aresult, exporters lack clear guidance about the specificrequirements, which can lead to rejection at the point ofimport.Conformity assessment issues: Importing countries may requiretesting to occur at a single location which may be at aninconvenient location, adding an additional burden of cost andtime. Certificates may have limited validity, requiring frequentre-testing, while on occasion importing countries may notrecognise the certificates of international bodies.Marketing restrictions: Often, importing countries require theirown standard of labeling on products, which can becumbersome to exporters from lower-income countries whoare trying to export to a range of different countries, all withdifferent criteria.Restrictions on port of entry: Several countries allow importsonly through designated ports, which increases transit timesand transaction costs.One example is South Africa’s Medicines Control Council (MCC),which requires that all new medicines must attain its own regulatoryapproval before they can be marketed in the country – even ifthey have already been approved by reputable foreign regulatory
Increasing access to medicines 151bodies such as the US FDA. However, the extreme inefficiency of theMCC means that drugs which have already been registered for usein the US, EU and Japan wait an average 39 months for approval inthe South African system.Another example comes from Namibia, which announced in2002 that all medicines registered in the country prior to independence(1990) should be re-registered (Bate et al., 2005).The low purchasing power of the majority of citizens in poorcountries means they do not constitute significant markets forforeign manufacturers. In the face of such non-tariff barriers, companieswill often forego the regulatory complexity and expense ofregistering their products in that country (and will instead investtheir resources elsewhere). The result is that fewer medicines areapproved – even when they are desperately needed – and there is alower level of local competition in the marketplace which wouldotherwise drive prices down and increase access.To make matters worse, many governments now adopt theWHO’s list of ‘essential medicines’ as the basic formulary, denyingtheir citizens access to medicines not on the list (see Box).WHO Essential medicines listDr John Kilama, Director, Global Bioscience DevelopmentInstituteIf poor people in the U.S. and the EU had access only tothe limited range of options on the World HealthOrganization’s Model List of Essential Medicines (EML),most doctors would denounce that situation asunacceptable. So, too, would most healthcare workers inother developed countries around the world. Why then hasno one questioned the rationale behind the WHO’s List ofEssential Medicines – frequently the authority that dictatesthe drug selection process for many health Ministries inpoorer countries?The WHO EML represents the most comprehensive
152 Fighting the Diseases of Povertyinternational compilation of essential medicines for publichealth. The list was compiled beginning in 1975, in thewake of World Health Assembly’s decision to focus on highquality, reasonably priced essential medicines. Since it wasfirst published in 1977, the WHO EML has ostensibly aimedto provide for the majority of people worldwide affordable,safe and effective medicines for most of their health needs.The first model list identified 208 individual drugs andsince then multiple deletions and insertions have beenmade. Drugs can be removed from the list if their safety isfound to be questionable following the appearance of newdata.Despite this, the concept of the EML is ill-fitted to themyriad health needs of people in lower-income countries.Diseases such as diabetes, hypertension, cancer,cardiovascular disorders, gastrointestinal disorders,dermatological disorders and arthritis are just as common inAfrica as in developed countries. Yet the WHO Essential Listof Medicines does not provide medical practitioners in Africawith sufficient choice for dealing with these diseases.Medical practitioners are well aware that each individualresponds to medicine in a unique way. An anti-anginalmedicine such as Verapamil produces a range of differentresults in any given population. It may not work in oneindividual who suffers from anginal disorder yet it mayproduce good results in another individual who has verysimilar symptoms. So why recommend only a few productsas ‘essential’ if we know that different people responddifferently to the very same drug product?Unfortunately, in Africa, if your disease cannot be treatedwith any of the drugs on the WHO List of EssentialMedicines, you are simply out of luck. You need to gooutside the essential list to get relief, but that may not bepossible. Most African health ministries have adopted the
Increasing access to medicines 153WHO guideline as their approach to healthcare, making itall but impossible to obtain the most appropriate drugs.This approach is irrational, and is not good for publichealth.The African healthcare crisis extends beyond the highlypublicised problems of HIV/AIDS and malaria. Although theinternational community has paid little attention,hypertension and diabetes are also widespread in Africa,and the combined number of deaths from those twodiseases nearly equals the toll from HIV/AIDS.When it comes to treating those diseases, however,Africans have limited options. Even those who can afforddrugs that are not on the EML do not have the opportunityto do so. That is because most African governments allowthe importation of only those drugs that are on the list.When it comes to drugs for hypertension, for example, thereare only six drugs on the WHO list. If one of those six listeddrugs cannot control an African’s hypertension, he or shewill die because no other hypertension drugs are registeredfor sale in that country.The disease burden in lower-income countries is comingincreasingly to resemble that of higher income countries,especially in terms of cardiovascular diseases and cancers.Plenty of new drugs are coming on stream to combat thesediseases, but the rationale behind the EML denies patients inpoorer countries access to these new drugs. This is becausethe EML deliberately favours listing generic medicines overpatented ones. In this way, the treatments available topatients in poorer countries do not match the contours ofthe disease burden. This also discourages innovation, as theEML sends confusing and inaccurate signals with regard towhich diseases are most prevalent at the local level.Tensions are mounting. In Kenya, a dispute has brokenout between those who import essential medicines and
154 Fighting the Diseases of Povertythose who want to import brand name drugs, of whichgeneric copies are sold in Kenya. Importers of ‘essential’medicines on the WHO list do not want brand name drugsto be imported because importers are afraid of competition.They know there is a vibrant market for these drugs, whichposes a threat to their commercial interests.A more fundamental question must also be considered:Why even define some drugs as essential and not others? Alldrug products are essential to those people who need them.Each disease requires personalized treatment. Our goalshould be to provide doctors with enough options to useexactly the right drug to fit the needs of each patient.Instead, the drug list seems to be designed to suit the needsof various vested-interests and pressure groups. As a result,the EML does not correspond with the actual demand fordrugs on the ground.Inadequate health insuranceHealth insurance enables individuals to pool their financialresources and thereby protect themselves against the risk of unexpectedand expensive illness. In return for monetary payment, aninsurer agrees to compensate the individual in a specified wayshould defined, uncertain events actually happen.When health insurance systems function well, demand forhealthcare increases because larger numbers of people are coveredagainst the costs of ill health. Several studies have shown the linkbetween greater uptake of therapeutic medicines among poor andvulnerable populations, and the availability of health insurance inthe United States (Department of Health and Human Services, 2002;Poisal & Chulis, 2000). However, many low-income countries do nothave properly functioning health insurance schemes. In 1998 notone low-income country with a gross national product (GNP) percapita below US $761 had a social health insurance scheme (Carrin,
Increasing access to medicines 1552002). Those individuals not covered by insurance pay for healthcareout of their own resources (or are nominally provided suchservices by the state). Since these people are already poor, theirability to purchase medicines – especially expensive medicines – islikely to be very low indeed. So the lack of availability of insuranceacts as a significant barrier to access to medicines and constraint ondemand.One reason for the low level of insurance coverage in poor countriesis the lack of adequate court systems and generally an absenceof the rule of law, which makes the enforcement of legal agreementsdifficult, long-winded and expensive. Health insurance takes theform of a contract in which payment is made in advance of pay-outby the insuring company. In an environment where contracts aredifficult to enforce, it is not surprising that many people are unwillingto risk paying into an insurance scheme. This specifically relatesto a failure on the part of government to create an adequate rule oflaw and supporting institutions.Another reason for low levels of insurance coverage in poorcountries relates to the level of regulation placed upon privatehealth insurers. For example, insurance companies may be requiredto offer certain kinds of insurance, regardless of whether or not consumerswant the coverage. This is the case in South Africa, wherethe government has banned insurers from excluding high risk applicants,and compelled them to include cover that is not necessarilyappropriate. The South African government is also working towardsestablishing a system that will require well-run funds to transfertheir surpluses to badly-run funds. This latter intervention will limitthe ability of actuaries to balance contributions against risk. Suchregulations increase the costs associated with offering insurance,which increases the price at which it is offered. As a result, relativelyfewer people are able to afford insurance. Paradoxically, regulationsintended to protect consumers ultimately harm them (Soderlund &Hansl, 2000).Governments also stifle the development of properly functioninginsurance markets in less obvious ways. Weak governance
156 Fighting the Diseases of Povertystructures, including poorly defined property rights, excessivelybureaucratic rules for business, and an absence of the rule of law inmany middle and low income countries mean that large sections ofthe population are forced to seek employment in the informaleconomy. The informal economy tends to be disjointed, whichimplies that it would be difficult for potential insurance companiesto take advantage of economies of scale. At the same time, the diversityand transience of such workers and their dependents meansthat enrolment is difficult and costly, if not altogether impossible.The <strong>International</strong> Labour Organisation estimates, for example,that between 1990 and 2000, 85 per cent of all new jobs in LatinAmerica were created in the informal sector. In Zambia, only 10 percent of the workforce is employed in the formal sector. Accordingly,in sub-Saharan Africa only around 25 per cent of the work force isenrolled in health insurance schemes and most of those have beencivil servants or employees of large multinational companies (Shaw& Ainsworth, 1995).The size of the informal economy in many lower-income countriesis directly attributable to weak governance. As Peruvian economistHernando de Soto has convincingly argued, a lack of enforceableproperty rights and contracts, coupled with excessive regulation andbureaucracy, stifles the creation of legitimate employment opportunities(de Soto, 2000). A recent World Bank study found that, onaverage, it takes a business in a rich nation six procedures, 8 per centof income per capita, and 27 days to become legally recognized. Inpoor or lower-middle-income economies, by contrast, it takes anaverage of 11 procedures, 122 per cent of income per capita, and 59days. These relatively high costs mean that to a large extent,economic activity in such countries is informal. The same studyfound that weak property rights and heavy business regulation havean especially adverse effect on the ability of women and the poor tojoin the formal sector, despite the fact that such regulation is oftendesigned to protect them (Wofford & Shanahan, 2004).By presiding over such destructive governance, governments notonly diminish the ability of their citizens to create wealth, but also
Increasing access to medicines 157hinder the ability of functioning health insurance markets todevelop. Without functional insurance markets, it seems unlikelythat medicines will ever be available universally.The lack of insurance has a knock-on effect on the potentialmarket for drugs, acting as a disincentive to pharmaceutical innovation.Properly insured populations provide a stable and predictablemarket for medicines, reducing the investment risks ofinnovators. For those concerned about both access to existing medicinesand the incentives to innovate new medicines, it is essentialto ensure that effective insurance schemes are allowed to flourish.For this to happen, the regulatory environment needs to be asaccommodating as possible. This should be a priority for policymakers who share these concerns. (Appendix Figure 3 shows whatwould happen to the market for medicines in poor countries if thesedemand-side barriers were lifted).Barriers to innovation of new medicinesThe absence of a functioning market economy not only keeps peoplepoor and undermines access to and demand for medicines and othergoods; it also directly affects the supply of medicines. Governmentsthat fail to foster the rule of law discourage companies from supplyingmedicines in several ways. Slow, expensive and corrupt courtsystems make it difficult to enforce contracts, which in turn discouragepotential suppliers from entering into supply contracts.Also, the risk that trucks carrying medicines will be stopped and thecargo stolen or impounded, or a bribe levied by corrupt law enforcementofficers reduces the incentives of companies to supply medicines.In addition, difficulties enforcing trademarks mean that acompany which attempts to market its products may find that itfaces competition from cheaper – but typically less effective, ineffective,or even harmful – counterfeit products. The evidencesuggests that judicial dysfunction impedes economic growth, andrestricts the ability of inventors and creators to commercialise theirinventions (Sherwood, 2000).
158 Fighting the Diseases of PovertyAs such, these general institutional failures greatly reduce theincentives to develop new medicines, especially for diseases thatprimarily affect the poor. In addition, there are several specific issuesin the institutions of many poorer countries that negatively affectincentives to develop new medicines.Weak intellectual property legislation in low and middleincomecountriesSome have claimed that patents create a barrier to access to medicinesby increasing prices. While this is theoretically plausible, thisscenario still does not explain the low rate of access to medicinesthat are already off patent and thus open to competitive, genericbasedproduction.It is true that when a state grants a patent, it provides theinventor with temporary exclusivity over the patent product orprocess. This can incur real costs, including the possibility to keepprices artificially high when, in absence of legal protection, marketforces would drive prices down to their marginal cost – the lowestprice at which a good can be sold without the producer making aloss. However, as Amir Attaran has shown, more than 98 per cent ofdrugs on the WHO’s ‘Essential Medicines’ list are not patented inany poor country. As we have also illustrated, there are many factorsthat conspire against access, but patents on these specific medicinesare not one of them (Attaran, 2004). In any case, these criticisms ofpatent protection must also be weighed against their benefits.When it comes to creating incentives to encourage the developmentof new medicines for the diseases of poverty, protection ofintellectual property (IP) can play a crucially important role. Thehigh cost of developing a new pharmaceutical product (estimated atupwards of $500 million in the US) (DiMasi et al., 2003), combinedwith the relatively low cost of copying the same product (typicallya few millions of dollars), means that developers must be assuredthat they ‘own’ the product before they will commit such substantialsums.Patents stimulate competition in several important ways that
Increasing access to medicines 159contribute to an environment in which new, better, more effectiveand efficient medicines replace older, less effective and efficientones. Importantly, this environment is also one where access tosuch innovations can be encouraged through mechanisms ofmarkets.One such mechanism is the provision of information about newmedicines, through advertising and other marketing tools. Byincreasing demand for the medicine, such marketing sends a signalto other pharmaceutical companies that it may be worth investingin a competing product.More generally, IP protection in countries with incipient or extantknowledge-based industries is likely to spur economic growth, withpositive consequences for the demand for medicines. 21 Weak IP lawsenable the emergence of copy industries at the expense of innovatorindustries – with negative consequences for economic growthbecause the added value of the copy industries is typically lower thanthat of innovator industries. 22 In addition, innovator companiesbased in countries with strong IP protection will be less likely toengage in joint knowledge-oriented projects with firms in countrieswith weak intellectual property protection (Maskus, 2000).It is perhaps not surprising, then, that between 1997 and 2001,180 of the 184 new molecular entities were developed in the US, theEU and Japan, 23 where intellectual property protection is thestrongest.In addition to providing incentives to local companies to investin the development of innovative products, IP protection in poorcountries may spur innovation by foreign companies to serve localneeds (e.g. developing drugs and vaccines to treat and preventtropical diseases) (Lanjouw, 1998). By contrast, countries thatexploit their weak intellectual property regimes by threatening toissue compulsory licenses for drugs reduce the incentives to investin such research and development (Rozek, 2000).The contrasting cases of India and Singapore shed some light onthe link between strong intellectual property legislation and innovation.
160 Fighting the Diseases of PovertyIn India, Indira Gandhi’s government passed laws in 1972 thatmade it impossible to patent pharmaceutical products, with theresult that the past 33 years have seen practically no new drugscreated within that country to tackle its most pressing diseases.Instead, a large generics industry developed. Yet for all the copies ofmedicines being produced by India’s then 20,000 or more pharmaceuticalcompanies (many of them small-scale ‘mom and pop’ operations),access to medicines in India remained deplorably low,standing at less than 40 per cent in 1999 (Lanjouw, 1999). Inaddition, despite being a global centre for the manufacture ofgeneric AIDS drugs, only 12,000 of India’s 5 million HIV positivecitizens were receiving antiretroviral drugs by the end of 2005(UNAIDS, 2006).India’s implementation of a TRIPS-compliant patent law hasprobably in part reduced the number of companies producing copiesof drugs but it has had no discernable impact on rates of access tomedicines, which almost certainly remain extremely low. Again, thefact is that there are far more serious problems at play which affectaccess to medicines besides intellectual property rights, such as anentirely inadequate medical infrastructure.Nevertheless, the recent changes in India’s intellectual propertylaw already have stimulated Indian firms to develop drugs fordiseases that predominantly affect the local population. Forinstance, Nicholas Piramal has recently opened a US $20 millionresearch and development centre in Bombay to carry out basicresearch in a wide range of health problems, ranging from cancer tomalaria. Ranbaxy (India’s largest pharmaceutical company) and Dr.Reddy’s are also pursuing similar R&D projects. India currently hasthe largest number of FDA approved pharmaceutical manufacturingcompanies outside the US, and has increased spending on R&D from4 per cent, five years ago, to 8 per cent today. 24The change in patent law is also attracting significant foreigninvestment. Multi-national pharmaceutical companies such asMerck and Bristol-Meyers Squibb now see India as a prime locationfor establishing research facilities. India is attractive not only
Increasing access to medicines 161because of its lower basic costs, but also because of the many welleducatedresearchers that can reliably conduct capital-intensiveclinical trials and more complicated forms of later stage drugdevelopment. The management consultants McKinsey estimatethat by 2010, US and European pharmaceutical companies willspend US $1.5 billion annually in India on clinical trials alone(Padma, 2005).Many Western firms are also seeking to partner with local expertise.One recent example is collaboration between Danish-basedNovo Nordisk and Dr. Reddy’s to create a new treatment fordiabetes. Japanese firms have also expressed interest in investingsubstantial sums into Indian R&D projects. Instead of imposing prohibitivebarriers, as it once did, the Indian government actively hascourted these foreign investments by providing incentives, such asa 10-year tax break to pharmaceutical companies that are involvedin research and development.Such developments mean that an Indian firm may well developa vaccine for malaria or improve current tuberculosis therapies,resistance to which contributes to the deaths of over 1,000 peopleeach day in India alone. Investments are even going into R&D for avaccine for HIV/AIDS. Human trials are underway for the second preventativeHIV vaccine candidate produced in India. 25In a relatively short time, India’s new patent law is also hasteningcollaboration between the information technology sector andthe pharmaceutical and biotechnology industries. Until recently, thefledgling research-based biotech and pharmaceutical sectors reliedon patenting in the U.S and Europe.Instead of exporting raw materials and basic active ingredientsthat are used to manufacture generics, firms in India now have theability to compete globally, producing high value-added, life-savingmedicines. This will also contribute to the country’s continuingeconomic growth and its concomitant increase in life expectancy(which has already risen from 36 years in 1951 to its current estimatedlevel of 61 years.Singapore likewise illustrates the benefits of improved patent
162 Fighting the Diseases of Povertyprotection. In 2001 it implemented a new patent law which broughtthe country into compliance with international standards. As aresult, US $5 billion in FDI has helped to sustain that country’sposition as one of Asia’s strongest economies. Singapore’s burgeoningbiomedical science sector has played a central role: output in2004 was US $9.7 billion, a 33.2 per cent increase on the previousyear. 26 This is not limited to investment on the part of establishedwestern pharmaceutical companies, as a host of younger indigenousR&D companies are also scaling up their operations. 27 Singapore’semergence as a significant location for value-added R&D hasalso contributed to the search for new medicines for diseasesendemic to poor countries. A high profile investment in Singaporeis the Novartis Institute for Tropical Diseases, which opened in July2004. It will focus initially on researching treatments for denguefever and drug resistant tuberculosis.Hypothetical: Creating a market for malariatreatmentTo evaluate the impact of improved IP protection onincentives to develop and market a new drug for one of thediseases of poverty, consider the potential market for a newmalaria treatment.While the costs of researching and developing a newdrug in the US and other wealthy countries are estimated tobe US $800 million, the costs of developing a drug in a lessdeveloped country would be far lower. Because ofcomparative advantages of producing in those countries, weassume that the cost would be around US $100 million(taking into account failure rates, etc.).Currently, approximately 300 million people suffer frommalaria each year. If 10 per cent of those pay for a newtreatment, that amounts to 30 million treatments per year.Although patents are valid for 20 years after filing, theeffective life of a patent for a new drug is on average cut to
Increasing access to medicines 163about 10 years because of the time it takes to develop, testand comply with regulatory requirements (IFPMA, 2004).That means a total of 300 million courses of treatmentwhile the drug is under patent.Assuming a discount rate of 15 per cent, each course oftherapy needs to yield a margin of only 62 cents in order forthe developer to break even on sales. The average cost ofproduction for a course of Artemisinin Combination Therapytreatment is currently estimated at US $2.40. 28 Assumingthat a new drug would cost a similar amount, the total costof one course of treatment need be only around US $3.50for the developer of the drug to cover the cost ofdevelopment, production and marketing – and even make aprofit (albeit a relatively small amount). At such a price, anew, patented malaria therapy would be competitive in themarket and might plausibly sell the necessary 30 millioncourses per year.If it were possible effectively to patent a new malariadrug in relevant markets, it seems plausible that there wouldexist a private sector company which could produce a costeffectiveand efficacious new malaria treatment.Sadly, however, the barriers to innovation and accessdescribed in this chapter mean that the discovery anddevelopment of drugs for the diseases of poverty is currentlynot financially viable for private sector firms, except as partof their philanthropic efforts.Inappropriate levels of intellectual property protectionin developed countriesFrom the above, it is clear that intellectual property protection inmost lower-income countries is almost certainly too weak, with theresult that the level of for-profit development of medicines for thediseases endemic to those countries is too low.
164 Fighting the Diseases of PovertyHowever, concerns have been raised that in certain respects,intellectual property protection in some wealthier countries may betoo strong. In particular, we are concerned that in some casespatents are granted for what appear to be mere discoveries ratherthan genuine innovations. For example, in some cases a geneticsequence has been patented even though the use of that sequencehas not been identified. This might have the perverse effect ofcreating too broad a patent, blocking downstream innovations. Onthe other hand, it is possible that without such patents, investmentsin biotech research would be far lower, and the discoveries that formthe basis of downstream pharmaceutical products would nevercome into being.Likewise, there has been much criticism of patents granted forresearch tools. These, it is argued, raise the cost of research withoutproviding any substantive benefits. On the other hand, it is againpossible that without the possibility of patents, there would beinsufficient incentives to invest in the development of the researchtool in the first place.After the fact, it is often easy to argue that an invention was‘obvious.’ To engineers who develop laser-guidance systems, thelight bulb no doubt seems ‘obvious.’ To the developers of modernhybrid cars, perhaps the internal combustion engine seems‘obvious’. But the reason the innovations seem obvious after the factis that they are already there and in some sense have been factoredinto all downstream innovations. What is not clear is whether they– and the downstream innovations upon which they depend –would in fact have been developed had there been no means bywhich the inventors could have captured the rewards of their investments.Nevertheless, the question remains as to how best to ensurethat patents that are granted are not too broad. This may beaddressed in various ways. Some, for example, argue that greaterpre-grant scrutiny of patents would reduce the number of egregiouspatents that are granted. In our opinion this is not a goodsolution. In a TRIPS-compliant system where patents are granted
Increasing access to medicines 165for 20 years after filing, it would likely further delay the grantingof patents. This would both delay investments in R&D related tothe patented innovation and reduce the effective life of the patentonce granted. In the con<strong>text</strong> of medicines, this would mean fewernew drugs and longer delays in their appearance on the market.Others argue that the rules applied by patent examiners should bechanged. For example, it has been suggested that patent applicationsshould be evaluated not only on the basis of the three standardcriteria (novelty, non-obviousness, and utility) 29 but also on the basisof their effectiveness. This, however, presupposes that effectivenesscan be measured prior to the development and testing of a product,which usually it cannot – especially in the case of new molecularentities. In such circumstances, the requirement of ‘effectiveness’ willlead to arbitrary decisions by patent examiners and judges, andpatents will not be granted to many potentially effective products.We believe that there are better solutions, including:◆◆◆◆◆Simplified procedures for granting patents. At present, manycountries have highly bureaucratised patent agencies, whichare extremely slow in making decisions on the granting ofpatents; streamlining procedures along the lines ofinternational best-practice could improve the situation.The introduction of regional patent granting agencies. Whereresource constraints are a problem for patent offices, suchagencies could reduce costs and increase throughput, therebyincreasing the competitiveness of the whole region.Improved incentives for patent agents to make decisions. Forexample, introducing a performance related pay system(appropriately constrained by quality requirements) mightincrease throughput of patent applications; contracting out theservice to the private sector could have a similar effect.Simplified procedures for challenging patents in courts. Thiswould enable more rapid and less costly resolution of disputes.The introduction of petty patents or ‘utility models.’ Thiswould be useful for certain classes of product where a full
166 Fighting the Diseases of Poverty◆patent might not be justified – these might apply, for example,to research tools and certain genetic sequences.Competition between patenting authorities. While it may bedesirable to have common minimum standards for patents,such as those to which members of the WTO have agreedunder TRIPS, it is important also to retain a degree ofcompetition between authorities in order to ensure that theappropriate breadth of patents may be discovered. 30Pre-market regulationsCompanies are required to comply with an increasing number ofregulations before they can launch a pharmaceutical product ontothe market. This drives up the costs of supply, making the endproduct more expensive and thus less affordable for customers inlower-income countries. According to a survey of 20 leading pharmaceuticalcompanies conducted by the CMR Institute for RegulatoryScience in 2003, 65 per cent of companies felt that the changein the regulatory environment over the preceding three years hadincreased the cost and time of bringing new medicines to market.Furthermore, 23 per cent of those surveyed felt that the increasingregulatory burden was directly responsible for the decline in NMEsubmissions (CMR, 2004). In South Africa, the situation is exacerbatedby the Department of Health’s stipulation that it approve allnew drugs, even if they have been approved already in the EU, USor Japan. This can add delays of two or more years before new medicinesare available in South Africa.Because regulatory bodies are beholden to national governments,their tendency is to ensure that the potential side effects ofnew drugs are minimised as far as possible. This is because the publicitysurrounding the discovery of an unsafe drug in the marketleads to a public outcry, resulting in high political costs for nationalregulatory authorities. The missed gains from new medicines thatare delayed or refused approval are less obvious (or even intangible)to the general public, so regulators have an incentive to err on the
Increasing access to medicines 167side of caution. However, if the regulator only considers potentiallyharmful side effects, this will have the unintended consequence ofraising the cost, and delaying or preventing the approval of newdrugs.One consequence of an excessively precautionary approach isthat regulatory authorities allow new medicines or vaccines to besold to the public only after extensive pre-clinical and clinical trialshave been performed. These trials examine the safety, quality andefficacy of the new drug in treating or curing diseases. Estimates ofthe average time it takes to for a new drug to go through these trialsrange from 8.5 to 13.5 years, a process which adds considerablecosts to the drug development process (DiMasi, 1995; Adams &Brantner, 2003; Dranover & Meltzer, 1994).Estimates of the cost of bringing a new drug to market vary;some researchers suggest that the total cost is over US $800 million(DiMasi et al., 2003). As such, manufacturers have strong incentivesto concentrate their resources on developing ‘blockbuster’ drugsthat will provide a return on that significant investment. Meanwhile,there is less incentive to invest in drugs for rarer conditionsin the richer world (such as psychiatric disorders) and even for relativelycommon diseases in lower-income countries.Professor Sir Michael Rawlins, Chairman of the UK’s NationalInstitute for Health and Clinical Excellence, has argued that many ofthe preclinical and clinical studies required by various regulatoryagencies add little to the safety of the final product, but instead contributeunnecessarily to the estimated US $300–450 million cost ofclinical development (Rawlins, 2004). Clearly removing excessivelyprecautionary regulatory barriers would speed up drug developmentand reduce costs, creating stronger incentives to invest in thedevelopment of new drugs for diseases that may otherwise be relativelyunprofitable.To some extent, the length of time it takes for new drugs to enterthe market, and the consequent cost to society of delays, is an issuerecognised by regulatory agencies. The FDA has adopted ‘fast-trackapproval’ and ‘accelerated approval’ for certain classes of drugs,
168 Fighting the Diseases of Povertywhile the European Medicines Agency has instituted stiff targets forthe marketing approval of orphan drugs. These represent a step inthe right direction, but governments are often tempted to imposefurther regulations on drugs manufacturers when they come underpolitical pressure. A recent example comes from the UnitedKingdom, where the health minister Lord Warner revealed that heis considering a fourth stage of clinical trials to alleviate safety fearssurrounding new drugs. Legislators should resist the temptation toassuage public fears through such excessive regulation, because itwould increase the time and expense of getting a drug to market.This would be most harmful for the development of drugs forregions or diseases where returns are the lowest – most typically,diseases endemic to lower-income countries.One solution that would ensure new drugs reach markets asquickly as possible – in part by reducing the ability of local drug regulatoryagencies to impose arbitrary and overly stringent requirementson new registrations – would be to enable competitionbetween existing national drug regulators, as well as betweenprivate certification boards (Sauer, 2005).Such accountable, competitive regulators would set the standardsof regulation at levels demanded by those making choicesabout drug regimens. For many drugs, this would mean swifterapprovals and a reduction in development costs, leading to anincrease in the number of drugs developed for most diseases – especiallythose which affect the poorest and those which affect relativelysmaller populations – while also reducing the price ofmedicines to all.Public health would be safeguarded by the desire of theseagencies to defend their own reputations. The importance of reputationin maintaining clients and attracting new ones, the existenceof a free press engaging in investigative journalism, andexpected penalties through the legal system for corrupt and dangerousdecisions by these regulators, should lead to a well-functioningmarket in drug approval. A drug approval agency thatbends to pressure from pharmaceutical companies, for example,
Increasing access to medicines 169would be quickly exposed, and the marketability of their futureproducts would suffer.Data exclusivityAnother aspect of pre-market regulation is the treatment of the datasubmitted to regulatory authorities. These data are submitted onthe basis of ‘data exclusivity,’ an agreement that the authorities willnot release them for a specified period and that during this periodother firms may not rely upon the data as the basis for their applicationsfor licenses.This period of data exclusivity varies from 5 to 11 years. 31 Onceit expires, competing companies are free to access and rely upon thedata and thereby avoid having to conduct duplicative research (andassociated costs). 32It has been alleged that these periods of data exclusivity hindergeneric competition, thereby keeping the price of medicines unnecessarilyhigh. But while the introduction of competition typicallyleads to price reductions on medicines, the net effect will depend onthe impact it has on the incentives to invest in research and development.Companies invest heavily in the development of the datathey supply to regulators during the approval process. If these dataare then shared with other companies, the value to the originator isreduced. This erosion of value has negative consequences for theability to raise the funds required to conduct future tests, and islikely to act as a disincentive to companies which might otherwisebring new, therapeutically beneficial medicines to the marketplace.33Unclear rules governing the submission of data to regulatoryauthorities will only increase legal disputes between research-basedcompanies and their generic counterparts. These disputes arealready common and their frivolous costs must now be factored intothe rapidly rising total cost of delivering a drug to the marketplace.While great effort is being expended towards containing thesecosts, the failure properly to address data exclusivity arrangements
170 Fighting the Diseases of Povertythreatens not only to increase costs, but also to reduce the incentivesto innovate as well.Price differentiationThe ability to sell a product at different prices to different consumersenables companies with a degree of market exclusivity to ensurethat their products reach as many consumers as possible while stillmaximising revenue. If a company is able to segment markets preciselyaccording to each individual’s willingness to pay, then everyconsumer willing to pay at least the marginal cost of production forthe product should be able to purchase that product. This wouldboth maximise the number of people who benefit from the productand would also maximise revenue to the company, which in principlewould enable more to be spent on R&D.Perfect market segmentation means that the number of consumersserved and the price paid by the poorest consumer are thesame as that which would exist in a perfectly competitive market(Appendix Figure 5).In practice, market segmentation is costly to enact – primarilybecause of the need to prevent low-price purchasers reselling tohigher-price purchasers – and the larger the number of marketsegments, the greater the cost. So, firms weigh up the benefits ofadding a segment with the cost of enforcing the additional segmentation.Typically, firms segment markets first by overall market(which is usually a country or trading bloc) and then by sub-categories,such as: individuals (which may be further segmented byage and income), businesses, charities, and governmental bodies.So, for example, drug prices in South Africa are far lower than inEurope and the US (Reekie, 1997). This means that market segmentationcan be particularly beneficial for patients in poorercountries.Where the overall market for a product is very large and wherethat market is readily segmented (i.e. the cost of enforcing the segmentationis low compared to the benefits), companies may set the
Increasing access to medicines 171lowest price close to the marginal cost of production. In the con<strong>text</strong>of a disease such as HIV/AIDS, where the total market for medicinesis massive and the humanitarian case for widespread distribution isgreat, companies may even choose to sell below marginal costs insome markets, provided that sufficient profit is recuperated inothers (Danzon & Furukawa, 2003).Market segmentation is underpinned by intellectual property –especially patents and trademarks – and contracts. If the intellectualproperty rights and contracts are respected, 34 firms can operatefreely within the marketplace without running the risk of havingseparate national or international markets compromised by theresale of the lowest priced medicines into markets where prices arerelatively higher. 35 However, infringements upon intellectualproperty rights mean that firms cannot control their own pricingschemes, with serious consequences. Not only does this act as a disincentivefor firms to sell their products in poor countries, it mayalso inhibit future innovation.In short, price differentiation allows companies to cater forpeople who otherwise could not afford to purchase their products.It allows countries that are not able to shoulder the costs of R&Dthemselves to afford expensive medicines. It also means output ishigher than the level that would occur if no differentiation werepossible. Moreover, the innovator is able to generate more revenue,providing a greater pool of resources for investing in new drugdevelopment.Price controlsUnfortunately, governments often restrict the ability of companiesto implement differential pricing strategies. For example, they frequentlyimpose price controls on drugs, capping the price of drugsand making any other sales price illegal. Nearly all economicallyadvanced countries – with the notable exception of the United States– impose price controls on medicines in one form or another (Danzon& Furukawa, 2003). Because the controlled price is effectively the only
172 Fighting the Diseases of Povertyprice, this prevents competition that would drive the price lower; inother words, the price ‘ceiling’ becoming a price floor (U.S. Dept ofCommerce, 2004).Drug price controls discourage companies from registeringproducts in certain markets, leading to shortages in supplies andillegal trade in medicines. This in turn provides a route for counterfeitmedicines to enter the market. A 2003 study illustrated that oneof the risks of parallel importation from countries which have regulationsthat ensure low drug prices is that medicine manufacturersprefer to delay or cancel the launch of a particular product in theprice-controlling countries (Danzon et al., 2003). The study showedthat between 1994 and 1998, there were 85 New Chemical Entitieslaunched in the US and UK. However, out of a maximum possible2,125 registrations of these NCEs in 25 countries, only 55 per cent(1,167) were actually registered. The research also showed thatthose countries with lower expected prices or a smaller expectedmarket size – most typically lower-income countries – experiencelonger delays in drug registration.Delays in registration of new medicines are particularly harmfulto sufferers of HIV/AIDS. Research shows that one new anti-retroviral(ARV) HIV/AIDS drug prevents around 6,000 deaths in the US thefollowing year and ultimately prevents around 34,000 deaths (Lichtenberg,2003). Although new ARVs cost more than older, off-patentones, they can substantially reduce the number of lost productivework days, so in many cases pay for themselves in a purely financialsense (one study estimated that 21.3 per cent fewer days were lostwith the introduction of each new ARV) (Lichtenberg, 2003). Newerdrugs also reduce the amount of time patients spend in hospital,negating any financial benefit from using older, off-patent drugs.Price controls also have a number of other adverse impacts:Reduced supplyRegulations on drug prices drive pharmacies into bankruptcy astheir margins are squeezed, and make the distribution of drugs toremote and rural regions financially unviable. For example, the price
Increasing access to medicines 173caps forced on certain drugs in South Africa have been implicated inthe closure of 103 pharmacies. 36 Price controls will likely reduceprofit margins on controlled-price pharmaceuticals. As a result,wholesalers and pharmacies are likely to carry a smaller range ofdrugs. If the price controls are widespread or targeted at the mostpopular drugs, they may have such a negative impact on profits thatit is not worth a wholesaler distributing them to far-flung pharmacies– and so pharmacies in rural areas will be more likely to close.The lack of profitability in the sale and distribution of medicines willalso reduce the incentives for pharmacists to invest in training,which will make them less effective purveyors of healthcare advice.This would be particularly damaging to the rural poor, whosecontact with professional healthcare is very often limited to localpharmacists.Reduced innovationIn many countries (especially Canada, and countries in Europe andAustralasia), government control over healthcare systems has leddirectly to price controls of one kind or another. Ageing populations,combined with more effective but more costly treatments for manydiseases puts upwards pressure on healthcare costs. Politicians maybe wary to increase spending on health, especially where thespending affects the incomes of taxpayers and can be seen as theresult of their actions – because of the potential it could have ontheir chances to be re-elected.The relatively short electoral cycle creates incentives on the partof politicians to achieve short-term savings, even when these willlead to longer-term costs or longer-term harm to health. The resulthas been strong pressures to restrict access to more costly new pharmaceuticalswhich are relatively more expensive, even though inmany cases these new drugs would reduce the subsequent need formore expensive procedures and hospital treatment.A striking example comes from Canada, whose Patented MedicinesReview Board sets strict guidelines on the price of medicines.This board also has the power to compel a supplier to reduce prices
174 Fighting the Diseases of Povertyif they exceed pre-determined levels (Menon, 2001). Likewise,Germany’s government sets levels at which it will reimburse purchasesof specific classes of drugs, with consumers paying any difference.This has the result that the consumer’s perception of thecost of buying newer drugs is much greater than the real price differential.As a result, consumers have an incentive to buy olderdrugs that are less effective.Price controls reduce the ability of producers to implement effectiveprice differentiation strategies. In essence, fewer drugs aresupplied at a price higher than would be paid by the poorestconsumer but lower than would be paid by the wealthiestconsumer. As a result, wholesalers and retailers are likely to carry asmaller range of drugs. If the price controls are widespread andtargeted at the most profitable drugs, they are likely to have a substantialimpact on profits throughout the value chain. That meansnot only fewer wholesalers and pharmacies, but also less investmentin new drugs by pharmaceutical companies. (The economicconsequences can be seen in Appendix Figure 6.)Economic theory is backed up by increasing amounts of empiricalevidence. Price controls have had a direct negative impact on thenumbers of new drugs that are submitted for regulatory approval.A recent US Department of Commerce study found that the pricecontrols used by a range of OECD countries have resulted in a significantdecrease in spending on both old and new drugs (U.S.Department of Commerce, 2004). It found that these controls havedecreased the price, pushing it closer to marginal production costs,which in turn leaves less revenue for future investment in R&D. Thestudy estimated that, after extrapolating to a broader set of OECDcountries, the diminished returns as a result of price controls are inthe range of US $18 billion to $27 billion annually. If this lost revenuecould be recouped through deregulated pricing strategies, the studycalculates that an additional three or four new molecular entities(NMEs) could be developed every year. To put this into con<strong>text</strong>, only30 NMEs were approved by the FDA between 2000 and 2003.Price controls in some European countries have also hindered
Increasing access to medicines 175Europe’s ability to develop new medicines. In 1992, six out of ten bestselling medicines were developed in Europe; by 2002 only 2 out of 10were of European origin. If the US were to introduce price controls, itis estimated that this would result in a reduction pharmaceutical R&Dby some 30 per cent. This would translate into 330 to 365 fewer newdrugs within a twenty-year period (Giacotto, 2004).Compulsory licensesCompulsory licenses – or the threat of issuing a compulsory license– can have a similar effect on innovation as price controls. In theinterest of improving public health, compulsory licenses can be away for extremely poor countries to procure relatively inexpensivemedicines (when all attempts to secure such products voluntarilyhave been exhausted). The issuance of such licenses in a medicalstate of emergency has always been permitted under the originalTRIPs Agreement for countries with manufacturing capacity. The2001 WTO Doha TRIPS agreement extends this safeguard to countrieswithout manufacturing capacity – enabling them to procurefrom companies with manufacturing capacity but where otherwiseproduction would be restricted to patent holders – thereby protectingthe interests of the poorest nations.In practise, however, middle-income countries such as Brazilhave often used the threat of compulsory licensing as a negotiatingtool to secure lower prices. 37 While this can prove to be a politicallypopular move in the short term, it undermines the ability of innovatorcompanies effectively to price differentiate. It also placesincreased strain on pricing strategies aimed at offering the cheapestmedicines to patients in extremely poor countries, and acts as afurther disincentive for firms to develop new and improved medicinesfor the diseases of poverty (Kremer et al., 2004). (AppendixFigure 4 shows what would happen if both demand and supply-sideconstraints were lifted.)
176 Fighting the Diseases of PovertyDiscussionClearly, many urgent health concerns in the poorest parts of theworld could be addressed if existing drugs and interventions wereto be distributed properly. However, a variety of factors conspire toprevent people from receiving the medicines they need. As we haveseen, poor road and electricity networks hinder the distribution ofdrugs, as does the shortage of medical facilities such as clinics, hospitalsand pharmacies. Health insurance systems, which wouldenhance access to medical care, are currently inadequate becausethe governments of lower-income countries frequently fail to fosterthe kind of institutional environments in which they can thrive.But people are also denied medicines in more insidious ways.Governments in lower-income countries impose burdensome taxesand tariffs on imported medicines, pricing many people out of treatment.Governments also impose often unjustifiable non-tariffbarriers, such as arbitrary licensing restrictions. At the same time,governments nominally offer healthcare services to everyone, but inpractice they do so in ways that primarily benefit a small number ofcitizens (mostly the elite) at a very high cost. As a result, government-financedhealthcare systems in such countries are often poorlyresourced and poorly managed. Meanwhile, the private sector oftenis over-regulated. These glaring failures of governance help toensure that universal access to essential medicines remains a longway off for many regions of the world.The manifold failures in drug distribution also have ramificationsthat reach beyond the immediate health needs. Because thesefailures diminish demand for medicines, they make it less likely thatnew medicines will be created. In richer countries this is less of aproblem because effective demand is higher.Producers respond to the perceived demands of consumers,whether those consumers are individuals, health agencies, insurancecompanies or governments. (This is illustrated in AppendixFigure 1.) This has led to the creation of a wide variety of drugs tocombat the range of disorders suffered by consumers in rich countrymarkets. However, in lower income countries the absolute size of
Increasing access to medicines 177the market is constrained by the weakness of distribution mechanisms,leading to a concomitant decrease in supply. If a medicinestands little chance of actually reaching its intended consumer,there is little point in risking large amounts of capital in developinga drug specifically designed for a poorer market. As a result, certaindiseases endemic to these regions, such as the cluster of so-called‘neglected diseases,’ 38 have failed to attract sufficient research fromcommercial drugs companies. More problematic is the fact thatthese same constraints also limit the distribution of all kinds of preexistingmedicines. Access to these medicines would improve if themany barriers to access identified in this chapter were addressed asa matter of priority.
178 Fighting the Diseases of PovertyAppendixFigure 1 Market equilibriumPSP0DQ0QFigure 1 shows consumer willingness to pay, represented by the‘demand’ curve, D, and industry willingness to supply, representedby the ‘supply’ curve, S. The intersection of these two curves showsthe total quantity that will be supplied, Q 0 and the minimum pricecharged, P 0 .
Increasing access to medicines 179Figure 2 Effect of taxes and tariffs on demand formedicinesPS1SP + tariffPQtariffQQIf a government imposes a tax on a medicine, this raises theminimum price artificially. Figure 2 shows the effect of adding sucha tax; the supply curve is effectively shifted inwards because suppliersmust now add the tax to the amount that they charge. As aresult, the amount supplied falls from Q 0 to Q tariff .
180 Fighting the Diseases of PovertyFigure 3 The impact of a rightward shift in the demandcurvePSP1P0D1DQ0Q1QFigure 3 shows that when consumer willingness to pay increases(for example as a result of a rise in income), the demand curve shiftsto the right. This leads to an increase in the amount supplied (fromQ 0 to Q 1 ) and also to an increase in the minimum price (from P 0 toP 1 ). This is because the supply has been met by moving along theoriginal supply curve, for which the cost of producing an incrementalunit is assumed to rise as output rises — because more expensiveproduction methods have to be brought on-stream.
Increasing access to medicines 181Figure 4 The impact of a rightward shift in the supplycurvePSP1S1P0P3D1DQ0Q1Q3QHowever, the rise in price (as a result of the expansion in thedemand curve in Figure 3) is likely to be seen by entrepreneurs as anopportunity to make money by supplying the market using newtechnologies (these might be, for example, new production technologies,or they might be new drugs in the same class). As thoseentrepreneurs enter the market, supply increases to Q 3 , and theprice falls to P 3 . This can be represented as a rightward shift in thesupply curve (Figure 4).
182 Fighting the Diseases of PovertyFigure 5 Perfect market segmentationPPmaxP1P2P3SPminDQQIf a supplier has an element of market power (for example as a resultof the temporary market exclusivity conferred by a patent), then inprinciple he is able to set prices and will do so in such a way as tomaximise profits. The <strong>text</strong>book economics analysis of such situationsassumes that the supplier will choose only one price, whichwill be higher than the marginal cost of production. However, if thesupplier is able to segment the market perfectly, then he will sell ata wide range of different prices to different consumers and willmaximise profits by setting the minimum price (Pmin) at which hesells just above the marginal cost of production and the maximumprice at Pmax. He will then sell total quantity Q, which is the sameas the perfectly competitive quantity. This is shown in Figure 5.
Increasing access to medicines 183Figure 6 Regulated marketPQrSQ0DQrQ0QThe quantity sold under a regulated market, Q r , is lower than thequantity sold under a segmented market, Q 0 , where the firm is ableto price its product based on the willingness to pay of differentgroups of consumers. The price paid by the poorest consumer in theregulated market, P r , is higher than the lowest price charged in asegmented market, P 0 .
6 Cost effective means offighting the diseases ofpovertyKhalil Ahmed, 1 Franklin Cudjoe, 2 Eustace Davie, 3John Kilama, 4 Martín Krause, 5 Andrés Mejia, 6Barun Mitra, 7 Nonoy Oplas, 8 Martín Simonetta, 9Philip Stevens, 10 Jose Luis Tapa, 11 Margaret Tse, 12Jasson Urbach 13This chapter considers the cost-effectiveness of existing strategiesfor addressing the diseases of poverty promoted by the WHO andother intergovenmental organisations and compares these to otherpossible strategies. The first half examines the UN’s response toHIV/AIDS and malaria. The second half looks at what might be doneto tackle those diseases of poverty which have a lower politicalprofile but nonetheless constitute a significant proportion of thedisease burden of less developed countries – diarrhoeal diseases,acute lower respiratory infections and diseases associated withmalnutrition.HIV/AIDS: The WHO’s ‘3 by 5’ treatment planIn September 2003, the World Health Organisation announcedthat it would ensure that by the end of 2005, 3 million HIVinfectedpeople would be on anti-retroviral treatment. Since then,many billions of dollars have been spent attempting to achievethat goal. However, by December 2005, only 1.3 million people
186 Fighting the Diseases of PovertyTable 1 Doctors and nurses available and people living with HIV/AIDS for selected sub-SaharancountriesMedical Nurses PLWHAs Total PLWHAs PLWHAs PLWHAsdoctors per 100,000 (thousands) population per 100,000 per medical per nurseper 100,000 pop (thousands) population doctorpopMalawi 1 26 900 12,105 7,435 7,435 286Mozambique 2 21 1,300 18,863 6,892 3,446 328Zimbabwe 6 54 1,800 12,835 14,024 2,337 260Tanzania 2 37 1,600 36,977 4,327 2,164 117Rwanda 2 21 250 8,387 2,981 1,490 142Zambia 7 113 920 10,812 8,509 1,216 75Swaziland 18 320 220 1,077 20,427 1,135 64Botswana 29 241 350 1,785 19,608 676 81Uganda 5 54 530 26,699 1,985 397 37South Africa 69 388 5,300 45,026 11,771 171 30Source: adapted from http://www.who.int/globalatlas/default.asp & http://www.who.int/hiv/universalaccess2010/en/
Cost effective means of fighting the diseases of poverty 187had access to these drugs – representing only 43 per cent of theWHO target of 3 million people by the end of 2005 (UNAIDS,2006). In sub-Saharan Africa, only 11 per cent of those whoneeded treatment were receiving it in June 2005 (UNAIDS/WHO,2005a).Depressingly, the failure of the initiative was entirely predictable.The necessity of reaching its ambitious target led the WHO to scaleup treatment despite the manifest absence of workable health infrastructurein the worst afflicted countries. The overwhelmingmajority of people living with HIV/AIDS (PLWHA) are in sub-SaharanAfrica, where public health systems are fragmented, dilapidated ornearly non-existent. Most countries in the region lack sufficientqualified health workers and doctors, not to mention pharmacies,clinics and doctors. Figure 1 shows that some of the worst afflictedcountries also have the fewest medical professionals.Antiretroviral drugs are complex to administer, requiring specifiedregimens and oversight by knowledgeable professionals andtesting equipment, both of which are in short supply in most of Sub-Saharan Africa. Seen in this light, the WHO’s decision to push its masstreatment initiative as the key to solving the AIDS crisis was a grossstrategic error. Without sufficient staff and facilities, there is a substantialrisk that inappropriate doses will be handed out to patients,and patients will not adhere to regimens. This raises the spectre ofresistance, which has the potential to render many of the currentlyavailable treatments ineffective (Blower et al., 2003). Samples takenbefore 1996 showed about 5 per cent drug resistance to existing HIVstrains, rising to at least 15 per cent between 1999 and 2003. This allimplies significant extra costs as drug-resistant patients have to bemoved onto expensive second-line and third-line therapies (REF).It is unlikely that the governments of these most afflicted countries,with a good knowledge of their infrastructural and humanresource constraints, would have imposed such ambitious ARV treatmenttargets on themselves – indeed, the WHO never consulted orasked for approval from member states when it launched “3 by 5”in December 2003. Many extremely poor countries have enormous
188 Fighting the Diseases of Povertydifficulty delivering simple vaccines and essential medicines to theirpopulations, let alone delivering and monitoring complex ARVregimes.Meanwhile a variety of factors – including the mismanagementof funds, inefficiency, waste, expensive technical assistance and corruptionwithin recipient governments – has meant the cost oftreating a developing-country patient for two years ballooned to$12,538 by the end of 2005 – nearly 10 times the $1,633 initiallyestimated by UNAIDS. Such inflated costs will be unsustainable ifthe UN is to meet its current target of placing 10 million PLWHA onARV treatment by 2010.It is not even clear that the WHO’s efforts directly led to theachievement of 1.3 million on ARV treatment by the end of 2005,not least because many of the countries that have been most successfulin scaling up treatment – such as Thailand and Brazil –were already running successful treatment programmes independentof WHO advice. Furthermore, it is recognised that by the endof 2005, some 716,000 people were receiving ARV treatment independentlyof “3 by 5” through the Accelerating Access Initiative,a partnership between the UN and several pharmaceutical companies.14PreventionLeading public health experts are virtually unanimous in concludingthat prevention is of paramount importance in the fight againstAIDS (Salomon et al., 2005). However, by making itself publiclyaccountable to meeting such ambitious treatment targets, the WHOhas been forced to devote far more resources to treatment at theexpense of prevention.The overriding focus on treatment was one result of the 2000international AIDS conference in Durban, South Africa. At about thistime, advances in medical science were making AIDS in the west amanageable (but not curable) condition, as opposed to the automaticdeath sentence it was a few years previously. Health activists
Cost effective means of fighting the diseases of poverty 189thought – not unreasonably – that if American AIDS patients couldget the miracle drugs, why shouldn’t people in poor countries? Previously,international agencies had focused on prevention out of adesire to contain the pandemic, but also because ARV therapies weretoo expensive. However, after voluble and emotive campaigns fromAIDS activists following the Durban AIDS conference, governmentsand global agencies reoriented their strategies towards favouringtreatment.One outcome of this lobbying by pressure groups was thecreation of the WHO’s flagship “3 by 5” programme. But the presumptiontowards treatment has been further institutionalised bythe creation of the President’s Emergency Plan for AIDS Relief(PEPFAR) in 2003, which has been required by the US Congress todedicate 55 per cent of the US $15 billion five year budget for HIV totreatment of individuals with HIV/AIDS. In financial years 2006through to 2008, 75 per cent of those funds are to be spent on thepurchase and distribution of antiretroviral drugs, with only 20 percent of all funding to be spent on prevention. 15The prioritisation of treatment over prevention has had significantopportunity costs, by not curtailing new infections and increasingthe pool of people with the potential to transmit the virus. TheUN’s own statistics indicate that more people became infected withHIV in 2005 than ever before, with an estimated additional fivemillion new infections worldwide. The number of people living withHIV globally has also reached its highest level ever. By the end of2005, global HIV prevalence had risen to an estimated 40.3 millionpeople (UNAIDS, 2006), from a figure of 34.9 million in 2001(UNAIDS, 2004). 4.1 million people were infected in 2005 alone, anincrease from 3.9 million in 2003. According to UNAIDS, HIV prevalenceis increasing in South Africa, China, Indonesia, Papua NewGuinea, Vietnam, Bangladesh and Pakistan. While prevalence ratesin many sub-Saharan African countries seem to be stabilising, veryfew countries are experiencing significant declines in prevalence(UNAIDS, 2006). Figure 2 illustrates the increasing numbers of infectionsglobally.
190 Fighting the Diseases of PovertyTable 2 Regional HIV and AIDS prevalence and infectionrates, 2003 & 2005Region Adults and children newly Adult (15–49)infected with HIV prevalence (%)Sub-Saharan Africa2005 2,700,000 6.12003 2,600,000 6.2North Africa and Middle East2005 64,000 0.22003 54,000 0.2Asia2005 930,000 0.42003 860,000 0.4Oceania2005 7,200 0.32003 9,000 0.3Latin America2005 140,000 0.52003 130,000 0.5Caribbean2005 37,000 1.62003 34,000 1.5Eastern Europe and Central Asia2005 220,000 0.82003 160,000 0.6North America, Western and Central Europe2005 65,000 0.52003 65,000 0.5TOTAL2005 4,100,000 12003 3,900,000 1Source: UNAIDS, 2006.
Cost effective means of fighting the diseases of poverty 191This failure has been underplayed and deflected by WHO, whichhas justified the failure of its “3 by 5” programme on the grounds thatit has galvanised further efforts towards achieving universal accessto treatment, and has demonstrated the feasibility of providing HIVtreatment even in the poorest parts of the world (UNAIDS, 2006).However, the shortcomings of this strategy have been highlightedby a little-publicised external evaluation document commissionedby WHO following the end of the “3 by 5” programme. Asthe document states, “HIV prevention efforts are not containing thepandemic, since some 4.9 million more people became infected withHIV during 2005.” The document continues:HIV prevention has been a technical area within the “3 by 5” initiativethat has received relatively little investment and effectiveprevention interventions, such as the prevention of mother–tochildtransmission of HIV, were not properly prioritised” (WHO,2006b).The WHO’s focus on treatment has therefore allowed thepandemic to become even more out of control. In countries thathave pursued active and sustained HIV prevention strategies, thenumbers of infected people has generally decreased, therebyreducing both the economic burden of caring for PWLHA, as well asreducing the potential human tragedy of a worsening AIDSpandemic. In Uganda, one of the few countries in sub-Saharan Africawhere HIV prevalence has fallen in the last decade, education playedthe key role. The country’s ABC programme (‘Abstain, Be faithful, orCondomize’) emphasised the risks of casual, unprotected sex, andhas had a dramatic effect on patterns of sexual activity, contributingto an 80 per cent reduction in HIV prevalence (Singh et al., 2003).Brazil and Thailand have also managed to reverse the spread of HIVthrough early prevention efforts. More recently, there is someevidence the decline of HIV prevalence in Cambodia, Zimbabwe, andin areas of Tanzania, Haiti, Kenya and Burkina Faso are partly due toHIV prevention efforts (UNAIDS, 2005b).
192 Fighting the Diseases of PovertyAn increasing body of evidence shows how the expansion of preventionprograms could save millions of lives. One study calculatesthat if prevention programmes are scaled up sufficiently, 28 millionnew HIV infections could be averted between 2005–2015. As well aspreventing an impending human tragedy, this would also generatesignificant cost savings. Although the authors estimate that itwould cost $3,900 to avert each infection, this would save $4,700 intreatment and care costs for each individual, resulting in savings of$780 per infection averted (Stover et al., 2006). Furthermore, thispaper also demonstrates that the data reveals that a lack of attentionto prevention between 2001 and 2005 has resulted in a hugemissed opportunity to save lives; indeed, as of 2003 preventionservices were only partially available globally.Even if HIV prevalence is brought under control, we are still leftwith the issue of how best to distribute antiretroviral drugs toinfected patients. A remarkably successful public private partnershipin Botswana between the Gates Foundation, several westerndrug companies and the government offers some lessons. This initiativeinvolved the construction of clinics to distribute high-qualityantiretrovirals, while schools and colleges have undertaken publiceducation programmes (Ramiah & Reich, 2005). Botswana now hasmore people on ARV treatment than any other country in sub-Saharan Africa and is the only such country to provide free treatmentfor all.Private philanthropy can be an effective stop-gap measure. In themedium to long term, however, Africa needs self-sustaining, efficienthealth-care systems that allow effective distribution of lifesaving medicines, as well as the propagation of vital health education.MalariaIn order to combat the global malaria problem, the WHO and associatedagencies kicked off an ambitious plan to ‘Roll Back Malaria’(RBM) in 1998, with the goal of halving malaria incidence by 2010.
Cost effective means of fighting the diseases of poverty 193It proposed to achieve this by a combination of judicious use of medicinesand the distribution of insecticide-treated bed nets.Seven years in, there are some indications that the global malariaproblem is not improving and may be getting worse. Althoughproblems associated with collecting accurate data make it difficultto determine precisely how many people suffer from malaria, in2002 an external evaluation of RBM set up by the WHO said:Anecdotal evidence and the strong consensus among expertssuggests that, at the very least, the malaria burden has notdecreased. What is more likely, and believed to be the case by mostof those involved, is that malaria has got somewhat worse duringthis period. (Malaria Consortium, 2002)More recently, scientists from the University of Oxford suggested,on the basis of improved measurements, that more than half abillion people – nearly double previous estimates – were infected bythe deadliest form of malaria in 2002 (Snow et al., 2005). Clearly, theRoll Back Malaria campaign is failing to achieve its stated goal.But the real tragedy is that malaria might be far less of a problemtoday if the WHO had adopted a different strategy from the beginning.An important part of such a strategy would have includedspraying the inside walls of residential buildings with insecticidessuch as DDT. Remarkable control was achieved in the 1950s and 60s,even in regions where transmission rates were unusually high. Butsince the cessation of such activities the disease has returned tomany such areas, often with devastating impact on human mortality.Residual treatments are far more effective than using bednets,but have been rejected because of environmental concerns. Suchindoor residual spraying (IRS) helps prevent mosquitoes fromentering dwellings and it repels or kills those insects that do manageto enter. Because it minimises the chances of humans being bitten,IRS effectively prevents the transmission of the malarial parasite,which makes it an excellent tool for preventing the spread of thedisease. In the years following World War II, the WHO put DDT at the
194 Fighting the Diseases of Povertycentre of its malaria eradication plan, saving an estimated 50 to 100million lives through prevention alone (Roberts et al., 1997).Many countries have tamed malaria through IRS with DDT(Roberts et al., 2000). India, for example, started a nationwide programmeof IRS with DDT in the 1960s. In that decade, Indiadeployed around 18,000 tonnes of DDT and reduced malaria casesfrom 75 million per year to less than 100,000. Unfortunately, thecaseload increased significantly when the use of DDT was reducedin subsequent decades (Sharma, 1987).More recently, Namibia, Botswana, Mozambique and South Africahave been somewhat successful in reducing the incidence of malariathrough IRS programmes utilising DDT and alternating with otherpesticides (Baird, 2000). Uganda is determined to utilize thispowerful tool, despite potentially being threatened with trade sanctionsby the EU. 6Over the last few decades, however, the WHO has discouragedthe use of DDT in member states – encouraged by environmentalists,who have often massively overstated the negative effects ofDDT on human and animal health (Roberts et al., 2000). Untilrecently, most Western aid agencies discouraged the use of DDT andindoor residual spraying generally, and the WHO has provided littlefinancial assistance to those governments that wish to go down thisroute.Recently, however, USAID has re-evaluated its support of IRS,deciding to allocate more funding to such projects. The WHO alsoundertook something of a volte face in November 2005, when itannounced that IRS with DDT would form a key plank of its Roll BackMalaria programme. In September 2006, the WHO announced thatit would henceforth strongly recommend to member states the useof DDT for IRS.In terms of prevention, the WHO’s Roll Back Malaria strategy haslargely focused on the distribution of insecticide treated bednets,claiming that they provide the most effective means of vectorcontrol. It has historically funded bednets almost to the exclusion ofother preventative measures.
Cost effective means of fighting the diseases of poverty 195While bednets may have a role in preventing transmission ofmalaria (Premji et al., 1995; Philips-Howard et al., 2003), they are farfrom perfect, particularly in the poorest areas where they are mostneeded but can only be obtained at considerable expense. Mosquitoestend to be most active in the hottest parts of the year, and fewpeople relish the thought of covering themselves in a net duringthese hot nights. In certain parts of Africa, people are reluctant tosleep in nets because they resemble a shroud. People also oftenmisuse bednets, with enterprising individuals using them as fishingnets. Even when bednets are used properly they are a far fromperfect barrier, not least because mosquitoes, being opportunistic,will take advantage of any occasion when a person happens to getout of bed during the night (Bean, 2001; Choi, 1995).Bednets also face the hurdle of effective distribution. Whilepublic health authorities in many parts of Africa find it difficult todistribute routine and simple vaccines and treatments, so too arethey failing to get the nets out to all people who need them. Theseproblems are compounded by the fact that the nets need to beretreated with insecticide every three months, or else they losemuch of their utility. 17 According to one study, fewer than five percent of children in malarial areas currently sleep under a bednet(Hamel et al., 2001).Indoor residual spraying alone is not enough. The most successfulmalaria control strategies have been those which have combinedindoor spraying with education campaigns to encourage people toeliminate breeding sites, such as used tires which can collectstagnant water, and changes in the management of animals in orderto reduce the proximity of these malaria parasite reservoirs topeople. 18In combination with these strategies, prophylactic drugs canplay an important role in reducing the pool of malaria parasites inthe human population and thereby reduce transmission rates. Thisis especially important for the most deadly species of humanmalaria parasite, Plasmodium falciparum. In addition, effective drugtreatment can help to reduce the number of deaths.
196 Fighting the Diseases of PovertyHowever, the WHO has also mishandled treatment recommendations.Until as recently as 2004, it advocated the use of chloroquinein Africa, even in the face of increasing resistance to that drug by theP. falciparum. This was despite the existence of a far more effective– albeit more expensive – alternative, Artemisinin CombinationTherapy (ACT). In fact, the WHO recognised the benefits of ACT andnamed it a central plank of its RBM strategy, only then to approvethe use of the nearly useless chloroquine in many African countriesbecause it is cheaper (Attaran et al., 2004). The WHO only recentlystarted heeding its own advice and properly approving ACT after itcame under pressure from malaria experts and the internationalpress. But in part because of the abruptness of WHO’s belatedchange in strategy, artemisinin supply is now unable to keep upwith increased demand.Clearly, the availability of appropriate and effective medicines isof great importance to helping those already infected with themalarial parasite. However, sensible and wide-scale preventiontechniques could remove much of the need for medication, largelybecause there would be far fewer infections in the first place.Reducing the prevalence of malaria would then free up considerableresources for the purchase of the most effective, modern medicinesand avoid debacles such as occurred with RBM and chloroquine.Diarrhoeal diseasesDiarrhoeal diseases are one of the major causes of prematurechildhood deaths in lower-income countries. According to theWorld Bank, three million children die every year from choleraand other water-borne diarrhoeal disorders (World Bank, 2002).Much suffering could be averted with effective use of treatmentssuch Oral Rehydration Therapy (ORT). In addition, antibioticscould be used to eliminate more serious bacterial infections.Finally, vaccines have been and are being developed against viralcauses of diarrhoea, such as rotavirus; if these vaccines weredeployed widely, the incidence of such diseases could be reduced
Cost effective means of fighting the diseases of poverty 197dramatically. In the case of rotavirus, a vaccine could preventsome 500,000 childhood deaths annually. 19 Unfortunately, atpresent even inexpensive treatments such as ORT do not reachthose most in need (Rao et al., 1998).Another, more fundamental approach to controlling thesediseases focuses on improving the quality of drinking water. Currently,water resources in most countries are owned and controlledby the state (typically municipal governments). Yet in poor countries,the state has shown itself to be a very poor provider of water,with some respite from dry or non-existent taps being provided byinformal private suppliers (Okonski, 2006). Where ownership and/ormanagement have been transferred to the private sector, access hastypically improved considerably, as has been shown for Chile (Rosegrant& Gazmuri, 1994), Argentina (Galiani et al., 2003) and Guinea(Menard and Clarke, 2000; Noll et al., 2000; Brook Cowen, 1999). InArgentina, in particular, there is strong evidence that privatisationof supply has led not only to improved access but also to reducedincidence of water-borne disease, especially in the poorest districts(Galiani et al., 2003).Finally, much could be done to improve sanitation in poorercountries, including improvements in sewerage. In addition, thismeans educating people to use soap and other cleansing agents.Such education could in principle be provided by the private sector– for example, by companies who have a material interest in sellingsoap – but this is often inhibited by a political environment hostileto commercial enterprise.Acute lower respiratory infectionsAnother major contributor to premature deaths in lower-incomecountries is acute lower respiratory infections (ALRI). One of theleading causes of such infections is inhalation of smoke from dirtyenergy sources such as wood, dung and crop residues burnt inpoorly ventilated dwellings. Exposure to such smoke increases therisk of ALRI (such as pneumonia), especially in children and women.
198 Fighting the Diseases of PovertyThis problem afflicts up to half of the world’s population, almostentirely in the poorest countries. Globally, ALRI represent the singlemost important cause of death in children under five years of age,and contributes to approximately two million deaths annually inthis age group (Bruce et al., 2002).Thus, if the poor were able to use more efficient, cleaner formsof energy, the positive impact (in terms of reducing the globaldisease burden) would be immense. Unfortunately, governmentstend to restrict the ability of people to use cleaner fuels and technologiessuch as electricity, liquefied petroleum gas (LPG) or evenkerosene. The impact of these restrictions falls primarily affectspoorer households, who must then resort to burning wood, lowgradecoal, crop residues and animal dung, which in turn exacerbatesboth indoor and local air pollution.In India, for instance, the country’s 2001 census revealed thatless than 44 per cent of households have an electricity connection(Goswami, 2004). Because the national and state governments haveintervened extensively in the supply of electricity, the country hasan artificial shortage – so merely possessing an electricity connectiondoes not mean that a household actually receives electricity.Policies of the Indian government have also contributed heavilyto a shortage of petroleum-based fuels in the country, which particularlyaffects the rural poor. Kerosene is subject to governmentrationing. Only two government-run companies in India supplyLPG – thus, these companies are not competing in a dynamic, competitivemarket. Although LPG production is in principle subsidisedby the state, it is unclear whether these subsidies are passed on toconsumers (in the form of lower costs) or whether the companiesinflate their production costs (thus absorbing the subsidy).Moreover, there is little if any distribution network for LPG – soprivate suppliers are unlikely to enter the market. This explainswhy rural access to LPG is extremely low; India’s 2001 censusrevealed that fewer than 10 per cent of rural households utilizeLPG (Goswami, 2004).These examples show why government policies towards can
Cost effective means of fighting the diseases of poverty 199have harmful side effects for health – contributing directly or indirectlyto the prevalence of ALRI in poor countries such as India.While prevention is almost certainly preferable to cure, there arealso many inexpensive medicines that can be used to treat pneumoniaand other ALRI. However, these often are not available.Diseases associated with malnutritionPoor nutrition contributes to 53 per cent of deaths associated withinfectious diseases among children under five years of age in lowerincomecountries (Black et al., 2003). Many cases of malnutritioncould be prevented if people were able to produce and distributefood more efficiently, yet in Africa especially this has been difficultbecause of weak property rights.In agrarian communities, strong property rights enable moreefficient farming practices. First, the ability freely to buy and sellland means farmers are better able to achieve economies of scale.Second, clearly defined property rights enable land owners to accesslow-cost capital, in the form of mortgages, that otherwise wouldnot be available. Such loans enable people to invest in more capitalintensiveforms of production, both on farm and off. The result ishigher yields, greater investment – and profit from – non-farmforms of economic activity, and generally an increase in wealth.In addition to improving the efficiency of agricultural production,many technologies exist that could help improve this situation.One such technology – biofortification – entails breeding specifictraits into a plant such that it produces and contains essentialmicronutrients that can be utilized by the human body.One example of biofortification is Golden Rice, which was developedas a humanitarian project to address Vitamin A deficiency. Thisdeficiency kills at least 6,000 children every day and leads to irreversibleblindness in 500,000 children each year (WHO, 1995). Traditionalinterventions such as the distribution of vitamin A capsules bythe WHO are helpful but have not substantially reduced these figures.In 1999, a 15-year project culminated when two teams of
200 Fighting the Diseases of PovertyEuropean scientists successfully modified the starchy tissue of rice(the part consumed by humans) to produce pro-Vitamin A (thechemical that is converted into Vitamin A in the body).However, activists who are opposed to GM foods more generallyobjected that the fortified rice, when eaten in normal quantities,would not provide a poor person with the necessary levels of dietaryVitamin A. However, a new strain of the rice (Golden Rice II) hasbeen developed that would provide 23 times more pro-Vitamin Acompared to Golden Rice I, effectively solving this problem (Paine etal., 2005).Since 1999, the inventors of Golden Rice have sought to transferthe benefits from this technology to the poor in lower-income countries– e.g. the people for whom it was intended. Governments andcharities were able to finance the entire project research, but notthe subsequent development and regulatory stages. Attempts totake Golden Rice to its next phase, with field trials and tests fornutritional compatibility in individual countries, have beenthwarted by an overly precautionary approach by regulators, fuelledby the sentiments and actions of activists. The same fate befallsmany other genetically modified crops (Paarlberg, 2006).The field trials have been delayed because opponents of GoldenRice insist that the plants must pose no risk to the environment.For humanitarian projects, such barriers create unnecessaryexpense and delay. This is not to suggest that Golden Rice shouldbe exempted from normal regulatory procedures. The problem isthat regulators have focussed on hypothetical and mostly nonexistentrisks rather than reasonably assessing the actual risksalongside the real benefits, in particular, the potential to immediatelyreduce Vitamin A deficiency and thereby save human lives. Asa result, researchers will be less inclined to use biofortification tosolve other micronutrient problems – such as iron, protein and zincdeficiency.
Cost effective means of fighting the diseases of poverty 201ConclusionIn tackling diseases of poverty such as malaria and HIV/AIDS, globalpublic authorities such as the WHO have a track record of prioritisinggrandiose but unachievable schemes over more practicalapproaches. Billions of dollars have been spent in recent decades,with little discernible impact on mortality rates.In the con<strong>text</strong> of HIV/AIDS, intervention by the WHO seems tohave exacerbated the problem by neglecting prevention in its aspirationto achieve ‘treatment for all,’ with the result that new infectionsare soaring.In the con<strong>text</strong> of malaria, public health experts have long advocatedindoor residual spraying with insecticides such as DDT, yet theWHO and aid agencies have until recently provided little practicalsupport for those nations wishing to adopt this practice. The failureto date of the WHO’s Roll Back Malaria programme also reveals thelimitations of the argument that intellectual property rights arestanding in the way of improving human health. The price ofpatented drugs has little (if anything) to do with the failure of publichealth agencies to reduce the impact of the disease. RBM failedbecause WHO was responsive to special interest groups whoseconcerns seemingly had no relationship to actions which wouldactually improve the lives of the poor.The burden of both HIV/AIDS and malaria could be significantlyreduced with sensible prevention strategies and careful treatmentprogrammes. While new medicines for these diseases would obviouslybe beneficial, in order to address the inevitable developmentof resistance to available treatments, we must recognise that effectivedistribution of those treatments will be practically impossibleuntil the physical and human aspects of health infrastructures areimproved.The cases of ALRI and diarrhoea reinforce the fact that there isa need for greater focus and more appropriate strategies intackling all the diseases of poverty. Policies pursued by intergovernmentalagencies, national governments, and humanitariancharities would benefit from an improved understanding of the
202 Fighting the Diseases of Povertyroot causes of extreme poverty and ill health. In this regard, agrowing body of literature implicates corruption, weak or nonexistentrule of law and limits on economic freedom (see e.g.Greenspan, 2003; Gwartney & Lawson, 2004; Kasper, 2006). Thereform of governance structures must therefore be a priority; thatmeans strengthening property rights, liberating markets andentrenching the rule of law.Admittedly, the reform of governance in sovereign states isoutside the bounds of WHO policy. But the fact that so many Africangovernments are corrupt and ineffective does not excuse the WHOfrom promulgating the disastrous strategies it has followed. Indeed,the very fact that health infrastructure is so weak in the world’spoorest countries makes many of these strategies all the moreabsurd.
7 Counterfeit medicines inLDCs: problems andsolutionsJulian Morris and Philip StevensMuch of the debate surrounding counterfeit medicines to date hasfocused on how to prevent them seeping into the supply chains ofdeveloped-country markets. The majority of counterfeit medicinesoriginate in Less Developed Countries (LDCs), including most ofthose that end up in the US and EU. Steps should be taken to changethe incentives faced by counterfeiters in LDCs participating in theproduction and trade of counterfeit pharmaceuticals.The scale of the problemWhile counterfeit medicines in wealthy markets are a growingconcern for physicians and law-enforcement agencies, their prevalencepales in comparison to their penetration of less developedmarkets. According to the World Health Organisation (WHO), 25 percent of all medicines in LDCs are counterfeit. 1 In some countries, theprevalence is far higher:◆◆◆Counterfeit medicines constitute between 40 and 50 per cent oftotal supply in Nigeria and Pakistan. 2In China, authorities have found that some products have acounterfeit prevalence ranging between 50 and 85 per cent. 336.5 per cent of antibiotics and anti-malarials on WHOessential drugs list in Thailand and Nigeria are substandard(Shakoor et al., 1997).
204 Fighting the Diseases of Poverty◆A recent survey by the WHO of seven African countries foundthat between 20 and 90 per cent of all anti-malarials failedquality testing. These included chloroquine-based syrup andtablets, whose failure rate range from 23 to 38 per cent; andsulphadoxine / pyrimethamine tablets, up to 90 per cent ofwhich were found to be below standard (WHO, 2003).In spite of a lack of hard data (Cockburn et al., 2005), it is clearthat counterfeit medicines are not confined to a handful of therapeuticclasses. This is especially true in LDCs, where the range offakes on the markets encompasses treatments for a diverse range ofconditions and ailments. The top five counterfeited medicines in thePhilippines provide some illustration of this point:1. Antihypertensive drugs (Adalat Gits 30mg Tablet).2. Anti-asthma drugs (Ventolin Expectorant syrup).3. Analgesic medicines (Ponstan 500).4. Anti-diarrhoea (Diatabs Reformulated).5. Vitamins (Propan with Iron Capsule, Ceelin 100 mg/5 ml Syrup,Enervon C and Iberet 500). 4This list is certainly not exhaustive. Other favourites for counterfeitinginclude drugs for treating anaemia, HIV, schizophrenia, aswell as growth promotion hormone (used in the treatment of HIV).The problem also extends beyond fake pharmaceuticals to medicalconsumables such as non-sterile syringes and gauze and even substandardelectronic medical equipment.Where are counterfeit medicines being produced?A large proportion of the world’s counterfeit medicines originate inAsia. China in particular is a production centre, although precisedata about the scale and scope of the problem within this countryis neither widely available nor reliable. In 2001 it was reported thatChina had 500 illegal medicines factories 5 and while no newer data
Counterfeit medicines in LDCs: problems and solutions 205is available, it is safe to assume that number has since increased.Also in 2001, it was reported that Chinese authorities “closed 1,300factories while investigating 480,000 cases of counterfeit drugsworth $57 million.” 6 Most Chinese counterfeit medicines that findtheir way into foreign supply chains first pass through the ports ofHong Kong and Shenzhen.South East Asia more generally is a major source of counterfeitmedicines. According to the WHO, Cambodia had 2,800 illegalmedicine sellers and 1000 unregistered drugs on the market in 2003.The same report showed that Laos had about 2,100 illegal medicinessellers, while in Thailand, substandard medicines account forapproximately 8.5 per cent of the total market. 7One 2002 study by government officials showed that 9 per centof all drugs tested in India were substandard. 8 Some 15,000 genericsmanufacturers operate in India. 9 Although the majority are legitimate,a small minority are likely to be ‘fly by night’ operations thatdo not comply with proper standards. Most of the counterfeit medicinesin Nigeria originate in India, a fact that lead the Nigerianauthorities to threaten to ban the import of all drugs from India in2003 (Raufu, A., 2003). However, it should be noted that 70 per centof the Indian domestic market is supplied by around 20 companiesthat regularly pass inspections from visiting officials from Westerncountries. 10Counterfeit medicines also abound in Latin America, withinstances reported in Argentina, Brazil, Colombia, Venezuela,Mexico, Peru and Guatemala: Mexico is a major global source ofcounterfeit medicines, with the trade standing at an estimatedvalue of US$650mn per year – equal to around 10 per cent of totaldrug sales in the country. 11In Russia, it is estimated that counterfeits constitute betweenfive and ten per cent of the total market. 12 In 1999 alone, 1,500 lotsof Russian-made drugs failed to pass quality tests. 13
206 Fighting the Diseases of PovertyThe impact of counterfeit medicinesCounterfeit medicines can cause harms in various ways: thepresence of toxic chemicals frequently causes injury or death; inappropriatedelivery systems and/or inadequate amounts of activeingredient prevents the drugs from working effectively and, again,can lead to injury or death; more broadly under-dosing fosters resistanceto the active chemical. In the cases of HIV/AIDS and malaria,this latter aspect is particularly worrying.HarmfulCounterfeit medicines often contain agents that are injurious tohealth, as for example when 89 people in Haiti died after ingestingcough syrup manufactured with diethylene glycol (a chemicalcommonly used as anti-freeze). This particular product was madein China, transported through a Dutch company to Germany,before winding up on the Haitian market. A similar case occurredin Nigeria in 1995, resulting in the death of 109 children and againin Bangladesh (Hanif et al., 1995).The dangers of widespread counterfeiting were illustrated in1996 during a meningitis epidemic in Nigeria. Some 60,000 peoplewere inoculated with counterfeit vaccines, resulting in the deaths of2,500 people (Pecoul et al., 1999).More importantly, counterfeits medicines typically provide inadequatedoses of drugs, either because too little active ingredient isincluded in pills or because the delivery vehicle (including otherwise‘inactive’ ingredients) are inappropriate (for example, chemicals thatare not water-soluble). As a result, patients receive too littlemedicine and die or are far sicker would have been the case if theyhad received an adequate dose.It is estimated that in China between 200,000 to 300,000 peopledie each year due to counterfeit or substandard medicine. However,this “official” statistic may over- or under-state the true number ofcases. 14
Counterfeit medicines in LDCs: problems and solutions 207Drug resistancePerhaps one of the most worrying implications of the global boomin counterfeit medicines is the acceleration of new, drug resistantstrains of viruses, parasites and bacteria. If drugs contain too littleof the active ingredient, not all the disease agents are killed andresistant strains are able to multiply and spread.MalariaThis is already being observed in the treatment of malaria. Counterfeitersaround the world have cashed in on the massive demandfor the latest and most effective antimalarial drug, artemisinin. Afield survey conducted in 2004 showed that 53 per cent ofartemisinin-based antimalarials in a range of South East Asian countriescontained incorrect levels of active ingredient (Dondorp et al.,2004), which implies that swathes of patients are receiving theincorrect dose. The direct consequences are death and serious injuryresulting from improper treatment.In addition, malaria parasites exposed to inadequate (subtherapeutic)concentrations of artesunate may result in the multiplicationof parasites resistant to the drug (White, 1999). Even thoughArtemisinin has only been widely available since the late 1990s, scientistsare already reporting cases of resistance. According to DrDora Akunyili, the head of Nigeria’s national drug regulator, theracket in fake medicine is directly responsible for this resistance, andis a contributing factor to the doubling of malaria deaths over thelast 20 years. 15HIV AIDSHIV/AIDS treatment is also under threat from counterfeit medicines.The recent discovery of counterfeit antiretrovirals (stavudinelamivudine-nevirapineand lamivudine-zidovudine) in the Congo(Ahmad, 2004) raises the prospect that the first line therapies fortreatment of HIV/AIDS could soon be rendered useless. With fewnew research leads in the pipeline, this could have grave implicationsfor the people of sub-Saharan Africa.
208 Fighting the Diseases of PovertyBird fluFinally, counterfeit medicines could be undermining our ability tocontain and treat a potential avian flu pandemic. As demand hasgrown for the anti-viral drug Tamiflu, one of the best current treatmentsfor the disease, counterfeiters have ramped up production ofillegitimate versions. Already, the Internet is awash with spuriousTamiflu, while consignments have been discovered as far apart asNew York and Beijing. The risk is that copies containing sub-therapeuticlevels of active ingredient could facilitate the development ofdrug resistant forms of the avian flu virus, leaving very few tools tocontain a potential pandemic.Undermining R&DCounterfeiting can also undermine the incentives of R&D basedcompanies to invest in future innovation. Even near-perfect copiesof on-patent medicines cause harm by competing with legitimatesupplies of medicines from originating companies, which reducesrevenues and undermines incentives to invest in future R&D.Underlying causes of LDC counterfeiting◆◆Absent or defective IP protection. One way to prevent the sale ofunauthorised copies of medicines is to enable companies toregister and enforce trademarks. These enable vendors tosignal the quality of their product to potential purchasers.Trademark owners have strong incentives to ensure that thequality of their product is maintained because their reputationand hence future profitability depend upon it.In many LDCs, itis difficult to enforce trademarks – even for local companies.Where trademarks cannot be enforced, cheaply produced poorquality copies will typically crowd out good quality drugs.Lack of adequate civil liability. Civil law protects the consumeragainst mis-sold or defective goods. By enabling consumers (ortheir relatives) to obtain redress from the manufacturer orsupplier of a harmful product, such liability both compensates
Counterfeit medicines in LDCs: problems and solutions 209◆◆◆those who are harmed and discourages manufacturers andsuppliers from selling counterfeits. In many LDCs, however,civil law is either poorly defined or difficult to enforce.Inability to resolve disputes over property rights and contracts inindependent courts. Underlying the lack of civil liability andweak IP protection are costly and inefficient legal systems Asa result, it can often take years for cases to be heard. Manycourts in LDCs are hampered by a lack of basic things suchas reliable electricity and inefficient processes, causingdelays.In many LDCs, law enforcement is also corrupt. In suchplaces, criminal counterfeiting gangs may be able to paycorrupt law enforcement agents to turn a blind eye to theiractivities. If a case does make it to court, the gangs may be ableto pay off the judge and thereby induce a favourablejudgement.Weak or absent rule of law: In LDCs with a weak rule of law,political and legal decisions tend to be arbitrary and designedto benefit the elite. As a result, regulation designed to combatcounterfeiting is often ineffective. Corruption within regulatoryagencies and police forces exacerbates this problem, so that theenforcement of regulations is seen as an opportunity to collectbribes.Price controls. The imposition of price controls by governmentsprevents companies from selling goods at different prices todifferent consumers. Also, where prices are controlled atdifferent levels in different markets, traders exploit these pricedifferentials through arbitrage. Such trade (called paralleltrade) may create gaps in the supply chain which can beexploited by counterfeiters. For example, it is often necessaryto repackage drugs in order to sell them in a different market,which requires that the packages will require relabelling in thecorrect language. This creates opportunities for unscrupulousintermediaries to infiltrate the supply chain with fakes. Pricecontrols in wealthy country markets therefore increases the
210 Fighting the Diseases of PovertyDuties and taxes on retail medicinesCountry Combined total duties and taxesIndia 55%Sierra Leone 40%Nigeria 34%Pakistan 33%Bolivia 32%Bangladesh 29%China 28%Jamaica 27%Morocco 25%Georgia 25%Mexico 24%Table adapted from European Commission, 2003◆chance that copies of patented medicines produced in LDCs willleak back into wealthy country markets.In addition, companies have less incentive to registerproducts in markets where their drugs are subject to pricecontrols, leading to shortages in supplies. They also reduce themargins made by pharmacies, making the distribution of drugsto remote and rural regions financially unviable. For example,the price caps forced on certain drugs in South Africa havebeen implicated in the closure of 103 pharmacies. 16 If marketsare left unsupplied in this way, it presents a clear incentive forcounterfeiters to fill in the unmet demand.Taxes and tariffs. LDC governments also stimulate demand forcheaper fakes by artificially driving up the price of legitimatedrugs through taxes and tariffs, which can inflate the retailprice of drugs by up to 50 per cent (see table below). Many ofthe high tariff countries also have a significant indigenouscounterfeit medicine industry and / or problem. It is unlikelythat this is entirely coincidental.
Counterfeit medicines in LDCs: problems and solutions 211What can be done in Less Developed Countries?In order to contain the global counterfeiting scourge, it is necessaryto address those dynamics which encourage the manufacture andsupply of counterfeit medicines. Since the majority of these drugsoriginate in LDCs, it should be a matter of priority to address thoselacunae of governance which allow LDC counterfeiters to ply theirtrade with relative impunity.Most importantly, it is essential that contracts, property rightsand the rule of law be upheld in the countries in which themajority of these drugs are produced. When properly upheld, theseformal market institutions enable entrepreneurs to participatefreely in the market, leading to economic growth and technologicaldevelopment. When these institutions are not upheld, as is thecase in most lower-income countries, people are forced into theinformal economy as a way of side-stepping the cost and difficultyof conducting business formally. And when the majority of the populationsubsist within the informal economy, they are unable toavail themselves of the protection that would otherwise exist fromcontracts or the implied reputation of trademark-protectedproducts.Some concrete steps to overcome these problems in LDCs includethe following:◆◆◆◆◆◆Adjudication of disputes over contracts should be simpler andcheaper, so that contracts may be more readily enforced.Bureaucratic restrictions on doing business should be removed.The manufacturers of brand goods should be able moreeffectively to protect their trademarks.Most fundamentally, courts of law should be granted greaterindependence, so that their rulings are more impartial and lessinfluenced by powerful vested interests.The legislature should not have the power to interfere withjudicial decisions.The power of law enforcement agents should be curtailed andtheir actions subject to judicial review.
212 Fighting the Diseases of Poverty◆◆◆The actions of other government agents (e.g. regulators) shouldbe subject to judicial review.Regulation restricting the supply of medicines should beimproved or scrapped. 17Governments should reduce taxes and tariffs on allmedicines. 18What can be done? <strong>International</strong>lyTRIPsAt the international level, the agreement on trade related aspects ofintellectual property rights (TRIPs), which is part of the WTO Agreementsof 1994 and is mandatory for all World Trade Organisationmembers, requires that the trademark laws of member jurisdictionsare compatible with each other, a quality which is known as ‘harmonisation.’LDCs that are members of the WTO should thereforehave TRIPs-compliant trademark recognition.However, the only way for aggrieved countries to enforcebreaches of the TRIPs agreement is through trade sanctions. This isoften not a particularly desirable option, for several reasons. First,trade sanctions hurt both parties – people in the offending countrywill lose much-needed export revenue and associated employmentopportunities, while people the aggrieved country will lose theeconomic benefits of importing goods from a country that has acomparative advantage in production. To the extent that employmentfalls in the offending country, more people may end up with asmaller disposable income and thereby more likely to purchasecheaper counterfeit medicines.Secondly, the enforcement of TRIPs can, in certain cases, underminepopular support for intellectual property protection, makingfuture enforcement more difficult politically. For example, in 2001the research-based pharmaceutical companies sought to challengein the courts a South African law that seemingly contravened TRIPS.In response to a very vocal campaign by AIDS activists, the pharmaceuticalcompanies withdrew their case. While the dispute was
Counterfeit medicines in LDCs: problems and solutions 213not brought in the WTO, the negative PR given to it created a persistentfear of the possible fall-out from bringing such a WTOdispute.Bilateral trade agreementsAn alternative way of persuading LDCs to institute intellectualproperty regimes is through tempting them with bilateral andregional free trade agreements (FTAs). Most FTAs involving theUnited States contain provisions that require signatory countries tobolster their intellectual property regimes. By promising access tolarge and lucrative markets, these agreements can be a way of persuadingLDCs to respect the fundamentals of intellectual propertyprotection, which is a vital step for curtailing counterfeiting.Although these agreements are not as beneficial as unconditionalfree trade, they are a step in the right direction, freeing up trade andthereby improving economic well-being. However, they do raisecomplications in the form of ‘rules of origin’ issues, which are costlyto monitor and administer. Furthermore, an overly-complex ‘rules oforigin’ system may lead to the development of illicit trade routeswhich could be exploited by traders in illegitimate goods such ascounterfeit medicines.ConclusionThe counterfeiting of drugs is a global problem which will not beeliminated until the supply-side issues are addressed. The majorityof counterfeit drugs are manufactured in LDCs, so reform in thesecountries is absolutely vital if progress is to be made. The mostpressing area for reform in the majority of LDCs is the application ofthe rule of law, the definition and enforceability of property rightsand the enforceability of contracts. Without such reforms, counterfeiterswill continue to kill hundreds of thousands of people everyyear.
8 The value of vaccinationDavid E. Bloom, David Canning, and Mark Weston 1IntroductionYou let a doctor take a dainty, helpless baby, and put that stufffrom a cow, which has been scratched and had dirt rubbed intoher wound, into that child. Even, the Jennerians now admit thatinfant vaccination spreads disease among children. More mitesdie from vaccination than from the disease they are supposed tobe inoculated against. (George Bernard Shaw, 1929)The world has come a long way since George Bernard Shaw fulminatedagainst vaccination in the 1920s. Vaccines are now widelyregarded as an effective and cheap tool for improving health.Children in all countries are routinely immunized against majordiseases, and the practice has become a central plank of globalpublic health efforts.Despite these advances, however, immunization coverageremains far from universal, and the developing world in particularremains vulnerable to vaccine-preventable illnesses. For example,global coverage for DTP – the vaccine for diphtheria, tetanus, andpertussis (whooping cough) – had reached 70 per cent in the 1990s,but in Sub-Saharan Africa it stood at just 53 per cent. In Somalia,Nigeria, and Congo, moreover, coverage halved between 1990 and2000 (WHO, 2002). Vaccination against measles also falls short; thedisease caused 660,000 deaths in 2002 (WHO, 2004) In all, 3 millionpeople die each year from vaccine-preventable diseases (Centre forGlobal Development, 2005).
The value of vaccination 215In the developed world, too, vaccination efforts face obstacles.The rise of a well-organized anti-vaccine movement has persuadedsome parents not to immunize their children. Vaccines, the campaignersclaim, cause more harm than good: in societies wherevaccine-preventable disease prevalence is minimal (ironically as aresult of past immunization efforts, although this is rarely acknowledgedby campaigners), the side effects of vaccines pose a greaterhealth threat than the diseases themselves. Why, they ask, shouldeveryone be vaccinated in order to protect the relatively smallnumber of people that might contract the disease in the absence ofmass immunization?It is not just populist activists who overlook the positive effectsof vaccination. More scientific estimates of the effects of vaccinesalso tend to underplay the benefits, disregarding the broadeconomic impacts of immunization in favor of a predominant andnarrow focus on the averted costs of medical treatment and healthcare. With other human capital investments, such as education,economic analysis of the impacts focuses on the effect on earnings.This has not occurred, however, with vaccination, and until recentlyit did not occur for health in general. Public health specialists generallyperceive vaccination as a hugely beneficial investment as it isboth cheap and very effective at a population level (the influential1993 World Development Report, ‘Investing in Health’, listed theWorld Health Organization’s Expanded Program on Immunizationas the first component of “the essential public healthpackage”(World Bank, 1993)). Because of the narrow view of itsimpacts taken by the rest of the policy-making community, however,policy emphasis on vaccination is weaker than it might be if the fullrange of benefits were taken into account.Health economists have long used two well-established tools toevaluate health interventions in economic terms. Both types ofanalysis are widely used and appropriately respected. Cost-effectivenessanalysis (CEA) seeks to determine the cost of an intervention(e.g., vaccination) in relationship to a particular outcome. Howmuch does it cost to save a certain number of lives, or to avert a
216 Fighting the Diseases of Povertycertain number of illnesses, for example? Averted medical costs (atleast those that would be incurred in the short run in the absenceof vaccination) are also typically taken into account. Cost-benefitanalysis (CBA), by contrast, makes a direct comparison betweencosts and benefits by monetizing the value of the latter. This techniquefacilitates comparison of two or more interventions, particularlywhen there is a range of discrete outcomes.There are several problems with both types of analysis, as theyhave been used to date. First, neither type typically takes account ofthe cost of averted infections that may occur years later. This isunderstandable, since such infections are hard to predict, but thatdoes not make future cost savings any less important.Second, both types of analysis take a narrow view of the benefitsof vaccination that fails to take account of recent academic work onthe effects of health on incomes. The experience of developmentover the past half-century shows that good health fuels economicgrowth, just as bad health strangles it. Healthy children performbetter at school, and healthy adults are both more productive atwork and better able to tend to the health and education of theirchildren. Healthy families are also more likely to save for the future;since they tend to have fewer children, resources spent on them gofurther, thereby improving their life prospects. Finally, healthiersocieties may be a stronger magnet for foreign direct investmentand tourism than those where disease poses a constant threat.Third, neither type of analysis factors in the effects thatimproved health has on triggering lower fertility rates. The combinationof lowered mortality rates followed by lowered fertility ratesleads to a baby boom generation that, when it reaches working age,can help bring about a significant economic boom (as happened inEast Asia). In the case of vaccination, the consequent boost to healthcan catalyze a change in the age structure of the population (via thelowered fertility rates) that can lead to significant economicbenefits.Our research looks at all CEA and CBA studies listed in Pub. Med.for 2004 and 2005. The wide range of published results emphasizes
The value of vaccination 217the difficulties inherent in such work. However, since all of thesestudies fail to address the broader considerations described in thepreceding two paragraphs, they all either overstate the cost ofachieving a given beneficial outcome or underestimate the netbenefits. It is this insight that spurs the current work.With the spread of immunization having stalled in many parts ofthe world, a wider look at its benefits is timely. In this paper, wediscuss the value of vaccination from a broad perspective. As well asthe health benefits, we examine the cost of vaccine programs andtheir economic impacts. Vaccination has proved a cost-effective andremarkably efficient way of improving health, and has savedmillions of lives. It has the potential, however, to be more effectivestill, and renewed efforts are needed if the momentum is to beregained.Part 1 of the paper provides a brief summary of the history ofvaccination and its impacts on human health. Part 2 looks at thestate of play today and at the reasons why progress on vaccinedelivery and development has slowed, and part 3 outlines why rateof return analysis and calculations of economic impacts suggestpolicy makers should direct more resources toward vaccination. Part4, which reviews both cost-effectiveness analysis and cost-benefitanalysis, indicates that a broader view of the long-term benefits ofvaccination makes immunization programs much more worthwhile,in terms of their economic consequences, than has been thought inthe past. Part 5 details our study on immunization and cognitivedevelopment, which has, in turn, been linked to higher earnings.Part 6 estimates the rate of return to one of GAVI’s prospectiveinvestments, showing that this return is quite high.A glorious pastThe theory behind vaccination was brought to the West from Asia.The Chinese had observed that certain illnesses could only be contractedonce, so they experimented with giving healthy individualsdoses of diseases such as smallpox that would be too small to make
218 Fighting the Diseases of Povertythem ill but large enough to stimulate immunity. The process wasknown as variolation and, in the case of smallpox, usually involvedinjecting powder from smallpox scabs into the vein. Although someindividuals fell ill or died during the process, smallpox rates amongcommunities that had been variolated were significantly lower thanelsewhere.Variolation was introduced to Britain by Lady Mary WortleyMontagu, who had observed the process in Turkey, where herhusband was British ambassador, in the early 18th century. Severaldecades later, Edward Jenner, who had undergone variolation as achild, noticed that people who contracted cowpox after workingwith cows became immune to smallpox. To test this observation, heinjected a small child with cowpox. The child fell ill with cowpoxbut, when later injected with smallpox, did not contract the latterdisease. Jenner published his findings in 1798, and named theprocess ‘vaccination’, from the Latin word for cowpox (The HutchinsonEncyclopaedia, 1999).In 1890, Emil von Behring and Shibasaburo Kitasato gave substanceto Jenner’s observation when they discovered antibodies.Injecting a small amount of a disease organism into an uninfectedindividual, they found, stimulated the production of antibodies,which fought off the initial attack and thereby prepared the body tofend off infection later in life. At around this time, vaccines for rabies,cholera, typhoid, and the plague were developed, although it was notuntil after the World War II that vaccines became a widespread toolfor improving health. Today, 26 diseases are vaccine-preventable.Since World War II, vaccination has had a major impact on globalhealth, as the following list of successes shows:◆◆Smallpox, which had killed two million people per year untilthe late 1960s, was wiped out by 1979 after a massiveworldwide immunization campaign.The number of polio cases fell from over 300,000 per year inthe 1980s to just 2,000 in 2002 (Global Alliance for Vaccines andImmunization website, 2002).
The value of vaccination 219◆◆◆◆◆Two-thirds of developing countries have eradicated neonataltetanus (WHO, 2002)Since the launch of the World Health Organization’s ExpandedProgram on Immunization (EPI) in 1974, the number ofreported measles deaths has dropped from 6 million to lessthan 1 million per year.Whooping cough cases have fallen from 3 million per year toless than a quarter of a million.Diphtheria cases have declined from 80,000 in 1975 to less than10,000 today (Birmingham & Stein, 2003).The haemophilus influenzae B (Hib) vaccine has reduced theincidence of Hib meningitis in Europe by 90 per cent in tenyears (Ehreth, 2003).The EPI includes six vaccines, covering diphtheria, tetanus,whooping cough, measles, polio, and tuberculosis. Before 1974, only5 per cent of children were vaccinated against these diseases. Todayover 70 per cent are vaccinated (WHO, 2002). The program hasreduced the share of the six diseases it tackles in the total burden ofdisease in young children from 23 per cent to less than 10 per centsince the mid-1970s (WHO, 2001). It has been estimated that declinesin diphtheria, measles, and whooping cough have averted well overa million deaths in developing countries (Birmingham & Stein, 2003).In 2000, in an effort to maintain the EPI momentum, the GlobalAlliance for Vaccines and Immunization was launched. GAVI comprisesUnited Nations agencies, governments, donors, foundations,private companies, and academic institutions. It has six core strategicobjectives: GAVI◆◆◆Improve access to sustainable immunization servicesExpand the use of all existing safe and cost-effective vaccines,and promote delivery of other appropriate interventions atimmunization contactssupport the national and international accelerated diseasecontrol targets for vaccine-preventable diseases
220 Fighting the Diseases of Poverty◆◆◆Accelerate the development and introduction of new vaccinesand technologiesAccelerate research and development efforts for vaccinesneeded primarily in developing countriesMake immunization coverage a centerpiece in internationaldevelopment effortsAs we will see part 2 of the paper, such an initiative is urgentlyneeded.A difficult presentLost momentumThe rapid progress towards universal vaccination coverage in the1970s and 1980s has slowed in recent years.Decliningfundingforimmunizationhasbeenmirroredinstagnatingor falling coverage. UNICEF funding for vaccination fell from $182million to $51.4 million between 1990 and 1998 (Gauri, 2002). Globalcoverage of the diphtheria, tetanus, and pertussis (DTP3) vaccine hasstalledataround74percentsince1990(GAVI,2003).Fifty-sevendevelopingcountries have yet to eliminate neonatal tetanus, and 200,000babies died of the disease in 2000 (WHO, 2002). Yellow fever has madea comeback, despite the availability of an effective vaccine; thenumber of outbreaks increased sharply after governments curtailedprograms in the belief they had vanquished the disease (GAVI, 2001).Developing countries lag behind the West in terms of vaccinationcoverage. Measles immunization rates are over 90 per cent inEurope but below 70 per cent in South Asia and below 60 per centin Sub-Saharan Africa (see figure 1) (World Bank, 2004). Ten developingcountries reported cases of polio in June 2005, despite themassive (and largely successful) global effort to eradicate the virus(WHO, 2005). Sixty-two per cent of countries, meanwhile, had stillnot achieved full routine immunization coverage in 2003, with GAVIestimating that at least 9.2 million additional infants need to bereached to achieve full coverage (GAVI, 2003).
The value of vaccination 221Figure 1 Disparities in immunization rates% of children (12–23 months) immunized10080Europe andCentral AsiaSouth AsiaSub-Saharan Africa6040200DPTMeaslesSource: World Bank, 2004There are several factors behind this loss of momentum. First,although dramatic progress has been made in increasing worldwidevaccination coverage from below 5 per cent to above 70 per cent,the task has inevitably become harder now that the easiest-to-reachpopulations have been vaccinated. Many of those whom campaignshave not yet reached are either living in inaccessible areas, out ofrange of clinics and health services, or reluctant to be vaccinated orto vaccinate their children. Because these communities are moreelusive, the average cost per vaccination has increased, and it maybe that other apparently cheaper health interventions have becomemore attractive.Second, there are many practical problems impeding vaccinedelivery. Delivering vaccines to patients requires functioningfreezers and refrigerators (which in turn require a constant supplyof energy); good roads and reliable transport to move the vaccinesfrom port to clinic; clinics with access to people who need to be
222 Fighting the Diseases of Povertyimmunized; parents who know the value of vaccination; trainedmedical staff to deliver the dose; and sterile syringes.Many of the poor countries where vaccine coverage has stalledlack all or part of this infrastructure. In Burkina Faso and Niger forexample, 23 per cent of refrigerators used for storing vaccines werefound to be non-functioning (GAVI, 2003). Only 16 per cent ofvaccine-importing countries could guarantee vaccine safety andquality, (WHO, 2002) while a further study of 19 developing countriesfound that at least half of injections were unsafe (WHO, 2002).The third factor behind the lack of progress in recent years ispolitical. Political disruptions have affected coverage in some areas.In Somalia and Congo, for example, where vaccination rates havefallen rapidly in the past decade, war and social breakdown haveimpeded public health campaigns, despite “vaccination days” inCongo that temporarily halted fighting. Gauri et al. have found thatthe quality of institutions and governance are positively correlatedwith vaccination coverage (Guari, et al. 2002). Immunization campaignsdo not operate in isolation – they are dependent on the prevailingpolitical and social environment. As that environment isaltered, immunization may be interrupted.Politics in the developed world have also played a part. Accordingto a report by the US Institute of Medicine, in 1982 the USvaccine industry was forced to stop offering low-price vaccines todeveloping countries following congressional hearings that“savaged” the industry for “allegedly subsidizing vaccines for thepoor children of the world by charging high costs to US families andtaxpayers” (Institute of Medicine, 1997). As the Institute of Medicinepoints out, this move was based on a flawed premise, as the USvaccines would have been developed anyway to protect Americanchildren and travelers.The fourth reason for the lost momentum relates to public perceptionsof vaccination. As coverage spreads through a community,it reaches a point at which those who are unvaccinated are highlyunlikely to catch a disease because herd immunity has set in. Atthis juncture, it may be more rational for an individual to refuse
The value of vaccination 223vaccination in order to avoid any risk of side effects. With oral poliovaccine, for example, there is a 1 in 1 million chance of paralysis,and in societies where mass vaccination has eliminated the disease,the risk of paralysis is greater than that of catching polio itself.What had once been a public and private good is now a public goodbut a private risk. As more and more people choose to avoid thisrisk, of course, overall coverage rates decline, and the community isonce again exposed to the threat of the disease.Public perceptions have been influenced by vaccine scares. Controversyand the attendant bad publicity about the safety ofvaccines has been abetted by incidents such as the withdrawal ofhalf the US supply of flu vaccines in 2004 due to contamination atthe manufacturer, Chiron’s UK plant (Los Angeles Times, 2005) andby the swine flu vaccine, which led to deaths of some of thoseimmunized (while the flu itself did not arrive).In addition, alarms over the safety of vaccines such as that formeasles, mumps and rubella (MMR), which some believe to causeautism, have further fanned the anti-vaccine movement’s flames. Inthe United States, disputes continue to rage about the scientificbasis of such claims, but the preponderance of the evidence, accordingto the US Centers for Disease Control, says that the MMR vaccineis safe (Kennedy, 2005). In the UK, physician Andrew Wakefieldcaused alarm over the MMR vaccine for the same reason. Rates ofMMR coverage dropped in Britain and elsewhere in the wake of thisscare, before Wakefield’s case was to a large extent discredited andthe journal that had published his research, The Lancet, partiallyretracted the study.A survey of public reactions to Wakefield’s findings showed that53 per cent of people believed that, because media coverage gaveroughly equal space to support and rejection of the autism theory,the scientific evidence base must be similarly balanced (Hargreaveset al., 2003). Only 25 per cent, moreover, were aware that no linkbetween MMR and autism had been found in the overwhelmingmajority of studies (Lewis & Speers 2003). A similar scare occurredover the hepatitis B vaccine, which in the mid-1990s was briefly
224 Fighting the Diseases of Povertybelieved to cause multiple sclerosis in some who received it. Subsequentcohort and case-control studies found no link between thetwo (Halsey 2003).Vaccine scares do not always lack foundation. The Rotashieldvaccine for rotavirus, which was approved in the US in 1998, waswithdrawn a year later after reports were received of acute intussusception(a potentially serious bowel condition) occurring shortlyafter delivery of the vaccine. A study later confirmed this relationship– between 1 in 5,000 and 1 in 10,000 infants developed intussusceptionwithin two weeks of vaccination (Mulholland & Bjorvatn,2003). Such events, as well as causing enormous financial losses tothe company that developed the vaccine, can have negative effectson public trust in immunization. They also increase pressure on governmentsto tighten regulation of vaccines, thereby making theirproduction even more costly. 2In response to these types of controversies in the United States,the Institute of Medicine has called for independent oversight ofvaccine safety studies to ensure the fairness and openness of theVaccine Safety Datalink program, which is overseen by the CDC. 3Imperiled innovationAs well as vaccine coverage, development of new vaccines has alsostalled in recent years. The number of major western pharmaceuticalcompanies making vaccines fell from 26 in 1967 to five today,although some of the slack has been taken up by developingcountrymanufacturers (Washington Times, 2005). As profit marginsfor rich-world vaccines have outpaced those for vaccines needed bypoor countries, drug developers have concentrated ever more ondiseases of the developed world.The profitability deficit for developing-world vaccines is huge.The developing-world vaccine market is estimated at just 10–15 percent of the world total and less than 0.2 per cent of the entire globalpharmaceutical market (Siwolop, 2001). The total volume of allvaccine doses acquired by UNICEF and the Pan American HealthOrganization (PAHO) for distribution in the developing world,
The value of vaccination 225moreover, is 100 times greater than the number of doses of Prevnar(a vaccine for diseases caused by streptococcus pneumoniae) deliveredin the US, but brings in less than half the revenue.Rich and poor countries have different immunization needs.Parents in rich and poor countries alike are concerned with thesafety of vaccine delivery; but governments in poor countries areconcerned with its cost, too. Products have therefore begun todiverge, even when they tackle the same illness, and the newvaccines that respond to developed-world demands are often tooexpensive for poor countries. In the 1990s, for example, developedcountries began to use the DTaP instead of DTwP vaccine. DTaP(which incorporates an acellular pertussis vaccine) is more expensiveand no more effective than DTwP (which contains a whole-cellpertussis vaccine), but it has fewer side effects and has thereforeproved more popular with developed-world consumers. Similarly,the oral polio vaccine has been replaced in countries such as the USby inactivated polio vaccine (IPV), which is delivered by injection.Unlike OPV, the IPV vaccine cannot cause paralysis (Batson et al.,2003).Pharmaceutical companies have found it difficult to persuadeshareholders of the value of continuing to develop vaccines for poorcountries. The pharmaceutical giant Glaxo SmithKline, for example,reported in 2001 that it was planning to allocate its freeze-dryingcapacity to haemophilus influenzae B (Hib) vaccine rather than theless profitable meningitis A/C vaccine. Doses of the DTwP vaccineoffered to UNICEF, moreover, declined from 600 million in 1998 to150 million two years later (GAVI, 2001).Intellectual property rights present a further challenge tovaccine development. Unlike many other drugs, people generallyneed only one dose of a vaccine or vaccine booster. Manufacturerstherefore need to gain a return on their investment from a singleuse, rather than over a full course of treatment as in the case ofantibiotics or over a patient’s entire lifetime as in the case of antiretroviraldrugs for AIDS. Companies are thus particularly zealousabout protecting vaccine patents – monopoly over production of a
226 Fighting the Diseases of Povertyvaccine is, they believe, the best way to profit from it. Generic drugproducers in poor countries, however, threaten these patents andincrease the risk that vaccine developers will not gain a satisfactoryreturn on their investment. Compulsory drug licensing, moreover,which some countries have introduced for antiretroviral treatmentfor AIDS, may deter future investment in drugs for the developingworld. If pharmaceutical companies cannot guarantee a return ontheir research and development costs through the end of the patentperiod, the attraction of vaccines for developing countries mayweaken further.There is a lively and important debate regarding the costs of drugdevelopment and how they should be assessed. The pharmaceuticalindustry has long claimed that the enormous costs of developmentare only sustainable by the prices charged for the subset of drugsthat are finally approved. Critics have argued that the developmentcosts are overstated, with Relman and Angell (Relman & Angell,2002) pointedly stating that “… research and development (R&D)constitutes a relatively small part of the budgets of the large drugcompanies. Their marketing and advertising expenditures are muchgreater than their investment in R&D.” In addition, they argue thatthe pharmaceutical companies are not as innovative as generallyassumed – and that much of the spending on truly new drugs istaxpayer-supported. DiMasi et al. respond to some of the drugindustry’s critics, (DiMasi et al., 2004) carefully critiquing theirmethodology, and offer new estimates of drug development costs(Di Masi et al., 2003). (Relman and Angell also critique DiMasi et al.)As Relman and Angel note, not all investment in vaccines comesfrom the private sector. Government research agencies andacademic institutions are responsible for much investment in basicscientific research. A widely promoted means of filling the gapbetween the needs of developing countries and the demands ofpharmaceutical firms’ shareholders is for public organizations tostep in and guarantee a market for vaccines once private companieshave developed them. GAVI is currently coordinating this effortinternationally but, as the downfall of an earlier initiative shows,
The value of vaccination 227encouraging diverse organizations to work together to achieve acommon goal is a task riven with complexities.William Muraskin has detailed the demise of the Children’sVaccine Initiative (CVI), which was launched by the World HealthOrganization in 1990 in response to the slowdown in developmentof new vaccines and poor distribution of existing ones (Muraskin,1998). The CVI’s efforts to bring together public and private sectorscientists and organizations to work towards solutions were unsuccessful.As Muraskin explains, there was a “great gulf of distrust,often bordering on contempt,” between public and private sectors.Public sector scientists saw their private sector counterparts asbeing purely driven by profit, while the latter saw the public sectoras a wasteful and untrustworthy partner. The WHO closed the CVIdown in 1999. Such experience reinvigorates the question of government’sresponsibility for ensuring the timely development andproduction of vaccines – both for old diseases and new. One alternativeis that governments themselves could create greater vaccinedevelopment and production capacities. Another option is for governmentsto offer major financial incentives to pharmaceutical corporationsin exchange for guaranteed increases in developmentefforts and actual construction of vaccine production facilities.Under this latter scenario, a government could promote competitionamong companies for contracts of this type. The case of avianflu, which could soon burst onto the world scene on a terrifyingscale, brings this discussion into sharp focus: governments mustassess whether they can rely on the private sector to take the initiativein guaranteeing public health when the steps needed tomake such guarantees currently look unprofitable.Developing and delivering vaccines, then, are by no meansstraightforwardtasks.Theprogressineliminatingsmallpoxanddrasticallyreducing cases of polio shows that with will and effort immunizationcampaigns can be successful, but the momentum for massimmunization has stalled in recent years. In the next section weexamine the case for a renewed global effort to extend vaccinationcoverage, focusing on the economic impacts of vaccine programs.
228 Fighting the Diseases of PovertyAn uncertain futureThe narrow perspectiveAssessment of the benefits of vaccines has traditionally focused ona specific range of health-related impacts. Cost-effectiveness andcost-benefit analyses of the numbers of averted illnesses, hospitalizationsand deaths; disability-adjusted life years (DALYs) gained;and medical costs avoided are the most common assessmentmethods. Cost-effectiveness analysis looks at the cost of a healthintervention per life saved (or per DALY gained, etc.); cost-benefitanalysis takes into account the value of each life saved or the extrayears of healthy life gained, and compares the total value of thosebenefits to the cost of the intervention.The World Health Organization, for example, has estimated thatpolio eradication will save governments $1.5 billion per year invaccine, treatment, and rehabilitation costs. The elimination ofsmallpox is thought to have saved $275 million per year in directhealth care costs (GAVI, 2003); Barrett estimates that the $100million invested in eradicating the disease in the ten years after1967 “saved the world about $1.35 billion a year” (Barrett, 2004).And the US Institute of Medicine reports that for every dollar spenton the MMR vaccine, $21 is saved (Institute of Medicine, 1997).Other cost-effectiveness studies have also found that vaccinationcampaigns lead to substantial savings in medical costs, 4 but a recentreview of 60 studies on the effectiveness, cost, and cost-effectivenessof immunization programs in developing countries concludedthat the literature base on cost-effectiveness was flimsy. Only threeof the studies addressed cost-effectiveness, and most studies wereriddled with weaknesses. Few provided confidence intervals fortheir findings, follow-up was limited, data sources were not clearlydefined, and there was little discussion of confounding variables.Studies on costs, moreover, found wide variations depending on thesetting in which a vaccine was being delivered, making estimates ofcost-effectiveness difficult to generalize (Pegurri et al., 2005).The available literature on DALYs suggests immunization is ahighly cost-effective intervention. The total cost of the EPI vaccine
The value of vaccination 229package is less than $1 (Gauri et al., 2002). According to GAVI, mostvaccination campaigns cost less than $50 per year of healthy lifegained. By contrast, treatment for diseases such as hypertension inthe US costs between $4,340 and $87,940 for each DALY gained(GAVI, 2003). Jamison et al. estimated that the EPI vaccine programcosts $14–20 per year of healthy life gained in low-income countries(Jamison et al., 1993). Miller and McCann show a similar cost for theHib vaccine in Africa, and that Hepatitis B immunization in lowincome,high-prevalence countries costs just $8–11 per DALY gained(Miller & McCann, 2000).Although cost-effectiveness provides a robust demonstration ofthe extent to which vaccines reduce medical costs, it does not takeaccount of the wider range of benefits that are covered by costbenefitanalysis. The latter also has the advantage of being comparablewith investments that take place outside the health sector.Many cost-benefit analyses of vaccination have shown positiveeffects. In South Africa, a study of the mass measles immunizationcampaign of 1996 and 1997 found a benefit-cost ratio of 2.27 in theprovince of Mpumalanga (Uzicanin et al., 2004). In Japan, thebenefit-cost ratio of subsidized influenza vaccinations for the elderlywas estimated at 22.9 (Ohkusa, 2005). Purdy et al. found that mostof the costs related to pertussis are due to lost productivity at workand that the benefit-cost ratio of the immunization of 10 to 19 yearolds is strongly positive (Purdy et al., 2004).Some studies, on the other hand, have shown higher costs thanbenefits. In the study of measles immunization in South Africa, thebenefit-cost ratio in the Western Cape province was 0.89 (Uzicanin,2004). And a study to assess the incorporation of the pneumoccocal7-valent conjugated vaccine into the routine immunization programin Spain found a benefit-cost ratio of only 0.59 (Navas et al., 2005).A wider viewNeither cost-effectiveness nor cost-benefit analysis has so fartaken full account of the broader economic impacts of immunization.These impacts stem from the fact that immunization
230 Fighting the Diseases of Povertyprotects individuals not only against getting an illness per se, butalso against the long-term effects of that illness on their physical,emotional, and cognitive development. For example, by stuntingphysical growth, childhood diseases can curtail opportunities forcarrying out manual labor during adulthood. In developing countries,where manual work is frequently the only option, physicalhandicaps are particularly damaging. Cognitive development mayalso be affected by vaccine-preventable disease. Measles, forexample, can cause brain damage or impair learning abilities, withsevere impacts on a child’s life prospects.The importance of these effects is borne out by recent workdemonstrating the link from improved health to economic growth.This research has made clear the importance of health interventionsfor achieving growth and suggests that cost-effectiveness analyses,as currently conducted, are likely to underestimate the benefits ofvaccination.There are several channels through which health improveswealth. The first is through its impact on education. Healthychildren are better able to attend school and to learn effectivelywhile in class. Studies have found that health interventions such asde-worming programs and iron supplementation reduce absenteeismfrom school (Miguel et al., 2004). Curing whipworm infection,meanwhile, has been found to lead to improved test scores(Nokes et al., 1992).The second channel is through health’s impact on productivity.Like schoolchildren, healthier workers have better attendance ratesand are more energetic and mentally robust. Workers in healthycommunities, moreover, need to take less time off to care for sick relatives.Body size, which is greatly influenced by one’s health duringchildhood, has been found to have large impacts on long-term productivity(Fogel, 1991). Bloom et al. have calculated that a one-yearincrease in life expectancy improves labor productivity by 4 per cent(Bloom et al., 1998).The third means by which health improves wealth is through itseffect on savings and investment. Healthier people expect to live
The value of vaccination 231longer, so they have a greater incentive to save for retirement. Theyare also able to work productively for longer, giving them more timeto save. Workers and entrepreneurs therefore have a larger capitalbase to draw on for investment, leading to greater job creation andhigher incomes. The savings booms in the East Asian “tiger”economies in the last quarter of the 20th century were largelydriven by rising life expectancy and greater savings for retirement.Finally, health can boost economies via a demographic dividend.The transition from high to low rates of mortality in many developingcountries has been rapid. Largely brought about by medical anddietary improvements, the transition has contributed to falls in fertilityas parents realize they need fewer children to attain their idealfamily size. The boom in young dependents that occurs when mortalityfalls is therefore followed by a decline in fertility. At this stage,parents can concentrate their resources in nurturing fewer children,thus increasing the latter’s prospects of receiving a good educationand effective health care. As the boom generation reaches workingage, and provided it encounters a policy environment that is favorableto job creation, it can give a large boost to an economy byswelling the ratio of workers to dependents. It has been estimatedthat the demographic dividend accounted for as much as one thirdof East Asia’s “economic miracle” (Bloom et al., 1998).A more thorough investigation of the impacts of vaccination,then, should look not just at direct medical cost savings and avertedillness, but also at the effects on cognitive development, educationalattainment, labor productivity, income, savings, investment, andfertility.The benefits of vaccination – new evidenceThe effect of GAVIWe have carried out calculations for two vaccination campaigns,taking into account the broader economic impacts of immunization.The first study assesses GAVI’s program to extend the use of the traditionalbasic childhood vaccination package; increase coverage ofthe underused Hib, hepatitis B, and yellow fever vaccines; and help
232 Fighting the Diseases of Povertyfinance the introduction of anticipated vaccines covering pneumococcaldisease, rotavirus, and meningococcal A/C conjugate. Thisprogram will operate in 75 low-income countries with a combinedpopulation of 3.8 billion from 2005–2020, and will cost $13 billion.We examine the likely effect of the program on worker productivityat the individual level. The second study covers efforts in the Philippinesto immunize children with DTP, TB, polio, and measlesvaccines. It measures vaccines’ effects on children’s cognitive development,an important determinant of adult earnings.The countries involved in the GAVI immunization program sufferfrom high rates of child mortality. In countries that are not coveredby the program, there are fewer than 10 child deaths per thousandlive births. In the GAVI countries, there are over 65 deaths perthousand. GAVI estimates that its program will reduce child mortalityby 4 deaths per thousand live births in 2005, rising to 12 perthousand by 2020 as the campaign expands.We used a life table to translate averted deaths into increasedprobability of adult survival (the proportion of 15 year olds whoreach age 60), and found that the GAVI program will increase theadult survival rate by 5 per 1,000 initially and by 16 per 1,000 by2020 (life expectancy will increase by half a year initially and by oneand a half years by the end of the program).To translate the latter into growth of wages and income percapita, we used estimates in the economics literature from Shastryand Weil (2003) and Weil (2005) (Shastry & Weil 2002) that show thelink between health and wages in individuals. 5 This analysis showsthat for a group of 1000 adults, for each additional person survivingfrom age 15 to 60, average wages rise by 0.179 per cent. Based onthe assumption that labor productivity and wages account for twothirdsof national income (Hall & Jones, 1999), we calculate that eachextra surviving adult in a group of 1000 boosts income per capita by0.119 per cent.From this figure, we calculate that the average percentageincrease in income for the children whose immunization coverageincreases through the GAVI program will rise from 0.78 per cent in
The value of vaccination 2332005 to 2.39 per cent by 2020. This equates to an increase in annualearnings per child of $14 by 2020 (see table 1). The total increase inincome per year once the vaccinated cohort of children start earningwill rise from $410 million in 2005 to $1.34 billion by 2020 (at a costof $638 million in 2005 and $748 million in 2020).We estimate the internal rate of return to the program by calculatingthe interest rate that would make the net present value of theflow of future benefits equal the initial costs. The rate of returnamounts to 12.4 per cent in 2005, rising to 18 per cent in 2020 asvaccine costs decline. These are conservative estimates, since theydo not take account of averted medical costs, the value of reducedpain and suffering among survivors, welfare benefits associatedwith averted deaths, or demographic dividend effects.If these additional benefits of vaccination had been included, itis likely that the rate of return would be higher still, and possiblymuch higher, but even these conservative estimates compare favorablywith the average rates of return to schooling. A review of 98country studies from 1960 to 1997 showed that the average returnsfor primary, secondary and higher education were 19 per cent, 13per cent and 11 per cent respectively (Psacharopoulos & Patrinos,2002). This finding suggests that the benefits of vaccination havebeen greatly underestimated and amounts to a strong argument forincreased immunization in developing countries.Immunization and cognitive development – evidence from thePhilippinesIn the Philippines study, we examined the effect of immunizationon productivity by looking at its impact on test scores that measurethe cognitive ability of ten year olds. There is robust evidence thatchildhood illness can impair cognitive development, and that thelatter affects adult productivity and earnings. Since our data coverchildren born in 1983–1984 and thus do not offer information onwages, we take scores in cognitive tests at the age of ten as an indicatorof likely productivity in adulthood.Our study involves a sample of 1975 children from the Cebu
234 Fighting the Diseases of PovertyLongitudinal Health and Nutrition Survey (CLHNS). CLHNS is part ofa longitudinal survey of Filipino women and their children born inthe year following 1 May 1983. The women lived in 33 districts ofthe metropolitan Cebu area. Bi-monthly interviews carried out overtwo years allow us to track immunization activities in the first twoyears of a child’s life, while a follow-up study conducted betweenOctober 1994 and October 1995 provides us with scores onlanguage, mathematics, and IQ tests.We compared the test score results of children who had receivedthe basic six vaccines (DTP, polio, measles, and TB) in the first twoyears of life with those who had had no vaccinations. It is importantto recognize, of course, that children who are immunized have otheradvantages that make them more likely to succeed in cognitivetests. For example, they may receive a better education or hail fromfamilies that place a great emphasis on health in general, meaningthey would score well whether or not they were immunized. Inorder to eliminate these effects, we used a propensity scorematching method that matches each child in the treatment groupwith a similar control group. We matched children on the probabilitythat they would be vaccinated given their characteristics – thatis, their “propensity scores”. Groups of children with a certainpropensity score were matched with control groups whose propensityscores are close to their own, with the closest-matched groupsgiven more weight (Canning & Seiguer, 2005).After controlling for these observed characteristics we foundthat immunization was associated with significantly improvedscores in IQ, language, and mathematics tests. The effect wasstronger (significant at the 5 per cent confidence level) for IQ andlanguage scores than for mathematics (where the effect was significantat the 10 per cent level). Childhood vaccination appears tohave positive and long-term health impacts that translate intoincreased cognitive ability in ten year olds, which in turn is associatedwith higher earnings in adulthood.In both our studies, then, we found significant positive impactsof vaccination programs. As well as improving health, vaccines have
The value of vaccination 235long-term effects on the development of an individual. These individualeffects, which are produced at a remarkably low cost, arelikely to translate into lasting impacts on economies.SummaryClearly there is scope for more research to be conducted on thediverse benefits of vaccination. The Miller and McCann study citedabove shows that rates of return differ by country and by incomegroup. It is likely they also differ by the type of vaccine delivered.Further research is needed to calculate the value of vaccination fordifferent countries and at different stages of development. However,immunization does appear to be an important tool for improvingsurvival and strengthening economies. By boosting cognitive abilities,it improves children’s prospects of success when reachingworking age. And it does so in an extremely cost-beneficial way.Immunization provides a large return on a small investment –higher than most other health interventions, and at least as high asnon-health development interventions such as education.There is a strong case, therefore, for a renewed internationalcommitment to vaccination. The impressive progress towards universalbasic vaccine coverage in the 1970s and 1980s has stalled inthe past decade, and several damaging childhood illnesses havebegun to return as a result. A revived commitment to vaccinationrequires action on several fronts. First, the public health establishmentmust communicate clearer and more compelling messagesabout the value of vaccination. The targets of such communicationshould include governments in developed and developing countries,as well as donors that fund vaccination in the latter. Second,these messages should move beyond explanation of the effect ofimmunization on health and on medical costs to address thebroader impacts on economies. Vaccination is not purely a healthsector issue – it has resonance for wider economic planning andfor long-term economic progress. Apprising finance ministries ofits importance is vital for cementing its position in developmentpolicy.
236 Fighting the Diseases of PovertyThe third area where renewed action is needed relates to leadership.At an international level, GAVI has begun to increase awarenessof the value of vaccination and to push multiple partnerstoward expanding its breadth and scope. At the national level, politicians’commitment is important in driving immunization campaignsforward. Traditionally, individuals have submitted to stateencouragement to vaccinate because they have trusted governmentto act in their best interests. Recent problems with vaccines, alongwith efforts (valid or not) of those who continue to argue thatvaccines are unsafe, are weakening this trust. Politicians are notelected on vaccination platforms, so there is no pressure on them tochampion vaccines once in power. However, the confusion causedby British Prime Minister Tony Blair’s refusal to reveal whether hisown son had received the MMR vaccine at the height of the MMRscare highlights the dangers of equivocal leadership on such sensitiveissues. Blair’s lack of clarity, which was the subject of extensivemedia coverage, may have increased uncertainty over the vaccine(Lewis & Speers 2003) Public complacency, as measles outbreaks thathave followed declines in vaccination coverage in the developedworld show, can quickly imperil health, and governments anddonors that recognize the benefits of immunization must continuallyhammer the point home.Traditionally, governments and donors have only considered thehealth impacts of vaccine-preventable illnesses, and their effect onoverall welfare has been underestimated. However, new evidenceon the importance of health as a driver of economic developmentand poverty reduction suggests the need for a re-think. Vaccines inparticular, as the evidence presented in this paper shows, are aninexpensive and extremely effective means of improving health andoverall welfare. Their impacts, moreover, are much greater than previouslythought.Making the push to complete worldwide vaccination coveragewill be a difficult task, and finding ways of ensuring the continueddevelopment of effective vaccines in the future potentially morecomplex still. Vaccines should be seen not as a cost that swells
The value of vaccination 237Table 1 Projected costs and economic benefits of the expanded GAVI immunization program2005 2006 2007 2008 2009 2010 2011 2012 2013 2014 2015 2016 2017 2018 2019 2020Total cost ($million)638 652 583 659 790 862 761 762 1,023 1,051 1,059 994 896 769 727 748Deaths averted732,673 855,998 923,529 993,2471,052,6961,125,2751,229,8831,349,5841,608,9991,741,2841,913,958 1,955,902 1,973,229 1,990,757 2,002,458 2,014,390$ cost per death averted871 761 632 663 750 766 619 565 636 604 553 508 454 386 363 371Reduction in under 5 mortality rate (per 1000)4.10 4.89 5.43 6.00 6.45 7.11 7.82 8.60 10.20 11.08 12.24 12.43 12.49 12.54 12.56 12.57Total increase in adult survival rate (per 1000)6.61 7.87 8.74 9.64 10.37 11.43 12.56 13.81 16.38 17.80 19.65 19.97 20.06 20.14 20.17 20.19Increase in life expectancy (years)0.58 0.69 0.77 0.85 0.91 1.00 1.10 1.21 1.44 1.56 1.73 1.76 1.76 1.77 1.77 1.78Average percentage increase in income for all children in that cohort0.78 0.93 1.03 1.14 1.23 1.35 1.48 1.63 1.93 2.10 2.32 2.36 2.37 2.38 2.38 2.39Increased annual earnings per child in the cohort4.61 5.49 6.10 6.73 7.24 7.98 8.77 9.64 11.43 12.43 13.72 13.94 14.00 14.06 14.08 14.10Increase in total cohort income per year, once earning starts ($millions)410 492 550 610 661 732 809 895 1068 1168 1297 1326 1340 1355 1365 1376Internal rate of return12.4% 13.2% 14.4% 14.3% 13.8% 13.8% 15.0% 15.5% 14.9% 15.2% 15.8% 16.2% 16.9% 17.8% 18.2% 18.0%
238 Fighting the Diseases of Povertypublic health budget requirements, but as an investment withenduring and large-scale impacts. The benefits of a push forincreased immunization are likely to heavily outweigh the costs,and policy makers who neglect immunization will be missing agreat opportunity for promoting development.
9 The World HealthOrganisation: a time forreconstitutionRichard E. WagnerThe World Health Organisation (WHO) was established in 1948 asone of several global organisations that were created in the aftermathof World War II. Among those other organisations were the<strong>International</strong> Monetary Fund, the <strong>International</strong> Bank for Reconstructionand Development (which became the World Bank), andthe General Agreement on Tariffs and Trade (which became theWorld Trade Organisation). While this essay is concerned with theWHO and its activities as these are revealed in an examination ofits budget for 2006–07, much of the underlying argument thatinforms this examination applies to international organisationsgenerally.This chapter unfolds in five stages. The first stage asks whatwould constitute reasonable performance for the WHO, and does soby postulating two concepts of performance that would surelycommand wide assent: smallpox and Mother Teresa.The second stage examines the WHO’s budget for 2006–07,exploring the extent to which those concepts can be identifiedwithin the WHO’s line items. While this exploration does not showthat the WHO has been an abject failure, it nonetheless gives theagency a low grade. To some, this might constitute a minimal passwhile to others it would mean that the agency has failed.Thethirdstageexaminesthecollectivistpresuppositionsonwhichthe WHO was founded, and which to this day shape its performance.
240 Fighting the Diseases of PovertyAccording to those presuppositions, free markets are weak arrangementsforsocietalorganisation,andrequiredomineeringgovernmentintervention to secure tolerable performance. These collectivist presuppositionsarenowgenerallyrecognisedtohavebeenfalse,yettheystill inform the WHO’s conduct.The fourth stage examines the WHO’s guiding political andbureaucratic incentives, which lead it to support the interventionistagenda that prevails in the environmental and public healthbureaucracies of the Western social democracies.The fifth stage explains that since the WHO was initially constitutedupon false presuppositions, securing improved performancerequires a re-constitution of the agency. Fundamentally, this meansthat government ought to provide a supporting, and not a leading,role in social and economic activities which generate health of apeople as one of their many outcomes.Images of the WHO: smallpox and Mother TeresaHow are we to appraise the activities of the WHO? The WHO is alarge organisation with a presence throughout the world. Its headquartersare in Geneva, and it also has six regional headquarters:Brazzaville for Africa, New Delhi for Southeast Asia, Manila for theWestern Pacific, Cairo for the Eastern Mediterranean, Washingtonfor the Americas, and Copenhagen for Europe.Its budget for 2006–07 calls for an expenditure of $3.185 billion,distributed across 37 distinct line-items of activity, as shown in Table1. Judging by its budget, about 31 per cent of the WHO’s activitiestake place at its Geneva headquarters, another 28 per cent are distributedamong its six regional headquarters, and the remaining 41per cent take place within individual countries throughout theworld.Specific observations about some of these budgetary line itemswill be offered later, but any effort to examine those line items ingreat detail would quickly become mired in numerous complexissues that could obscure an overall vision of the organisation.
The World Health Organisation: a time for reconstitution 241A coherent evaluation of the WHO’s activities must start withsome overarching vision of the organisation. This vision can beconveyed reasonably well by two simple concepts: smallpox andMother Teresa (Wagner, 1997). Smallpox, a disease that was eradicatedwith the WHO’s participation, represents communicablediseases which do not respect national boundaries and thus presentpotential issues of global concern. Mother Teresa represents charitytowards impoverished people by those who are relatively well off.These two concepts represent valuable points of reference againstwhich the WHO’s activities can be appraised.Before evaluating WHO’s activities, however, it is worth puttinginto perspective more generally the role of the private sector, governmentand inter-governmental bodies in addressing health issues.The first thing to be said about a market-based economy is thatit will generate a wide variety of health-related products andservices. The situation in this respect is no different for health thanit is for food, shelter, amusement, or anything else. There is anunderlying logic of economic relationships that governs such thingsas relative amounts of human activity directed at such services. Thatlogic also informs the relative emphases which people give toinventing and developing new technologies in those varied areas ofmarket activity. Entrepreneurs seek to develop, in a cost-effectivemanner, services that consumers will want to buy. Some entrepreneurswill develop exercise equipment; others will develop medicationsto combat diseases; and yet others will publish books aboutdiet, exercise and other health-related matters.To be sure, a governmental presence operates in the backgroundof all market-generated activity. One of government’s prime responsibilitiesis to maintain the framework of property rights and contractsthat is essential for a well-functioning market economy. Forinstance, as a matter of formal principle, people will invest inmedical research so long as they believe the return they anticipatereceiving will make the investment worthwhile. The extent of thisanticipated return, however, will depend on factors such as theterms on which patents can be secured and the extent to which they
242 Fighting the Diseases of Povertyare subsequently enforced. Hence, the pace of health-relatedresearch within a market economy depends on how successfullygovernment discharges its background presence.The difference between government in the background and inthe foreground is extremely important. The world may be a stage,as Jacques asserts in As You Like It, but market participants populatethe foreground while political officials remain in the background.That background entails essential work, for the play cannot goforward without the work of the stagehands. But it is backgroundwork nonetheless, out of the public’s sight.The foreground is occupied by those market participants (firms,entrepreneurs, customers, consumers) who establish hospitals andpharmaceutical companies, as well as the myriad other enterprisesand transactions, which contribute to the generation of healthrelatedenterprises and outcomes within a market economy. In thebackground, government facilitates commerce between these participantsby protecting relationships established through the principlesof property and contract.Two categories of activity, conveyed by smallpox (to representcommunicable diseases) and Mother Teresa (to represent charitytowards the poor), might provide a justification for governmentagencies to move out of the background and into the foreground.In dealing with communicable diseases, the presumption ofmarket efficiency that generally obtains for non-communicablediseases becomes questionable. It is a truism to say that people willbuy protection against diseases to the extent that they perceivesuch protection to be worthwhile. For non-communicable diseases,this creates a situation where people will rely on market-generatedoptions to secure protection, so long as the cost of securing additionalprotection is less than the benefit they believe that additionalprotection will provide. In this benefit-cost sense, market-basedoutcomes with respect to health generate efficient levels of protectionagainst non-communicable diseases.However, the situation does not necessarily apply to communicablediseases. Someone who acquires a communicable disease
The World Health Organisation: a time for reconstitution 243imposes a prospective cost on those with whom he comes intocontact. Similarly, someone who reduces their own likelihood ofacquiring a communicable disease thus also confers benefits onother people. Economists describe this phenomenon as an “externality,”and it provides a plausible (though not conclusive) argumentin support of some role for government in the foreground of healthrelatedactivity. Allthough individuals will purchase protection tothe extent that they judge such protection to be worthwhile, theircalculation of benefits does not account for the benefits or costs thattheir own choices confer on other people.Influenza provides a good illustration of this point. There areseveral things people can do to protect themselves againstinfluenza, none of which is perfectly effective but each of whichoffers some measure of protection. People can increase the frequencywith which they wash their hands. They can reduce theamount of time they spend in crowded places. They can wear respiratorsin public. Most visible among these protective measures isinoculation. While inoculation is available for influenza, it may workwell against some strains of the disease but not against others.Each of these measures involves costs and entails some perceptionabout the degree of protection secured. In a market economy,inoculation must be paid for, and thus carries a price. In someinstances, inoculation will also involve negative side effects, andmay not provide total immunity. When people take these variousconsiderations and perceptions into account, they will purchasesome volume of inoculation, which in turn will generate some levelof protection against influenza within the society.This account of individual choice and market outcomes does notaccount for the effect of one person’s choice on other people. Aperson who increases his level of protection, whether through inoculationor changes in conduct, reduces the chance that he willcontract the disease and subsequently transmit it to others. Formallyspeaking, that person would seek protection against communicabledisease to the point where the cost of that added protection is equalto the perceived benefit from that protection. Ideally, however, that
244 Fighting the Diseases of PovertyTable 1 WHO’s budget by line item, 2006–2007, $000sArea of WorkTotalCommunicable disease prevention & control 152,983Communicable disease research 108,457Epidemic alert and response 131,119Malaria 137,509Tuberculosis 134,526HIV/AIDS 260,650Immunization and vaccine development 381,211Noncommunicable disease surveillance 56,103Health promotion 48,146Mental health & substance abuse 29,764Tobacco 29,193Nutrition 24,098Environment & health 90,412Food safety 23,717Violence, injuries, and disabilities 17,505Reproductive health 65,867Making pregnacy safer 64,017Gender, women, and health 17,703Child and adolescent health 100,500Essential medicines 61,968Essential health technologies 31,182<strong>Policy</strong>-making for health in development 39,533Health systems policies & service delivery 116,349Human resources for health 77,631Health financing & social protection 42,975Health information & research policy 57,586Emergency preparedness & response 105,400WHO's core presence in countries 197,776Knowledge management & information technology 138,180Planning, resource coordination, & oversight 27,590Human resources management 51,873Budget and financial management 46,155Infrastructure and logistics 133,682Governing bodies 37,388External relations 35,126Direction 39,433Miscellaneous 71,797Total 3,185,104
The World Health Organisation: a time for reconstitution 245Country Regional Headquarters63,481 50,976 38,5263,275 6,397 98,78552,121 44,423 34,57555,767 47,167 34,57568,147 38,719 27,660163,010 68,004 29,636193,318 123,682 64,21125,019 14,982 16,10217,731 9,670 20,74513,696 8,659 7,40912,778 9,204 7,2118,990 8,193 6,91538,287 25,947 26,1788,652 8,348 6,7176,672 4,610 6,22312,599 7,036 46,23233,982 19,169 10,8665,656 4,144 7,90342,769 34,022 23,70925,236 11,048 25,68411,312 8,016 11,85419,300 10,552 9,68158,813 33,432 24,10442,701 22,384 12,54619,864 12,245 10,86627,021 17,723 12,84277,634 19,863 7,903176,145 16,692 4,93921,140 47,890 69,1504,961 9,787 12,842479 16,819 34,575330 23,598 22,2272,193 55,424 76,06558 11,646 25,6842,183 13,383 19,560488 11,945 27,0001,178 12,119 58,5001,316,986 887,918 980,200
246 Fighting the Diseases of Povertyprotection should be extended to the point where the cost is equal tothe combined benefit to the person choosing the protection and to allthe others who in turn receive some enhanced protection.While there is plenty of controversy over the extent to whichgovernment should be involved in the provision of health-relatedservices, there is widespread agreement that communicablediseases provide a justification for some form of government participationin preventative measures.Communicable diseases that originate in poorer regions of theworld present more severe problems of global coordination thanthose that might originate in wealthier regions. Within a wealthiersociety, people are likely to achieve a level of care against communicabledisease that exceeds what people in poorer societies wouldbe able to attain.In a setting of global mobility, this means that an externalityexists. People in poorer societies will tend to take fewer precautionsagainst contracting communicable diseases than people in wealthierareas might desire them to take. If residents of wealthier societiesfeel that they are threatened by contagious diseases when notenough precautions are taken by poorer societies, a case can bemade for richer societies to support control of communicablediseases in the poorer societies. 1This justification based on contagion across national boundariesis independent of and distinct from any justification that might arisefrom poverty. It is clear that the most severe health problems in anysociety are found among its poorest members. This negative relationshipbetween health and poverty holds throughout the worldjust as it holds within any single nation.A society’s wealthier members generally possess and displaysome charitable attitude towards fellow people who experience significantdeprivation. Charity is a natural human sentiment, and it isplausible that charitable sentiments would find some expression ona global level.To be sure, however, it does not follow that charitable sentimentsshould necessarily entail governmental participation. There is
The World Health Organisation: a time for reconstitution 247plenty of charitable activity organised through voluntary arrangementsof all kinds. Furthermore, it is doubtful to what extent charitablesentiments are truly expressed when the contributions areextracted from taxpayers by force, rather than by voluntarydonation.In general, the collectivist spirit that dominated much of the20th Century has been replaced by recognition that free and liberalarrangements and institutions are the best way to enable humanflourishing. Nevertheless, an organisation like the WHO might stillplay a role in the foreground of health-related activity, due to theexistence of communicable diseases which ignore national boundaries,and possibly to carry out charitable sentiments directedtowards the poor.Communicable disease and charity, smallpox and Mother Teresa,moreover, are not independent of each another with respect tohealth. The places where communicable diseases are most prevalentare also the poorer places in the world. In any case, smallpox andMother Teresa provide clear conceptual images to examine theWHO’s budgetary activities.The WHO’s budget for 2006–07Table 1 portrays the WHO’s budget for 2006–07 in terms of 37 lineitems, along with the location of the expenditure as between Geneva,one of the six regional headquarters, or within individual countries.It would be a reasonable experiment to give the WHO’s budget, alongwith the descriptive detail that accompanies the budget to a disinterestedobserver. The observer would be asked to reach a judgmentabout the extent to which the concepts represented by smallpox andMother Teresa are reflected in the agency’s budget.Two conclusions would surely emerge out of such an examination.One is that the WHO’s budget does contain some activities thatreflect those concepts of combating communicable diseases andoffering health assistance to impoverished people. The second,obverse, conclusion is that many of the WHO’s activities have
248 Fighting the Diseases of Povertynothing at all to do with those activities, and reflect instead animage of an interfering, self-absorbed bureaucracy that is involvedin promoting anti-market ideologies and activities.An initial analysis of the 37 lines of the WHO’s budget could leadan impartial observer to distinguish between the first seven items,and the remaining 30. Judging by their titles, the first seven lineitemsconvey clear images of smallpox and Mother Teresa. To besure, those are not the only concepts that are conveyed; a bureaucraticimage is also present in those seven items. For one thing,there is very little work to be done in Geneva that would reflect theimages of either smallpox or Mother Teresa.Comparatively speaking, however, the extent of bureaucracy isless for those first seven items than for the remaining 30. Forinstance, 25 per cent of the WHO’s spending on these seven itemsis designated for the WHO’s headquarters in Geneva. By contrast, 35per cent of the spending takes place in Geneva for the other 30items. On a comparative basis, the first seven items reflect astronger orientation towards controlling communicable disease andproviding assistance for the impoverished than do the remainingbudget items. At the same time, those first seven activities constitutebut 41 per cent of the WHO’s budget. The remaining itemsoccupy 59 per cent of the WHO’s budget, and these more fully reflectan anti-market health bureaucracy at work. This is elaborated insubsequent sections.The devolution of expenditure away from Geneva to the countrylevel does not necessarily imply that the WHO’s activities more fullyreflect the concepts represented by smallpox and Mother Teresa. Forinstance, the third-largest item in the WHO’s budget is “WHO’s corepresence in countries.” This item is exceeded only by budget entriesfor “HIV/AIDS” and “immunisation and vaccine development.” Trueto its name, moreover, 89 per cent of WHO’s spending for its “corepresence in countries” occurs at the country level.At first glance, there might seem to be little bureaucracy evidenthere. The WHO’s account of what this activity actually entails,however, suggests the image of a lobbyist. Its purpose is to cultivate
The World Health Organisation: a time for reconstitution 249support for the WHO and its agenda of comprehensive healthplanning. For instance, one of the listed objectives for this line-itemis to triple the number of countries “that have an updated WHOCountry Cooperation Strategy.” The other listed objectives withinthis line-item are likewise aimed at polishing the WHO’s image inindividual countries. The image reflected in this activity is one ofbureaucratic self-promotion.Some criticisms can be made about the budget entry for “policymakingfor health in development,” where three-quarters of expenditureoccurs outside of Geneva. For that item, the WHO announcesthat it “seeks to influence a wide range of national and internationalpolicies, laws, agreements, and practices.” In seeking to accomplishthis, the WHO asserts that it not only pushes the Millennium DevelopmentGoals (a UN-sponsored adventure in developmentplanning), but it also occupies the policy foreground with respect to“such issues as the relationship between health and human rights,poverty, aid instruments, macroeconomics, equity, ethics, globalization,trade and law.”If this is not sufficient testimony about bureaucratic self-promotion,the WHO’s budget reveals objectives such as achieving afive-fold increase in the “proportion of low-income countries inwhich WHO has played an acknowledged role in enabling nationalauthorities to develop Poverty Reduction Strategy Papers [and]national poverty reduction plans.” Even its line-item for “essentialmedicines” seeks to promote medical nationalisation, and adoptsas one if its objectives an increase in the “number of countries withpublic-sector procurement based on a national list of essentialmedicines.”The same bureaucratic imperative is present in the line-itemcalled “health promotion.” This item is dominated by the WHO’sassertion that “governments must play a stronger role in developinghealth public policies; health ministries need to take the lead byadvocating for the development and adoption of these [WHO-advocated]policies.” Those policies have numerous objectives. At variousplaces in the WHO’s budget, we see that the WHO is concerned with
250 Fighting the Diseases of Povertyhigh blood pressure, cholesterol, weight, diabetes, heart disease,cancer, and smoking. While this may seem extensive, it is not thelimit of the WHO’s activities: it is also involved with depression,drug abuse, neurological disorders, violence, and traffic safety andnumerous other issues.Another line of inquiry would be to probe the effectiveness ofthe WHO’s activities, by analysing the overall structure or patternof its budgeted activities to examine the details of its operation. Ata structural level, it could be concluded that approximately 40 percent of the WHO’s activities are described reasonably well by theconcepts of smallpox and Mother Teresa. The details of how that 40per cent is allocated and spent, however, might well reveal thatthose funds are being used relatively ineffectively. If so, a transfer ofthose funds to organisations that perform those activities moreeffectively would accomplish both more comprehensive control ofcommunicable disease, and would provide a greater measure ofhealth assistance for impoverished people.Consider the line-item for “communicable disease research.” Bydefinition, this spending fits the concept of smallpox and to someextent the image of Mother Teresa, since problems of communicabledisease are most severe in impoverished parts of the world. Yet aclose examination might conclude that the $108.5 million spent inthis category – 90 per cent of which is spent in Geneva – could domore good if it were redirected to other activities.The WHO’s spending on communicable disease research is a tinyportion of such spending worldwide. The issue here is the marginalcontribution of the WHO’s effort, especially when compared toother efforts the WHO might have undertaken with the sameresources. It is likely that more would be accomplished if the WHOreduced its emphasis on research and redirected those funds todealing with malaria, tuberculosis or HIV/AIDS.It is even conceivable that the WHO’s marginal contribution tothe advancement of knowledge about communicable disease isnegative. The agency’s own description of this line-item suggeststhat it prefers a hierarchical approach to scientific inquiry. Its vision
The World Health Organisation: a time for reconstitution 251of research on communicable disease is that the agency leads theway in articulating what research should be pursued, and individualresearchers then follow the WHO’s lead.Yet scientific inquiry follows the same organisational principlesas ordinary economic activity, which means that progress occursmore rapidly through open competition than through central directionor regulation. By attempting to centrally direct research, theWHO narrows the lines of inquiry that are pursued. In most cases,this retards progress (Kealey, 1997; Tullock, 1967).Suppose the WHO were to shift resources away from researchon communicable diseases into activities represented by its lineitemsfor malaria, tuberculosis, or HIV/AIDS. There is no guaranteethat extra money devoted to those specific diseases will accomplishmuch. The WHO’s activities regarding malaria, for instance,are of dubious value. Since the WHO started its ‘Roll Back Malaria’program in 1995, the global toll from malaria has actuallyincreased. To be sure, this post hoc statement does not constituteproof of the WHO’s ineffectiveness – but the agency has beenreluctant to clearly support the use of DDT as a form of vectorcontrol, despite its clear success in controlling malaria in India,South Africa and many other countries (Roberts et al., 2000).Instead, it has almost exclusively promoted alternative measuressuch as insecticide-treated bed nets. These are several times morecostly, as well as generally less effective than DDT. With such animplicit rejection of other methods to prevent malaria, the WHOhas followed the expressed desires of environmental and healthactivists in the first world. Deaths from malaria now exceed onemillion annually, and some estimates are far higher (Snow et al.,2005).Similarly, the WHO’s attempts to scale up antiretroviral treatmentfor HIV/AIDS sufferers have been far from successful. Its ‘3 by5’ initiative – a plan to put three million people on life-extendingantiretroviral (ARV) treatment by the end of 2005 – is arguably thesingle largest effort that any multilateral body has yet undertakento tackle the disease.
252 Fighting the Diseases of PovertyHowever, by February 2005 only 700,000 people were receivingARV treatment, well short of the 3 million proposed when the initiativewas started in 2003, and a drop in the ocean compared withthe minimum of six million people in Africa, Asia and LatinAmerica who need the treatment. 2 Bowing to pressure fromWestern health activists, the WHO relied heavily on untested tripledrug fixed-dose combinations in order to meet its self-imposedtargets. In late 2004, it was forced to de-list these drugs, producedmainly by otherwise-reputable Indian drug companies, because ofsafety concerns.There is no doubt that the concepts of smallpox and MotherTeresa can be observed in some of the WHO’s work – but thoseimages constitute a minority of the full range of its activities.Judging from its budget, the control of communicable disease andthe provision of health assistance to the impoverished are secondaryactivities of the agency.The primary activities of the WHO would seem to be of two interdependentsorts. One sort is simply bureaucratic self-promotion.However, this requires allies within the environmental and publichealth bureaucracies of the first-world nations, which are theWHO’s largest source of budgetary support.The majority of activities of the WHO seem to be focused onbureaucratic self-promotion. This appeals to the environmental andhealth bureaucracies that guarantee much of the agency’s funding,and it explains why some of the WHO’s primary activities involvepromoting and supporting the agendas of those interventionistbureaucracies.The heritage of a collectivist half-centuryWith the collapse of communism now receding quickly into thebackground of our memories, it is becoming increasingly difficult torecall the collectivist nature of the climate of opinion that reignedthroughout the West during much of the 20th century. ThoughWestern societies were grounded in individual liberty, with private
The World Health Organisation: a time for reconstitution 253property and limited government providing the framework for amarket economy, many intellectuals, including economists, weresocialists even in the 19th century.The Russian Revolution and formation of the Soviet regime earlyin the 20th century gave a huge boost to those socialist sympathies.While a few renegade economists like Ludwig von Mises andFriedrich Hayek argued that communist and collectivist planningsystems could never generate the human flourishing that liberal,free-market capitalism had generated, the overwhelming climate ofopinion sided with the socialists (Hayek, 1935; Roberts, 1971;Boettke, 1993).To be sure, the Western-style socialist psyche recoiled at some ofthe regimentation that characterised Soviet-style socialism, andsought instead to establish a more humane form of market-friendlysocialism. In this search, there was thought to be a grave trade-off:socialist planning might promote faster economic growth butwould restrict liberty beyond what Western traditions would countenance.While traditions can always change, the Western concernwas focused on expanding government’s role in and control overeconomic and social life to boost economic progress, but stoppedshort of Soviet-style socialism.Even as late as 1989 in the 13th edition of his renowned <strong>text</strong>bookEconomics, Paul Samuelson described the splendid economic propertiesof a collectivist economic system which allowed the SovietUnion to grow at a significantly faster rate than the Western democracies,by asserting “the Soviet economy is proof that . . . a socialistcommand economy can function and even thrive.” (Samuelson &Nordhaus, 1989). The challenge for those in the West who rejectedSoviet-style collectivism was to find a middle way that would retainmargins of modest liberty alongside a good deal of government participationin economic affairs.Much of the Western concern about how much collectivism toembrace was based on predictions about the speed at which theSoviet Union’s economy might surpass that of Western countries.Most intellectuals and economists were convinced that this would
254 Fighting the Diseases of Povertyhappen unless effective (but gentle) collectivist counter-measureswere undertaken. Economist Warren Nutter was a rarity: he studiedthe Soviet Union carefully and concluded that the majority ofWestern economists were wrong (Nutter, 1961): the Soviet economywas not a looming powerhouse but was economically puny(although militarily dangerous). While Nutter was pilloried at thetime by most other ‘experts’ (who sided with Paul Samuelson’sappraisal of the situation), the evidence that surfaced since the disintegrationof communism shows that even Nutter over-estimatedthe economic performance of the Soviet Union: it was even weakerthan he had suggested.The WHO and the other international organisations werefounded at a time in history when belief in collectivism and thedistrust of free markets were at their peak in the West. As the IronCurtain came crashing down, it was recognised that Soviet-style collectivismshould be opposed.However, the presumed success of its economy was used as a justificationfor a Westernised version of collectivism; ostensibly,Western-style liberalism of the old order was out-dated in ourmodern age. The Western tradition of private property and individualliberty that underpinned free markets was widely thought to bea weak and fragile institutional arrangement. Unless they embracedsome of the features of collectivist control that characterised thecommunist empire, Western societies would be plagued continuallyby instabilities, monopolies and externalities.The WHO and its siblings were created among this widely prevailingclimate of opinion: they were promoted as global instrumentsof collectivist intervention which, when combined withsimilar intervention in the individual national economies, wouldcreate a kinder and gentler alternative to Soviet-style collectivism.This is often characterised as a mixed economy, to indicate somemixture of liberalism and collectivism as the social equivalents ofoil and water (Littlechild, 1978; Ikeda, 1997).It is generally recognised that the ideas which governed Westernsocieties in the post-war period were false. Free markets are not
The World Health Organisation: a time for reconstitution 255fragile and unstable institutional arrangements: they are robustarrangements that promote creativity and progress. Fragility andinstability do appear in human societies, but when this happens theheavy hand of government is also close at hand.This is true at a macro and micro level. On a large scale, the GreatDepression is perhaps the prime instance of economic instability inthe 20th century. For a long time this catastrophe was presumed tobe the archetype of systemic market failure. Now, it is accepted thatit was an outstanding and prolonged example of systemic governmentfailure; the only remaining issues relate to the relative contributionsof the various paths that government took in promotingdepression. 3 Whatever the path, however, the Depression’s originlays with governments and not with free markets.On a small scale, claims of market failure are voluminous. Theargument is that externalities create market failures, which can onlybe corrected with some form of government regulation. Such claimsoften seem sensible on the surface, and equally often are shown tobe wrong upon careful examination.In a similar vein, it appeared reasonable for millennia to concludethat the sun rose in the west and set in the east. It wasn’t untilCopernicus examined the matter carefully that people came torealise that the surface impression was wrong. One of the archetypicalclaims of market failure – regarding bees and pollination (asituation that bears some resemblance to communicable disease) –was advanced by Nobel Laureate James Meade (Meade, 1952). Meadeillustrated his argument with beekeepers and apple farmers, andclaimed that markets would fail to secure efficient production. Onthe one hand, apple growers will plant too few trees because theydo not account for the value that their trees provide to beekeepers.On the other hand, beekeepers will supply an insufficient number ofhives because they do not consider the increased apple productionthat results from the pollination services the bees provide.At first glance, this story seems sensible. Yet a closer examinationof market relationships where honey and apples are producedshows this conclusion to be absolutely wrong: A wide variety of
256 Fighting the Diseases of Povertycontractual agreements exist among beekeepers and apple growers(Cheung, 1973).For instance, apple blossoms provide little honey but bees dooffer valuable pollination services, so apple growers pay beekeepersto provide their bees for such services. On the other hand, cloverdoes not require pollination but yields much honey, so beekeeperspay to bring their bees into fields of clover. In either case, there isno market failure that leaves us with too few apples and too littlehoney. This illustration, replicated numerous times in differentsettings, is testimony to the economically robust character ofmarket-generated commercial arrangements.With respect to the subject of this essay, it is often claimed thesparse supply of new drugs to treat diseases common to poorerparts of the world is an illustration of market failure. Governmentalintervention, including intervention on an international level, isthus advanced as a remedy to redress the situation.However, a closer analysis reveals myriad ways, through regulationand taxation, that government failure has weakened the commercialviability of efforts to develop such drugs (Morris et al., 2005).For instance, Third-world governments often imposes taxes andtariffs on imported drugs that can boost the price by as much as 50per cent. When combined with price controls, the incentive for themarket-based supply of drugs may range between weak and dead.Furthermore, those countries often have poorly developed institutionalarrangements regarding the protection of property rights andthe fulfillment of contractual obligations.The WHO, along with the other international organisations, wasfounded at a time when the central analytical presupposition wasthat market failure was ubiquitous and that governments wereguardians against such failure. Over the past 40 years, this standardpresupposition has been reversed from two directions. One directionhas been a growing appreciation of market-based arrangements.The other direction entails recognition that governmentagencies and bureaucracies often lack the knowledge or incentive topromote well-functioning markets, and tend instead to promote
The World Health Organisation: a time for reconstitution 257market failure. This suggests that government failure, not marketfailure, is often the source of observed societal problems and difficulties.These considerations are relevant to a consideration of the WHO.The WHO was built upon a collectivist foundation which still guidesthe agency’s work and activities. What it needs is not a renovationof its collectivist structure, but a new foundation that reflects theprimacy of liberty and the supporting (rather than leading) role ofgovernment in the organisation of economic and social affairs.A comparison of the experiences of South Korea and the Philippinesover the past fifty years is a salient illustration of this point.Fifty years ago, each country had similar levels of per capita income,and each seemed to most analysts to face similar future prospectsfor economic growth and development. Today, per capita income inSouth Korea is around four times as large as that of the Philippines,due to a considerably faster rate of growth in the former. The Philippines’economy has been much more thoroughly plagued by interventionistgovernment policies than that of South Korea.Adam Smith claimed in the 18th century that “little else is requisiteto carry a state to the highest degree of opulence from thelowest barbarism, but peace, easy taxes, and a tolerable administrationof justice; all the rest being brought about by the naturalcourse of things.” 4 Smith’s claim clashed severely with the collectivistorientation that was dominant throughout much of the 20thcentury, but in the post-socialist era, its wisdom has been reaffirmedas the most prosperous and robust economies are those wherepeople have the greatest measure of liberty. 5A market economy grounded in private property and freedom ofcontract has two overwhelming advantages that are taken awayincreasingly as the blanket of collectivism spreads over aneconomy. 6 One advantage resides in the division and use of knowledgethat characterises a market economy. In a famous essayentitled I, Pencil, economist Leonard Read noted that no singleperson could describe how to make a simple pencil, let aloneactually make one. The task exceeds our mental capacities, for the
258 Fighting the Diseases of Povertyability to buy a pencil is the result of achieving a coordinationamong the actions of millions of people throughout the world, andextends across a period of many years. We take for granted ourability to buy pencils because no one dictates our ability to buypencils.It is no paradox to find that when we are unable to buy aproduct, we will also find that some person or office is using thepower of government, purportedly to assure a steady supply of theproduct in question. For instance, in the United States in the mid-1970s, the federal government took on the task of assuring Americansthat they could obtain petrol for their cars. Sure enough, itbecame difficult (and often impossible) to buy petrol.During the same period, there was an even greater proportionalreduction in production of coffee than there was of oil – yeteveryone was able to buy coffee. The only difference was that therewas no person or office in charge of assuring Americans that theycould buy coffee. The amount of knowledge that must be broughtto bear in organising the supply of petrol, coffee, or pencils is far toocomplex for any person or office to master. The effort at suchmastery overloads the capacity of the mental and organisational circuitry,creating bottlenecks that result in government-generatedmarket failure.This brings us to the second advantage of market-generatedarrangements: the fact that they offer superior incentives to producersand consumers. In a market economy, a producer might initiallyallocate too much petrol to one region rather than another, ormight produce too much kerosene relative to petrol. The producerhas a strong incentive to revise the initial decision, for otherwisesales and profits would be lost. A public official, however, has no suchincentive, because he or she will not suffer any lost profit by failingto reconsider and revise an initial decision. That official, moreover,may well be insulated from personal inconvenience because governmentstypically have the first claim on petrol for their vehicles.Adam Smith was right: there is nothing mysterious about thepositive relationship between freedom and prosperity. The place of
The World Health Organisation: a time for reconstitution 259government in a flourishing society is mostly to occupy backgroundpositions. It is human nature, however, to seek the limelight of theforeground, and with this comes the age-old problem of the relationshipbetween people and governments. Societies are more likelyto flourish when governments and their officials occupy the background,but government offices are staffed by people who seek tooccupy the foreground. Ideally, those governmental offices and officialswork to maintain the framework of property and contractwithin which market participants interact to generate commodiousliving standards in free societies.It is not their responsibility to ensure comfortable lifestyles forpeople in developed countries, for that comfortable living is generatedthrough the creative, entrepreneurial efforts of all who engagein commercial activity. The contribution of government is importantbut modest, and it is clearly has a supporting but not a leading rolein that process. Yet governmental officials are continually temptedto muscle their way into the foreground of economic and socialactivity. If they are too successful, taxes and regulation rise and prosperityis undermined.What is true for wealth is also true for health: both are mosteffectively generated through free and open markets, with governmentsproviding some important background services. But the WHOseeks to occupy the foreground of the stage of health-related humanactivity. While the WHO’s Constitution lists 22 specific functions,the raison d’être of the agency is found in the agency’s Preamble.The Preamble asserts that “Health is a state of complete physical,mental, and social well-being and not merely the absence of diseaseor infirmity.” Nothing, it would seem, is outside the purview of theWHO. This assertion of omnipresence is followed by the assertionthat “the enjoyment of the highest attainable standard of health isone of the fundamental rights of every human being. . . .” Afterseveral more such assertions, the list ends with the assertion that“governments have a responsibility for the health of their peopleswhich can be fulfilled only by the provision of adequate health andsocial measures.”
260 Fighting the Diseases of PovertySuch assertions could be regarded simply as wishful thinking,much like wishing for a peaceable kingdom where lions would liedown peacefully with lambs. Such a statement of wishes wouldnever be confused with reality, and moreover, would hardly besuitable material for a Preamble to a constitution.Yet these assertions must be taken as serious objectives and notjust as fond wishes about some ‘end of history.’ The Preamblereveals that the WHO’s self-identity is that of an entity which possessesprimary responsibility for health conditions throughout theworld. Within such an orientation, the WHO has primary responsibilityfor health, though as the first item in its Preamble states,health is not just as the absence of disease, but is everything thatmight be thought of as curtailing human happiness.Consider the WHO’s concluding assertion that “governmentshave a responsibility for the health of their peoples.” If we generalisethis statement about health to a statement about wealth, itwould read that governments have a responsibility for the wealthof their inhabitants. These formulations suggest that people cannotsecure wealth and health without government, for such things arebeyond personal reach. Unfortunately, the WHO is mired in the sameideas that dominated in the West at the end of World War II, which(while fading) are still a threat to liberty and prosperity.The bureaucratic gap between vision and realityThe WHO, like the other international organisations that were establishedafter World War II, is a global bureaucracy. The gap betweenthe vision characterised by the concepts of smallpox and MotherTeresa and the reality of the WHO’s actual conduct is an understandableresult of the institutional arrangements within which itwas constituted. By now, a considerable literature has developed toexplain the performance properties of public bureaucracies at thenational level. A brief consideration of the central themes of that literaturecan provide a foundation on which to consider the WHO andother international bureaux. 7
The World Health Organisation: a time for reconstitution 261Public sector organisations do not have the same incentives ascommercial firms for efficient supply of goods and services. Thisweaker incentive reveals itself in a variety of ways. It often resultsin a more costly service, because there is no owner who can capturethe gain that greater efficiency will create. If a private enterprisebecomes more efficient, its owners gain, but they lose if the firmbecomes less efficient. If a public-sector organisation becomes moreefficient, the gain accrues to taxpayers as a general class, but theyalso bear the loss as a class if it becomes less efficient. Numerousstudies show that services provided by government bureaux aremore costly than similar services provided by commercial enterprises.There are also substantial differences along many dimensions inthe qualitative characteristics of the services offered by governmentand commercial firms. Commercial firms are highly responsive tothe desires of their customers, for it is the customers who supplyrevenue to the firms. In a government bureau, the people whoreceive its services do not supply revenue to the bureau, except tothe generally small extent that user charges accrue to the bureau(and even here user charges never operate as effectively as marketprices) (Wagner, 1991). Government organisations respond not tothe individuals who receive the services the government supplies,but to the legislators who provide the organisation’s budgetarysupport. Effectively, these legislators are the “customers” whom theorganisation must please.What this means is that a government bureau will focus on activitiesthat its key legislative sponsors and overseers deem important.In some cases those activities might coincide with customer desiresmore generally, but this is by no means always the case. A nationalhealth bureau, for instance, will be especially responsive to desiresexpressed by the legislators which can most directly influence itsfortunes.On other matters, bureaux will have wide leeway to do as theychoose. For instance, some cost-conscious legislators may believethat a publicly-funded hospital should not exceed private hospitals
262 Fighting the Diseases of Povertyin the length of patient treatment. To pursue this thought, those legislatorsmay examine average hospital stays for various categoriesof diagnosis. If this is the case, we may feel reasonably assured thatthe public hospital will generate the desired pattern of outcomes, orwill have a good explanation for any discrepancy.Acloserexaminationmightshowthatthepublichospitalachievedthis outcome by selectively admitting patients, or perhaps by exercisingdiscretioninitsuseofdiagnosticcodes,orperhapsbychangingits standards for discharge. However, these kinds of issues are outsidethe range of oversight; what really influences the behaviour of apublic-sector organisation is the interests of its political sponsors.An international bureau is even less subject to oversight becauseit receives funding from a large number of donor nations. The WHO,for instance, receives funding from the largest and wealthiest firstworldnations. Because the agency’s budget is derived from manynational governments (not just one), the WHO is less susceptible topolitical oversight than its national counterparts. Still, the agencymust attract participation and contributions, and necessarily willbe responsive to the strongly-held desires of its major donors andsupporters. If those donors had a strong desire that the WHO actedaccording to the concepts of smallpox and Mother Teresa, its budgetwould look quite different.The current budget reflects the variety of concerns and intereststhat inform the expansive health agendas of contemporary socialdemocracies in the Western world. Part of that agenda includes anexpansion of the meaning of “public health”, away from communicabledisease to practically anything that fits within the modernrubric of the therapeutic society. Thus, as communicable diseaseshave receded in significance, the WHO concentrates on activitiesrelating to obesity, smoking, depression, and myriad other things inwhich now interest the public health bureaucracies of the rich world.WHO transformed for a liberal world orderOur world has shrunk greatly over the past half-century, and will
The World Health Organisation: a time for reconstitution 263continue to do so through technological innovation. Electronic communicationis instantaneous, and aeroplanes can now carry 800people half-way around the world at several hundred miles perhour. This shrinkage presents both opportunities and threats.The opportunity before us is to witness human flourishing on anunprecedented scale. To achieve this opportunity requires a functioningsocial order on a global scale. Such order must be generatedlargely in bottom-up fashion, through the promotion of humanflourishing through market-generated economic relationships.As Smith noted in the 18th Century, human flourishing is largelythe product of the self-ordering activities of a free people. It requiresthat governments operate mostly in the background, facilitatingpeople’s ability to generate commercial enterprises and civic associations.The primary threat to human flourishing is the hubris ofcollectivist control, which results when politics escapes its properlocation in the background and muscles its way onto centre stage.The WHO was founded at the apogee of collectivist belief in theWest, but the strength of that belief has been steadily weakening fora generation. Meanwhile commerce is continually expanding andborders are continually shrinking, and simultaneously the worldorder is moving in a liberal direction (even if in jerky fashion). Nevertheless,collectivism still informs the activities of many nationalgovernments and international agencies. The UN’s MillenniumDevelopment Goals project is a dying effort to salvage a collectivistorder with government dominating the foreground.There will be a role for a WHO-type organisation within a liberalworld order, as communicable diseases will probably always bepresent even if the intensely geographical pattern of povertysomeday disappears. In the interim, though, the presently constitutedWHO presents a danger to that liberal order insofar as itretards the pace of development with ideological efforts to promotedevelopment planning at the expense of free markets and entrepreneurship.One option for the future is the outright abolition of the WHO.Abolition would not eliminate efforts to control communicable
264 Fighting the Diseases of Povertydisease or to provide health assistance for the very poorest. The richnations have the means to deal with communicable diseases, and donot need to funnel such efforts through the WHO. Many bodies existthat could co-ordinate actions at a supranational level, probably moreeffectively and in a less costly manner. A good number of privatelyorganised charitable organisations already provide such services, andthey would surely expand should the WHO shrink or die.One example of how private organisations can successfullytackle global public health crises comes from Rotary <strong>International</strong>.The defeat of polio in the 20th century was largely the result of theirfunds and mass vaccination programmes. Twenty years ago, therewere a thousand new cases of polio every day. Now polio strikesonly about 1,000 children a year, and its complete eradication isimminent. By the time polio is entirely eradicated, Rotarians willhave directly contributed at least $600 million – more than anyother single organisation apart from the US government.It is hard to see how the WHO could be reformed internally whilemaintaining the same character, at least as long as the agency isinfluenced by the interventionist policies advocated by the primaryenvironmental and health bureaucracies of the Western world. Onepossibility along these lines would simply be to banish the WHOfrom the developed world. If the agency lost contact with thoseenvironmental and health bureaucracies, its attention would almostsurely be devoted to matters of most immediate interest to thosewho inhabit poorer nations. This banishment would do no harm,even if there is no assurance about how much good it would do.Whether the WHO is abolished or transformed, its focus shouldbe on controlling the global transmission of communicable diseaseand not on promoting the expansive and interventionist agendas ofthe Western public health bureaucracies. As for whatever charitableactivities the WHO might practice, other than what might emergeas a by-product of its work with communicable disease, such charityis far better for its intended recipients when it is conducted byprivate organisations. Mother Teresa, after all, was not an internationalbureaucrat.
NotesIntroduction1 The UN Human Development Report of 2005 is one recent example.2 http://www.who.int/hpr/NPH/docs/declaration_almaata.pdf.3 This theory is set out more clearly by, for example Sachs et al., 2004.1 Wealth, health and the cycle of progress1 In this paper, I will use GDP per capita, per capita income, income, wealth andaffluence interchangeably. All data pertaining to GDP will be in terms ofconstant <strong>International</strong> (PPP-adjusted) dollars. <strong>International</strong> dollars are obtainedusing a special conversion methodology utilizing “purchasing power parity”which is designed to reflect more accurately the purchasing powers of differentcurrencies. Conversion is based on the number of units of a country’s currencyrequired to buy the same amounts of goods and services in the domestic marketas $1 would buy in the United States. In contrast, the market exchange rate(MXR) of a currency in U.S. dollars is the amount of the currency one can buywith one U.S. dollar on the open currency market.2 The logarithm of per capita income is used to moderate the impact on the indexfrom additional increases in income.3 Data on per capita food supplies and GDP per capita are from World ResourcesInstitute (2005) and the World Bank (2005b), respectively. Income is given inconstant (2000) PPP-adjusted <strong>International</strong> dollars.4 The smoothed curves in this figure were generated by regressing FS against thelogarithm of income based on the following “log-linear” relationship: FS = A +B_D + C_log(income). D is a dummy variable to represent observations fordifferent years (D = 0 for 1975, and 1 for 2002), and A, B and C are constantcoefficients. A total of 263 observations were used for the two years (i.e., N =263), the adjusted R 2 = 0.65, and the coefficients of the log(income) term andthe dummy variable are significant at the 99.9 per cent level (i.e., p < 0.001). Inother words, the dependence of FS on GDP per capita is significant, as is theupward shift in this indicator as we go from 1975 to 2002.5 Technology is defined here broadly to include tangible tools and machines aswell as intangibles such as skills and knowledge (see Goklany 1995). It includeshardware, software, as well as management practices, competence and knowhow.Over time, all these aspects of technology can be, and generally are,improved, perfected and diffused, that is, time is a surrogate for technologicalchange (so defined). Thus the entire upward displacement is attributable to thepassage of time.
266 Fighting the Diseases of Poverty6 The smoothed curves for 1990 and 2002, based on data from World Bank(2005b), were generated using log-log regression analysis, that is, by regressingthe logarithm of ASW against log(income) and a dummy variable to distinguish1990 data from 2002 data. N = 241 for both years (combined). Because ASWcannot exceed 100 per cent, and some countries had reached that limit, a Tobitregression was used with truncation at this upper limit. The untruncated log-logregression had an adjusted R 2 = 0.52. The coefficients for the dummy variableand the log(income) terms, that is, the upward displacement of the ASW curvewith time and the increase of ASW with income, are significant at the 95 percent level for both the truncated and untruncated regressions.7 See Table 1 and Figure 2.8 See Table 3.9 This figure, constructed using data from World Bank (2005b), uses the samemethodology as is used for Figure 2 for food supplies per capita. See footnote 14.The smoothed curves in this figure are based on log-linear regression analysis. N= 268 for 1977 and 2003 cumulatively; adjusted R 2 = 0.56. The increase in lifeexpectancy due to increase in income and the passage of time are bothsignificant at the 99.9 per cent level.10 And references therin. See Abstract and pp 13–15.11 Health adjusted life expectancy is the life expectancy adjusted downward toaccount for the degradation in the quality of life due to ill health. It is calculatedby subtracting a portion of years of ill-health (weighted according to severity)from the expected (unadjusted) life expectancy to give the equivalent years ofhealthy life.12 Figure 5 uses data from WRI (2005) for 1950–55 and 1955–60 (plotted as 1952.5,and 1957.5, respectively). For Russia, it plotted the WRI data for 1960–65 and1965–70 as 1962 and 1967 data. The multiple years reflect five-year averages.The rest of the data are from World Bank (2005b).13 See, e.g., Pritchett and Summers (1996); World Bank (1993).14 The curves in Figure 6 were fitted using a log-log relationship. N = 271 andadjusted R 2 = 0.77 with a dummy variable to distinguish data for the differentyears. The lowering of the curve over time is consistent with the creation anddiffusion of new and existing-but-underused technologies. Both the lowering ofthe infant mortality with time and with the level of GDP per capita aresignificant at the 99.9 per cent level.15 Figure 8 is based on data from 1990 and 2002 from World Bank (2005b) usinglog-log regression with a dummy variable to account for the data from thedifferent years. The cumulative N = 180, and the adjusted R 2 = 0.58. The shift inthe curve from 1990 to 2002 and the dependence of post-secondary enrolmenton income levels are significant at the 99.9 per cent level and are probablyowing to increasing knowledge about the benefits of education and thewillingness and ability of families and societies to incur the costs of longerperiods of education.16 As noted previously, the index uses the logarithm of GDP per capita.17 GDP per capita trends are based on constant, PPP-adjusted <strong>International</strong> dollars(World Bank 2005b).
Notes 26718 The decline in their GDP per capita was largely due to a drop in the price of oilduring this period.19 The following data sources were used: for life expectancy, Haines (1994) for1850–1900, Bureau of the Census (1975) for 1900–1970, Bureau of the Census(various years) for 1971–1979, CDC (2004) for 1980–2002; for literacy, Costa andSteckel (1997), and Bureau of the Census (1975) for 1900–1970; for GDP percapita (in constant 1990 <strong>International</strong> dollars), Maddison (2005a) for 1820 to1990, and GGDC&CB (2005) for 1990–2002.20 Figure 12, based on data from the World Bank (2005b), is constructed usinglinear regression for the smoothed curves, with a dummy variable to distinguish1975 data from 2003 data. Cumulative N = 258, and adjusted R 2 = 0.47. Thecoefficients, which indicate that cereal yield increases with both time andeconomic development, are both significant at the 99.9 per cent level.21 This is over and above their level of production and stocks at hand.22 Bairoch defines manufacturing industry as industry in general except mining,construction, electricity, gas, and water.23 This is calculated from GDPs provided by Maddison (2005a) for 1700 and 2001,and assumes a uniform (exponential) annual growth rate from 1700–1820 tocalculate the GDP per capita for 1800.2 South Africa’s healthcare under threat1 Republic of South Africa, South African Statistics 2004/05 (Pretoria: StatisticsSouth Africa, 2005), p. 8.8, Table 8.3. Figures for private hospitals are dated June2004 and those for semi-private and public hospitals August 2003. Minehospitals are not included in the figures. According to Statistics South Africathere are 29 semi-private hospitals with 5 889 beds. For the purpose of thispaper semi-private hospitals and beds have been included as public hospitalssince they are “private” only in the sense that they are operated by privatecompanies and charities under contract to government, with the bulk of fundingfrom government. According to the Hospital Association of South Africa (HASA),which represents the majority of private hospitals in the country, there are 200private hospitals with 26 000 private beds.2 Traditional medicine helps with Aids, Mail and Guardian, 30 March 2004.3 Deadly Denial, Time – Europe Edition: 19 April 2004, Volume 163, No 16. Alsosee: John Kane-Berman, Beyond a Joke (Johannesburg: South African Institute ofRace Relations, Fast Facts No3 / March 2004.)4 John Kane-Berman, Beyond a Joke (Johannesburg: South African Institute of RaceRelations, Fast Facts No3/March 2004.)5 Information on the contracts was posted on the company websites at the timeof writing.6 Anthony Browne, NHS Cases pay for Quick Ops in South Africa (London: TheObserver, March 17, 2002.).7 Thomas Sowell, Tax cuts do what? (New York: Opinion Journal – From the WallStreet Journal Editorial Page, 29 February 2004).
268 Fighting the Diseases of Poverty8 The author underwent MRI scans in 2000 and in 2005 and in both instances theprocedures were done within hours after referral to the MRI facility by thedoctor.9 Waiting your turn: Hospital Waiting Lists in Canada (Vancouver, B.C: FraserInstitute: 2004), p.4.10 James Bartholomew, Six months wait for an MRI scan. (April 19, 2005) Retrieved:August 22, 2005 from http://www.thewelfarestatewerein.com/archives/2005/04/six_months_wait.php. Also see: Nigel Hawkes, Go private or wait 80 weeks,patient told (London: The Times Online, 18 June 2005). Retrieved: August 22, 2005from http://www.timesonline.co.uk/article/0,,2-1659149,00.html.11 Manto concerned about high cost of health care (Johannesburg: Mail and Guardian,July 11, 2005.).12 Treatment Action Campaign, Minister Must Commit to Purchasing Interim Supply ofAntiretroviral Medicines to Avoid Court Case. Treatment Action CampaignNewsletter, 16 March 2004.13 Republic of South Africa, South African Yearbook 2003/04 (Pretoria: GovernmentCommunications: 2003), p. 374.14 On the view that the introduction of new health-care technology is an obstacleto providing universal care and should be limited to make health care availableto all see: National Department of Health, Inquiry into the various Social SecurityAspects of the South African Health System (Pretoria: National Department ofHealth, May 2002.), p. 42.3 Corruption in public health1 When all three governance measures are jointly regressed on infant mortalityand per cent measles immunization, only government commitment and issignificant and consistently shows the expected sign.2 Low demand for immunization occurs in developed countries as well, whichaccounts for the legal requirement in the US that children must be immunizedbefore they enter day care or school. In the rest of the OECD governments takeresponsibility for ensuring immunization coverage.3 It is counter-intuitive that only 15% of the Indian public and 9% of the Kazakpublic perceive corruption in the health sector when they ranked it so highly onperceptions of corruption in the sector. This bears further investigation.4 They found that 26% of positions and 41% of physicians slots were vacant,suggesting that the total available stock was already below what wasdemographically required and budgeted.5 The Bolivia survey collected data from 2888 women in 106 municipalities; theMoldova survey consisted of 390 interviews with physicians, nurses andpatients in the capital, Chisinau, and two provinces; the Albanian householdsurvey surveyed 3 provinces; the Poland survey was only of Gdansk andWroclaw cities; and, the Kazakh hospital survey interviewed 1508 dischargedpatients from three Almaty City hospitals.
Notes 2694 The diseases of poverty and the 10/90 gap1 Available at http://www.who.int/intellectualproperty/documents/thereport/en/index.html2 Accessed at: http://www.aeras.org/3 Accessed at: http://idri.org/page.php?pg_page_id=14 Drugs in development by the following PPPs: Bio Ventures for Global Health,Pharmaprojects, MMV, GATB, DNDi.5 Ibid.6 http://www.who.int/mediacentre/factsheets/fs117/en/7 http://www.who.int/vaccines/en/pertussis.shtml8 http://www.who.int/mediacentre/factsheets/fs101/en/9 Victora CG., et al., Applying an equity lens to child health and mortality: more of thesame is not enough, Lancet, 2003; 362: 233–4110 The study assessed the size and impact of tariffs and taxes on drugs importedfrom the EU; taxes and tariffs on drugs imported from elsewhere may be subjectto different rates of taxes and tariffs.11 Poor countries are not members of the WTO Pharmaceutical Agreement, a 22member agreement, concluded during the Uruguay Round, which has led to thereciprocal elimination of tariffs (dubbed ‘zero-for-zero’) on approximately 7,000products (European Commission, 2003 and 2002).12 The East African Community (EAC) is the regional intergovernmentalorganisation of the Republics of Kenya, Uganda and the United Republic ofTanzania with its headquarters in Arusha, Tanzania. The EAC website is:http://www.eac.int/13 Information regarding the EAC Customs Union Tariffs scheme can be accessed at:http://www.eac.int/EAC_customs_U.htm14 http://allafrica.com/stories/200502230903.html15 European Commission, 2003. Applied customs rates were found for each of 27HS numbers. To obtain and average customs rate per country, these numberswere arithmetically added without weighting them. The same process was usedto calculate the average rates of VAT and other duties.5 Increasing access to medicines1 Alternate Solutions Institute, Pakistan.2 Imani, Ghana.3 Free Market Foundation, South Africa.4 Global Biosciences Development Institute, USA.5 ESEADE University, Argentina.6 Instituto Libertad y Progreso, Colombia.7 Liberty Institute, India.8 Minimal Government, Manila, Philippines.9 Fundación Atlas 1853, Argentina.10 <strong>International</strong> <strong>Policy</strong> <strong>Network</strong>, UK.11 Instituto Libre Empresa, Peru.12 Instituto Liberdade, Brazil.
270 Fighting the Diseases of Poverty13 Africa Fighting Malaria, South Africa.14 Jabu Mhlabane. Nearly 50 Mpumalanga doctors implicated in medicine theft(Middelburg, South Africa: African Eye News Service, 13 February 2003). (Publishedon the website of LowveldInfo.com).15 The study assessed the size and impact of tariffs and taxes on drugs importedfrom the EU; taxes and tariffs on drugs imported from elsewhere may be subjectto different rates of taxes and tariffs.16 Poor countries are not members of the WTO Pharmaceutical Agreement, a 22member agreement, concluded during the Uruguay Round, which has led to thereciprocal elimination of tariffs (dubbed ‘zero-for-zero’) on approximately 7,000products (European Commission, 2003 and 2002).17 The East African Community (EAC) is the regional intergovernmentalorganisation of the Republics of Kenya, Uganda and the United Republic ofTanzania with its headquarters in Arusha, Tanzania. The EAC website is:http://www.eac.int/18 Information regarding the EAC Customs Union Tariffs scheme can be accessed at:http://www.eac.int/EAC_customs_U.htm19 http://allafrica.com/stories/200502230903.html20 European Commission, 2003. Applied customs rates were found for each of 27HS numbers. To obtain and average customs rate per country, these numberswere arithmetically added without weighting them. The same process was usedto calculate the average rates of VAT and other duties.21 While there are some countries where the costs of introducing a patent systemmay temporarily outweigh the benefits, this applies only to those countrieswithout a substantial knowledge-based industry. For those countries withincipient or extant knowledge-based industries, such as India, China, Brazil andSouth Africa, the benefits of introducing a patent system will quickly outweighthe costs.22 McArthur (1999) shows that in industries with relatively stringent protection forintellectual property, capital spending is higher, the demand for high qualitygoods for export and the ratio of skilled to unskilled workers both increase overtime. Those same incentives that exist for investment in industries that doenjoy relatively high levels of intellectual property protection tend not to existwhen that protection does not exist or is abandoned. McArthur, W. M.D.,Intellectual Property Rights and the Pharmaceutical Industry, The Fraser Institute,1999, pp. 85–104.23 SCRIP data.24 http://www.businessweek.com/magazine/content/05_16/b3929068.htm25 http://www.advocate.com/news_detail_ektid19293.asp26 http://www.sedb.com/edbcorp/sg/en_uk/index/in_the_news/press_releases/2004/singapore_s_biomedical.html27 http://drugresearcher.com/news/printNewsBis.asp?id=5772228 http://www.rbm.who.int/cmc_upload/0/000/015/364/RBMInfosheet_9.htm29 Or alternatively: novelty, inventive step and industrial application.30 In the con<strong>text</strong> of the debates over patents on genetic sequences and researchtools, if some countries allow patents and others don’t, then – other thingsbeing equal – over time it will become clear which countries are more conducive
Notes 271to high-levels of research and development into down-stream innovations. Ofcourse not all other things are equal, but to the extent that this competition isalready taking place, the winner seems to be the country with the broaderpatent system: the United States. Time will tell.31 Common practice for the Food and Drug Administration in the United States is 5years, which is also the period agreed upon in many of the bilateral free tradeagreements it has recently signed.32 Potential cost savings for companies relying on data would be in the order of$450 million, the average costs associated with clinical trials for each approveddrug. Some estimates show that these costs have more than tripled in the pastfifteen years.33 When data exclusivity is weak, it can also drive research-based pharmaceuticalresearch industries out, as has happened in the past few years in Israel. A oncethriving research destination, the lack of data exclusivity – the result of apowerful generics lobby – had driven research elsewhere. In September 2005,the legislation was changed to provide some data protection.34 In legal terms, the specific element that is crucial to the firm’s ability to pricedifferentiate within a market is the international patent exhaustion principle. Ifpatent rights are exhaustible the patentee must renounce the right to itsproduct the moment it is first sold, giving the first purchaser the ability topotentially resell at a higher price. The TRIPS agreement does little to clear upthis pressing issue. (http://www.wto.org/english/tratop_e/trips_e/factsheet_pharm02_e.htm)35 A good example of successful price discrimination without re-exportation comesfrom the example of bronchodilators in South Africa. Here, Governmentpurchases accounted for 66 per cent of sales volume, but only 33 per cent ofrevenues. In this case patents show that, if parallel importation is controlled for,good health can be promoted. Reekie, W.D., “South Africa’s Battle with AIDS andDrug Prices”, National Center for <strong>Policy</strong> Analysis, Dallas, TX, Brief 334, 2000.36 http://www.freemarketfoundation.com/ShowArticle.asp?ArticleType=Publication&ArticleID=109337 The most recent example comes from Brazil, where the head of the country’sAIDS program cited an increasingly high percentage of its AIDS budget, which isdesigned to offer Brazilians with the disease (some 600,000) free treatment, hadto be devoted to pharmaceutical purchases. Because of this, Brazil threatened toissue compulsory licenses on the key drugs that combine to form anti-retro viraltreatments. http://news.bbc.co.uk/1/hi/health/4059147.stm, accessed 06/01/200538 ‘Neglected diseases’ are defined by the WHO as African Trypanosomiasis,leishmaniasis and Chagas disease.6 Cost effective means of fighting the diseases of poverty1 Alternate Solutions Institute, Pakistan.2 Imani, Ghana.3 Free Market Foundation, South Africa.4 Global Biosciences Development Institute, USA.
272 Fighting the Diseases of Poverty5 ESEADE University, Argentina.6 Instituto Libertad y Progreso, Colombia.7 Liberty Institute, India.8 Minimal Government, Manila, Philippines.9 Fundación Atlas 1853, Argentina.10 <strong>International</strong> <strong>Policy</strong> <strong>Network</strong>, UK.11 Instituto Libre Empresa, Peru.12 Instituto Liberdade, Brazil.13 Africa Fighting Malaria, South Africa.14 http://www.who.int/hiv/AAI_fs_4Q2005.pdf15 United States Leadership Against HIV/AIDS, Tuberculosis, and Malaria Act of2003.16 http://online.wsj.com/article/0,,SB111644800426237250,00.html17 WHO/CDS/WHOPES/GCDPP/2004.6, A generic risk assessment model forinsecticide treatment and subsequent use of mosquito nets.18 http://www.cdc.gov/malaria/control_prevention/vector_control.htm19 http://www.rotavirusvaccine.org/vaccine-facts.htm7 Counterfeit medicines in LDCs: problems and solutions1 http://www.who.int/mediacentre/factsheets/fs275/en/2 Liza Gibson, “Drug regulators study global treaty to tackle counterfeit drugs,”British Medical Journal Volume 328, Number 486 February 28, 2004.3 European Federation of Pharmaceutical Industries and Associations, “Counterfeitmedicines”, available at http://www.efpia.org/2_indust/counterfeitdrugs.pdf4 http://www.manilatimes.net/national/2005/aug/16/yehey/life/20050816lif1.html5 http://bmj.bmjjournals.com/cgi/content/full/327/7424/1126-a6 Fackler M (2002 July 29) China’s fake drugs kill thousands. San FranciscoExaminer7 http://www.who.int/entity/bulletin/volumes/81/12/WHONews.pdf8 http://bmj.bmjjournals.com/cgi/content/full/327/7412/414-b9 http://pharmalicensing.com/articles/disp/1120475327_42c918bf0904810 Selling cheap generic drugs, India’s copycats irk industry, available athttp://chakra.org/articles/2000/12/03/indian/drugs11 Latin America Battles Counterfeit Drug Threat, Daily <strong>International</strong> PharmacyAlert: Washington Business Information, 2(292), 2006.12 http://www.efpia.org/2_indust/counterfeitdrugs.pdf13 Fake drugs worry authorities, firms, The Russia Journal, 2000, 3(4) 4714 South China Business Journal, June/July/August, 2002.15 http://www.prospect.org/web/page.ww?section=root&name=ViewWeb&articleId=1065016 http://www.freemarketfoundation.com/ShowArticle.asp?ArticleType=Publication&ArticleID=109317 Very often, the supply of drugs is reduced by the Byzantine and tortuousregulations that emanate from local drug approval agencies. These regulationsmake it very difficult for manufacturers wishing to export to overseas markets
Notes 273to register new products, thereby creating a gap in supply. This gap providesanother opportunity for counterfeiters. One example is South Africa’s MedicalControl Council, which requires that all new medicines attain its own regulatoryapproval before they can be marketed in the country – even if they have alreadybeen approved by reputable foreign regulatory bodies such as the FDA. However,the extreme inefficiency of the FDA means that drugs that have already beenregistered for use in the US, EU and Japan wait an average of 39 months forapproval in the South African system. If such delays occur on already existingmedicines, it presents a clear incentive to counterfeiters to meet the artificiallypent up demand in the market.18 These artificial price inflators can price may patients out of treatment, and givethem an incentive to look to cheaper counterfeit medicines to meet their needs.Abolishing these levies would return medicines to their natural prices, therebyundermining the potential profits – and incentives – of counterfeiters.8 The value of vaccination1 The authors thank Roger Glass, Tore Godal, Yuki Murakami, SreekanthRamachandra, Larry Rosenberg, and Josh Salomon for their assistance andcomments. Financial assistance from the Global Alliance for Vaccination andImmunization is greatly appreciated. Earlier versions of this article werepresented at the Sixth <strong>International</strong> Rotavirus Symposium in Mexico City (June2004), a GAVI-funded seminar on “Development and Deployment of VaccinesAgainst Poverty-Related Diseases” in Bergen, Norway (September 2004), and the23rd annual meeting of the European Society for Paediatric Infectious Diseasesin Valencia, Spain (May 2005).2 A notable sidelight to this story is that GlaxoSmithKline has now developedRotarix, a new rotavirus vaccine (which does not appear to have intussusceptionas a side effect), which has already been introduced in Mexico and will soon beintroduced in other developing countries. See Technology Review, June 2005,available at http://www.technologyreview.com/articles/05/06/tri/tri_vaccine.asp?p=1.3 http://www4.nas.edu/news.nsf/6a3520dc2dbfc2ad85256ca8005c1381/e82b28891131e63e85256fab006fb1f3?OpenDocument4 See, for example, Coudeville L (1999): The value of varicella vaccination inhealthy children: cost-benefit analysis of the situation in France. Vaccine 1999 Jan17:2 142–51; Ekwueme DU (2000) Economic evaluation of use of diphtheria,tetanus, and acellular pertussis vaccine or diphtheria, tetanus, and whole-cellpertussis vaccine in the United States, 1997. Arch Pediatr Adolesc Med 2000 Aug154:8 797–803; Pelletier L (1998): A benefit-cost analysis of two-dose measlesimmunization in Canada. Vaccine 1998 May-Jun 16:9–10 989–96; TormansHIV/AIDS (1998): Economic evaluation of pertussis prevention by whole-cell andacellular vaccine in Germany. Eur J Pediatr 1998 May 157:5 395–401; Hussain,I.HM.I , Syed Aljunid, Sofiah, A., Ong, L.C, Choo, K.E, Musa, M.N., Teh, K.H.& Ng,H.P. (1999): Cost-Benefit Analysis Of Haemophilus Influenzae VaccinationProgramme In Malaysia. Buletin Kesihatan Masyarakat Jilid 5, 1999; Ulla K
274 Fighting the Diseases of PovertyGriffiths, Lara J Wolfson, Arshad Quddus, Mohammed Younus, Rehan A Hafiz(2004): Incremental cost-effectiveness of supplementary immunization activitiesto prevent neonatal tetanus in Pakistan. Bulletin of the World HealthOrganization, September 2004, 82 (9); Uyl-de Groot CA, Vermorken JB, Hanna MGJr, Verboom P, Groot MT, Bonsel GJ, Meijer CJ, Pinedo HM. (2005). Immunotherapywith autologous tumor cell-BCG vaccine in patients with colon cancer: aprospective study of medical and economic benefits. Vaccine.Vol.23(17–18):2379–87; Navas E, Salleras L, Gisbert R, Dominguez A, Timoner E,Ibanez D, Prat A. (2005). Cost-benefit and cost-effectiveness of the incorporationof the pneumococcal 7-valent conjugated vaccine in the routine vaccinationschedule of Catalonia (Spain). Vaccine. Vol. 23(17–18):2342–8; McIntosh ED,Conway P, Willingham J, Hollingsworth R, Lloyd A. (2005). Pneumococcalpneumonia in the UK – how herd immunity affects the cost-effectiveness of 7-valent pneumococcal conjugate vaccine (PCV). Vaccine. Vol. 23(14):1739–45; Jean-Jasmin LM, Lynette SP, Stefan M, Kai CS, Chew FT, Wah LB. (2004). Economicburden of varicella in Singapore – a cost benefit estimate of implementation of aroutine varicella vaccination. Southeast Asian J Trop Med Public Health. Vol.35(3):693–6; Uzicanin A, Zhou F, Eggers R, Webb E, Strebel P. (2004). Economicanalysis of the 1996–1997 mass measles immunization campaigns in SouthAfrica. Vaccine. Vol. 22(25–26):3419–26; Shepard DS, Suaya JA, Halstead SB,Nathan MB, Gubler DJ, Mahoney RT, Wang DN, Meltzer MI. (2004). Costeffectivenessof a pediatric dengue vaccine. Vaccine. Vol. 22(9–10):1275–80. Twostudies in developed countries, on the other hand, showed that programs werenot cost-effective: Allsup S, Haycox A, Regan M, Gosney M. (2004). Is influenzavaccination cost effective for healthy people between ages 65 and 74 years? Arandomised controlled trial. Vaccine. Vol. 23(5):639–45; Melegaro A, EdmundsWJ. (2004). The 23-valent pneumococcal polysaccharide vaccine. Part II. A costeffectivenessanalysis for invasive disease in the elderly in England and Wales.Eur J Epidemiol. Vol. 19(4):365–75.5 This approach assumes that health is a uni-dimensional variable that is reflectedin mortality and morbidity measures. Both microeconomic and macroeconomicstudies of the effect of health on labor productivity use this approach, whichenables a single measure to be used as an indicator of an individual’s or acommunity’s health. In our study, the health improvements generated byvaccination are therefore taken to have economic impacts similar to those ofhealth improvements on average.9 The World Health Organisation: a time for reconstitution1 This statement reflects the practicalities of the situation. As a purely conceptualmatter, the liability for that added protection could be placed on either theresidents of the poorer lands or the residents of the wealthier lands. Thereciprocal nature of externality relationships is developed in Ronald H. Coase,“The Problem of Social Cost,” Journal of Law and Economics 3 (October 1960),1–44.
Notes 2752 Snow, B et al., “The global distribution of clinical episodes of Plasmodiumfalciparum malaria”, Nature 434, 214–217 (10 March 2005)3 For an emphasis on monetary contraction, see Milton Friedman and Anna J.Schwartz, A Monetary History of the United States (Princeton: Princeton UniversityPress, 1963), esp. pp. 299–419. For an emphasis on credit expansion, see MurrayRothbard, America’s Great Depression (Kansas City: Sheed Andrews, 1963). For anemphasis on regulation, see Robert J. Barro, “Second Thoughts on KeynesianEconomics, “ American Economic Review, Proceedings, 69 (May 1979): 54–59.4 Lecture in 1755, quoted by Dugald Stewart5 On the positive relationship between freedom and wealth worldwide, see JamesGwartney and Robert Lawson, Economic Freedom of the World (Vancouver: FraserInstitute, 2004).6 For a sample of valuable work on this matter, see William Easterly, The IllusiveQuest for Growth (New York: St. Martin’s Press, 2001); Peter Bauer, FromSubsistence to Exchange (Princeton: Princeton University Press, 2000); Peter J.Boettke, ed., The Collapse of Development Planning (New York: New YorkUniversity Press, 1994); Deepak Lal, The Poverty of Development Economics(Cambridge: Harvard University Press, 1983); and Peter T. Bauer and Basil S.Yamey, The Economics of Underdeveloped Countries (Cambridge: CambridgeUniversity Press, 1957).7 For exemplary treatises on bureaucracy, see Gordon Tullock, The Politics ofBureaucracy (Washington: Public Affairs Press, 1965); William A. Niskanen,Bureaucracy and Representative Government (Chicago: Aldine, 1971); AnthonyDowns, Inside Bureaucracy (Boston: Little, Borwn, 1967); and Thomas E.Borcherding, ed. Budgets and Bureaucrats (Durham, NC: Duke University Press,1977).
SourcesIntroductionAdelman, C., Norris, J., & Weicher, S., (2005), “The full cost of HIV/AIDS treatment”,Hudson Institute White Paper, 2nd Edition, May 2005, Hudson Institute:Washington DCBloom, D., & Williamson, J., (1997), “Demographic change and human resourcedevelopment”, In Asian Development Bank, Emerging Asia, ManilaBremen, J., (2001), “The ears of hippopotamus: manifestations, determinants, andestimates of the malaria burden,” American Journal of Tropical Hygiene, 64 (1&2).Center for Global Development (2005): “Making Markets for Vaccines: From Ideas toAction”, CGD, Washington DC.Dollar, D., (1995), “Outward-oriented developing countries really do grow morerapidly: evidence from 95 LDCs, 1976–85”, Economic Development and CulturalChange 523–44.Deaton, A., (2003), “Health, inequality and economic development”, Journal ofEconomic Literature, 41: 113–58.Dollar, D., & Kraay, A., (2001), Trade, growth, and poverty, <strong>Policy</strong> Research WorkingPaper No 2199, Washington DC: World BankFilmer, D., & Pritchett, L., (1999), “The impact of public spending on health: doesmoney matter?” World Bank.Frankel, J., & Romer, D., (1999), “Does trade cause growth?” American EconomicReview June:379–99Gramiccia, G., & Beales, P., (1988), “The recent history of malaria control anderadication,” in Wersdorfer, W., & McGregor, I., eds. Malaria: principles andpractice of malariology. New York: Churchill LivingstoneGwatkin, F., (1980), “Indications of change in developing country mortality trends:the end of an era?” Population and development review, 6(4), 615–44Kenny, C., (2005), “Why are we worried about income? Nearly everything thatmatters is converging”, World Development, 33(1): 1–19.Malaria Consortium, (2002), “Roll Back Malaria to Date,” available athttp://www.rbm.who.int/cmc_upload/0/000/015/905/ch2.pdfMarmot, M., Shipley, M., & Rose, G., (1984), Inequalities in death – specificexplanations of a general pattern? Lancet; i: 1003–6Marmot M., Davey Smith, G., Stansfeld, S., Patel, C., North, F., Head, J., White. I.,Brunner, E., Feeney, A., (1991), “Health inequalities among British civil servants;the Whitehall II study”, Lancet, 337: 1387–1393.
Sources 277Karoly, L., Greenwood, P., Everingham, S., Hoube, J., Kilburn, M., Rydell, C., Sanders,M., Chiesa, J., eds, (1998), Investing in our children: what we know and don’t knowabout the cost and benefits of early childhood interventions, Santa Monica,California, RAND.Noumba, I., (2004), “Are wealthier nations healthier nations? A panel data approachto the determination of human development in Africa”, African Development &Poverty Reduction: The Macro-Micro linkage, Forum Paper, Cornell UniversityPritchett, L., & Summer, L., (1996), “Wealthier is Healthier”, Journal of HumanResources, 31(4): 841–868Ridley, R., (2002), “Medical need, scientific opportunity and the drive for antimalarialdrugs,” Nature, 415(7).Sachs, J. & Warner A., (1995), “Economic reform and the process of globalintegration”, Brookings Papers on Economic Activity (1):1–118Wagstaff, A., (2002), “Inequalities in health in developing countries: swimmingagainst the tide?” World Bank <strong>Policy</strong> Research Working Paper 2795.WHO, (2002), World Health Report, Geneva: WHO.Wilkinson, R., (1999), “Putting the picture together: prosperity, redistribution, healthand welfare”, in Social Determinants of Health, eds Marmot, M., & Wilkinson, R.,OUP, Oxford.Williamson, J., (1990), Coping with city growth during the industrial revolution,Cambridge, UK: Cambridge University PressWorld Bank, 2005. World Development Indicators available at http://devdata.worldbank.org/dataonline/Zumla, A. & Grange, M., (2001), “Multidrug resistant tuberculosis- can the tide beturned?” Lancet Infectious Diseases, vol. 1.1 Wealth, health and the cycle of progressAusubel, J. H., and A. Grübler. 1995. Working Less and Living Longer. TechnologicalForecasting and Social Change 50: 113–31.Barney, Gerald O., ed. 1980. Global 2000 Report to the President. New York:Pergamon Press.Barro, R. J. 1997. The Determinants of Economic Growth: A Cross-Country EmpiricalStudy. Cambridge, MA: MIT Press.Bairoch, Paul. 1982. “<strong>International</strong> Industrialization Levels from 1750 to 1980.”Journal of European Economic History 11: 269–333.Barbour, I. G. 1980. Technology, Environment, and Human Values. New York: Praeger.Becker, Charles, and David Bloom. 1998. “The Demographic Crisis in the FormerSoviet Union: Introduction.” World Development 26: 1913–19.Bhalla, S. 2002. Imagine There Is No Country: Poverty, Inequality and Growth in the Eraof Globalization. Washibgton, DC: Institute for <strong>International</strong> Economics.Bloom, Barry R. 1999. “The Future of Public Health.” Nature 402 (supplement):C63–64.Brown, Lester R. 1998. “The Future of Growth” in The State of the World 1998, ed.Lester R. Brown, Christopher Flavin, and Hilary F. French. New York: W. W.Norton, 3–20.
278 Fighting the Diseases of PovertyBureau of the Census. 1975. Historical Statistics of the United States, Colonial Times to1970. Washington, DC: Government Printing Office.——— . Various years. Statistical Abstract of the United States. Washington, DC:Government Printing Office.——— . 2004. Statistical Abstract of the United States, 2004–2005. Washington, DC:Government Printing Office.Burnette, J., and J. Mokyr. 1995. “The Standard of Living through the Ages” in TheState of Humanity, ed. Julian L. Simon. Cambridge, MA: Blackwell, 135–48.Centers for Disease Control and Prevention (CDC) 2002. HIV/AIDS Surveillance Report,vol. 13 (no. 2), Table 31.——— . 2003. HIV/AIDS Surveillance Report, vol. 14 (no. 2), Table 7.——— . 2004. Health, United States, 2004 With Chartbook on Trends in the Health ofAmericans with Special Feature on Drugs. Table 27 (for life expectancy).——— . 2005. “Cases of HIV infection and AIDS in the United States, 2003.”HIV/AIDS Surveillance Report, vol. 15, Table 7. Available athttp://www.cdc.gov/hiv/stats/2003SurveillanceReport.htm.Costa, Dora L., and Richard H. Steckel. 1997. “Long-Term Trends, Health, Welfare andEconomic Growth in the United States” in Health and Welfare duringIndustrialization, ed. Richard H. Steckel and Roderick Floud. Chicago: Universityof Chicago Press, 47–89.Daily Mail and Guardian. 1998. Zim Commander “Not Killed in DRC.” December 15.Available http://www.mg.co.za/mg/za/archive/98dec/15decpmnews.html.Accessed July 26, 2000.Dollar, David, and Aart Kraay. 2000. Growth Is Good for the Poor. TransitionNewsletter. World Bank, Development Economics Research Group. Availablehttp://www.worldbank.org/research/growth/absdollakray.htm AccessedSeptember 3, 2000.Easterlin, Richard A. 1996. Growth Triumphant: The Twenty-First Century in HistoricalPerspective. Ann Arbor: University of Michigan Press.Easterly, William, and Sergio T. Rebelo. 1993. Fiscal <strong>Policy</strong> and Economic Growth: AnEmpirical Investigation. Journal of Monetary Economics 32(3): 417–58.Economist. 2004. “More or Less Equal?” The Economist, March 11, 2004.Ehrlich, Paul R. 1968. The Population Bomb. New York: BallantineBooks.Floud, R., and B. Harris. 1997. “Health, Height, and Welfare: Britain, 1700–1980” inHealth and Welfare during Industrialization, ed. Richard H. Steckel and RoderickFloud. Chicago: University of Chicago Press, 91–126.Fogel, R. W. 1995. “The Contribution of Improved Nutrition to the Decline ofMortality Rates in Europe and America” in The State of Humanity, ed. Julian L.Simon. Cambridge, MA: Blackwell, 61–71.——— . 2000. The Fourth Great Awakening and the Future of Egalitarianism. Chicago:University of Chicago Press.——— . 2003. Changes in the Process of Aging during the Twentieth Century: Findingsand Procedures of the Early Indicators Project. National Bureau of EconomicResearch Working Paper 9941, Cambridge, MA: NBER.Food and Agricultural Organization (FAO). 1996. Assessment of Feasible Progress inFood Security. Technical Background Documents 12–15, vol. 3. Rome: Italy.——— . 2002. The State of Food and Agriculture 2002. Rome, Italy.
Sources 279——— . 2004. The State of Food Insecurity in the World 2004. December.Availablehttp://www.fao.org/documents/show_cdr.asp?url_file=/docrep/007/y5650e/y5650e00.htm. Accessed July 12, 2005.——— . 2005. FAOStat. Available http://apps.fao.org. Accessed July 3, 2005.Frankel, Jeffrey A., and David Romer. 1999. “Does Trade Cause Growth?” AmericanEconomic Review (June): 379–99.Freedom House. 2002. Democracy’s Century. New York: Freedom Hoise.——— . 2005. Freedom in the World 2005. New York: Freedom House.Goklany, Indur M. 1995. “Strategies to Enhance Adaptability: Technological Change,Sustainable Growth and Free Trade.” Climatic Change 30: 427–49.——— . 1998. “Saving Habitat and Conserving Biodiversity on a Crowded Planet.”BioScience 48: 941–53.——— . 1999a. Clearing the Air: The Real Story of the War on Air Pollution.Washington, DC: Cato Institute.——— . 1999b. “The Future of Industrial Society.” Paper presented at the<strong>International</strong> Conference on Industrial Ecology and Sustainability, University ofTechnology of Troyes, Troyes, France, September 22–25. Available from author,Office of <strong>Policy</strong> Analysis, Dept. of the Interior, 1849 C St. NW, Washington, DC20240.——— . 1999c. “Meeting Global Food Needs: The Environmental Trade-OffsBetween Increasing Land Conversion and Land Productivity.” Technology 6:107–30.——— . 2000. “Potential Consequences of Increasing Atmospheric CO2Concentration Compared to Other Environmental Problems.” Technology 7S:189–213.——— . 2002. “The Globalization of Human Well-Being.” <strong>Policy</strong> Analysis (no. 447),Washington, DC: Cato Institute.Groningen Growth and Development Centre and The Conference Board (GGDC&CB).2005. Total Economy Database. Available at .Guardian. 2000. Malaria Impedes Development in Africa. May 12. Copy on file withthe author.Gwartney, James, Randall Holcombe, and Robert Lawson. 1998. “The Scope ofGovernment and the Wealth of Nations.” Cato Journal 18: 163–90.Gwartney, James, and Robert Lawson. 2004. Economic Freedom of the World 2004Annual Report. Vancouver, BC: Fraser Institute.Haines, Michael R. 1994. Estimated Life Tables for the United States, 1850–1900.Historical Paper 59. Cambridge, MA: National Bureau of Economic Research.Hill, K. 1995. “The Decline in Childhood Mortality” in The State of Humanity, ed.Julian L. Simon. Cambridge, MA: Blackwell, 37–50.Lee, J., and W. Feng, W. 1999. Malthusian Models and Chinese Realities: The ChineseDemographic System, 1700–2000. Population and Development Review 25: 33–65.Lerner, M., and O. W. Anderson. 1963. Health Progress in the United States, 1900–1960.Chicago: University of Chicago Press.Maddison, A. 1995. Monitoring the World Economy, 1820–1992. Paris: OECD.——— . 1998. Chinese Economic Performance in the Long Run. Paris: OECD.——— . 1999a. “Poor Until 1820.” Wall Street Journal, The Millennium, January 11,R54.
280 Fighting the Diseases of Poverty——— . 1999b. “Economic Progress: The Last Half Century in HistoricalPerspective.” In Castles, Ian (ed), Facts and Fancies of Human Development,Occasional Paper Series 1/2000, Canberra: Academy of Social Sciences inAustralia, pp. 1–22.——— . 2005a. The World Economy: Historical Statistics. Available online athttp://www.ggdc.net/~maddison/Historical_Statistics/horizontal-file.xls.Accessed July 1, 2005.——— . 2005b. “Memorandum.” In The economics of climate change: 2nd report ofsession 2005–06: Vol. 2 Evidence. House of Lords papers 2005–06 12-II. London:House of Lords Select Committee on Economic Affairs, pp. 249–256.Malaria Foundation <strong>International</strong>. 2000. Economic Analyses Indicate that the Burden ofMalaria is Great. Executive summary for Harvard University Center for<strong>International</strong> Development and the London School of Hygiene and TropicalMedicine. Available http://www.malaria.org/jdsachseconomic.html. AccessedOctober 2, 2000.Marland, G., T.A. Boden, and R. J. Andres. 2005. Global, Regional, and National CO2Emissions. In Trends: A Compendium of Data on Global Change. Carbon DioxideInformation Analysis Center, Oak Ridge National Laboratory, U.S. Department ofEnergy, Oak Ridge, Tenn., U.S.A.Martin, Joyce A., Betty L. Smith, T. J. Mathews, and Stephanie J. Ventura. 1999.“Births and Deaths: Preliminary data for 1998.” National Vital Statistics 47(25).McEvedy, C., and R. Jones. 1978. Atlas of World Population History. New York: Penguin.Mitchell, B. R. 1992. <strong>International</strong> Historical Statistics: Europe, 1750–1988. New York:Stockton Press.Mitchell, D. O., and M. D. Ingco. 1993. “The World Food Outlook.” Hunger Notes19(Winter 1993–1994): 20–25.National Center for Health Statistics. 2005. National Vital Statistics Report: Births,Marriages, Divorces and Deaths: Provisional Data for 2004, vol. 53 (no. 21), June28.OECD. 1998. Maintaining Prosperity in an Ageing Society. <strong>Policy</strong> Brief 5-1998. Paris.Paddock, W., and P. Paddock. 1967. Famine 1975! America’s Decision: Who Will Survive?Boston, MA: Little, Brown.Preston, S. H. 1995. “Human Mortality throughout History and Prehistory” in TheState of Humanity, ed. Julian L. Simon. Cambridge, MA: Blackwell, 30–36.Pritchett, Lant, and Lawrence H. Summers. 1996. “Wealthier is Healthier.” Journal ofHuman Resources 31: 841–68.Ravallion, Martin, and Shaohua Chen. 1997. “What Can New Survey Data Tell Usabout Recent Changes in Distribution and Poverty?” World Bank Economic Review11(2): 357–82.Ravallion, Martin. 2004. “Pessimistic on poverty?” The Economist, April 7, 2004.Sala-i-Martin, X. 2002. “The World Distribution of Income.” National Bureau ofEconomic Research Working Paper 8933.Seskin, E. P. 1978. “Automobile Air Pollution <strong>Policy</strong>” in Current Issues in U.S.Environmental <strong>Policy</strong>, ed. Paul Portney. Baltimore, MD: Johns Hopkins UniversityPress.Shalala, Donna E. 1998. “Eliminating Racial and Ethnic Health Disparities [sic]”.Speech delivered at the Patricia Harris Public Affairs Program, Howard
Sources 281University, March 13. Available http://www.hhs.gov/news/speeches/HOWARDPH.html. Accessed February 3, 2001.Simon, Julian L., ed. 1995. The State of Humanity. Cambridge, MA: Blackwell.United Nations. 2000. “Security Council Extends Iraq ‘Oil-for-Food’ Program forFurther 186 Days.” Press release SC/6872. June 8. Availablehttp://www.un.org/News/Press/docs/2000/20000608.sc6872.doc.html. AccessedJanuary 31, 2001.United Nations Development Program. 1999. Human Development Report 1999. NewYork: Oxford University Press.——— . 2000. Human Development Report 2000. New York: Oxford University Press.——— . 2004. Human Development Report 2004. New York: Oxford University Press.United Nations High Commission on Refugees. 1998. UNHCR Appeals for Funds forGreat Lakes Operations. Press release. March 2. Availablehttp://www.unhcr.ch/news/pr/pr980302.htm. Accessed July 25, 2000.——— . 1999a. 1999 Global Appeal/Great Lakes. Availablehttp://www.unhcr.ch/fdrs/ga99/overlake.htm. Accessed February 2, 2001.——— . 1999b. 1999 Global Appeal/Southern Africa. Availablehttp://www.unhcr.ch/fdrs/ga99oversaf.htm. Accessed February 2, 2001.United Nations Population Division (UNPD). 2004a. World Population Prospects: The2004 Revision. United Nations Population Division. Availablehttp://esa.un.org/unpp/p2k0data.asp. Accessed July 2, 2005.——— . 2004b. World Population to 2300.U.S. Department of Health and Human Services. 1997. Active Aging: A Shift in theParadigm. Office of Disability, Aging and Long Term Care. May 1997. Availablehttp://aspe.hhs.gov/ daltcp/reports/actaging.htm. Accessed August 7, 2000.Watkins, Shirley R.1997. “Historical Perspective on the School Meals Programs: TheCase for Strong Federal Programs.” Paper presented at Ceres Forum on SchoolMeals <strong>Policy</strong>, Georgetown University Center for Food and Nutrition <strong>Policy</strong>,November 24, Washington, DC. Availablehttp://www.fns.usda.gov/fncs/shirley/speeches/support/sw971124.htm. Accessed August 15, 2000.World Bank. 1993. World Development Report: Investing in Health. New York: OxfordUniversity Press.——— . 1999. World Development Indicators. CD-ROM. Washington, DC: The WorldBank.——— . 2005a. Commodity Prices Pink Sheet, July 2005. Available athttp://siteresources.worldbank.org/INTPROSPECTS/Resources/Pnk_0705.pdf,accessed July 12, 2005.——— . 2005b. World Development Indicators Online athttp://devdata.worldbank.org/dataonline/.World Health Organization. 1999. The World Health Report 1999. Geneva.——— . 2000. The World Health Report 2000. Geneva, Availablehttp://www.who.int/aboutwho/en/promoting/nutrtion.htm. Accessed January 5,2000.World Resources Institute. 1998. World Resources 1998–99 Database. Washington, DC.——— . 2005. Earth Trends. Data online at www.wri.org. Accessed June & July,2005.
282 Fighting the Diseases of Poverty2 South Africa’s healthcare under threatCornell, J., Goudge, J., McIntyre, D., & Mbatsha, S., (2001), National Health Accounts:The Private Sector Report 2001, University of Cape Town, Health Economics Unit.Department of Provincial and Local Government, (2001), Planning andImplementation Management Support System, Pretoria.Doherty, J., Thomas, S., & Muirhead, D., (2002), The National Health Accounts Project:Health Financing and Expenditure in Post-Apartheid South Africa, 1996/7–1998/99,University of Cape Town.Esmail, N., & Walker, M., (2005), How Good is Canadian Health Care? Fraser Institute,Vancouver.Goodman, C., & Herrick, D., (2002), “Twenty Myths about Single-Payer HealthInsurance, <strong>International</strong> Evidence on the Effects of National Health Insurance inCountries Around the World”, National Center for <strong>Policy</strong> Analysis, Dallas.Gore, A., (2002, Future Trends for Medical Schemes in South Africa. Health Wise Seminarheld at Midrand 2002, Sandton: Discovery Health.Government Communication and Information System, (2002), South African YearBook 2002–2003, Pretoria.Hayek, F., (1976), The New Confusion About ‘Planning’, Morgan Guaranty Survey.Hayek, F., (1944), The Road to Serfdom, University of Chicago Press, Chicago.Health Systems Trust, (2003), South African Health Review 2002, Durban.Health Systems Trust, (2004), South African Health Review 2003–2004, Durban.National Department of Health, (2005), The Charter of the Health Sector of theRepublic of South Africa (Revised Draft), Pretoria.National Department of Health, (2002), Inquiry into the various Social Security Aspectsof the South African Health System, Pretoria.National Treasury, (2001), Intergovernmental Fiscal Review 2001, Pretoria.National Treasury, (2003), Intergovernmental Fiscal Review 2003, Pretoria.National Treasury, (2001), Intergovernmental Fiscal Review 2001, Pretoria.National Treasury, (2003), Intergovernmental Fiscal Review 2003, Pretoria.Pipes, S., (2002), “The False Promise of Single-Payer Health Care”, Pacific ResearchInstitute, San Francisco.Reisman, G., (1996), Capitalism Jameson Books, Ottawa.Rothbard, M., (2004), Man, Economy and State with Power and Market, Ludwig vonMises Institute, Auburn, Alabama.Statistics South Africa, (2003), Census 2001: Census in Brief, Pretoria.Statistics South Africa, (2005), South African Statistics 2004/05, Pretoria.von Mises, L., (1990), Economic Calculation in the Socialist Commonwealth, Ludwig vonMises Institute, Auburn, Alabama.3 Corruption in public healthAaby, P. 1995. “Assumptions and Contradictions in Measles and MeaslesImmunization Research: Is Measles Good for Something?” Social Science &Medicine 41(5): 673–686.
Sources 283Alcazar, L and Andrade, R. “Induced Demand and Absenteeism in PeruvianHospitals.” In Di Tella, R. and Savedoff, W. D. (eds.). 2001. Diagnosis Corruption.Washington, DC: Inter-American Development Bank.Alesina, A., A. Devleeschauwer, W. Easterly, S. Kurlat and R. Wacziarg, 2003.“Fractionalization.” Journal of Economic Growth 8(2): 155–94. Data:http://www.stanford.edu/~wacziarg/downloads/fractionalization.xlsAnderson, J. 1999. “Corruption in Latvia: Survey Evidence”. ECA Region. WashingtonD.C. World Bank. Processed.Anderson, J. 2000. “Corruption in Slovakia: Results of Diagnostic Surveys”. WorldBank and the United States Agency for <strong>International</strong> Development. ECA Region.Washington D.C.: World Bank. Processed.Azfar, O. 2005. “Corruption and the Delivery of Health and Education Services.”Mimeo. IRIS Center, University of Maryland, College Park, Maryland. Draft.Azfar, O., and T. Gurgur. 2001. “Does Corruption Affect Health and EducationOutcomes in the Philippines?” Mimeo. IRIS Center, University of Maryland,College Park, Maryland. Draft.Azfar, O., S.Kahkonen and P. Meagher. 2001. “Conditions for Effective DecentralizedGovernance: A Synthesis of Research Findigs.” Mimeo. IRIS Center, University ofMaryland, College Park, Maryland. Draft.Banerjee, A. and E. Duflo. 2005. “Improving Health-Care Delivery in India”. M.I.T.Working Paper. Cambridge, MA: Massachusetts Institute of Technology.Banerjee, A., A. Deaton and E. Duflo (2004) “Wealth, Health and Health Services inRural Rajasthan.” American Economic Review Papers and Proceedings. 94(2)326–330.Barber, S., F. Bonnet and H. Bekedam. 2004. “Formalizing Under-the-Table Payment tocontrol Out-of-Pocket Hospital Expenditures in Cambodia” Health <strong>Policy</strong> andPlanning 19(40 199–208.Bardhan, P. 1997. “Corruption and Development: A Review of Issues.” Journal ofEconomic Literature 35(3) 1310–1346.Barr, A., M. Lindelow and P. Serneels. 2004. “To Serve the Community or Oneself: ThePublic Servant’s Dilemma.” World Bank <strong>Policy</strong> Research Working Paper 3187.Washington D.C.: World Bank.Barro, R. J. and J.-W. Lee. 2000. “<strong>International</strong> Data on Educational Attainment:Updates and Implications.” CID Working Paper No. 42. Cambridge, MA: Centerfor <strong>International</strong> Development, Harvard University. Data:http://www.cid.harvard.edu/ciddata/Appendix%20Data%20Tables.xlsBelli, P. 2002. Formal and Informal Household Spending on Health: A Multi-countryStudy in Central and Eastern Europe.” Harvard School of Public Health,<strong>International</strong> Health Systems Group. Mimeo.Belli, P., and H. Shahriari, and G. Gotzadze. 2004. “Out of pocket and InformalPayments in the Health Sector: Evidence from Georgia”. Health <strong>Policy</strong> 70: 109–23.Belli, P., H. Shahriari, and M. Lewis. 2001. “Institutional Issues in Informal HealthPayments in Poland: Report on the Qualitative Part of the Study.” HNP ThematicGroup Working Paper, World Bank. (February).Berg, A. 2005. “High Aid Inflows Case Study: Ghana”. Paper presented at the<strong>International</strong> Monetary Fund Seminar on Foreign Aid and MacroeconomicManagement. Maputo, Mozambique, March 14–15.
284 Fighting the Diseases of PovertyBloom, G., L Han and X Li. 2001. “How Health Workers Earn a Living in China”Human Resources for Health Development Journal 5(1): 25–38.Brinkerhoff, D. 2004. “Accountability and Health Systems: Toward Conceptual Clarityand <strong>Policy</strong> Relevance.” Health <strong>Policy</strong> and Planning 19(6): 371–379.Brinkerhoff, D. 2005. “Pro-poor Health Services in Madagascar: Decentralization andAccountability”. Paper presented at Global Health Council Annual Conference(may-June).Brueckner, J. 2000. “Fiscal Decentralization in Developing Countries: The Effects ofLocal Corruption and Tax Evasion”. Department of Economics and Institute ofGovernment and Public Affairs. Urbana, Illinois: University of Illinois.Carasciuc, L. 2001. “Corruption and Quality of Governance: The Case of Moldova”.Transparency <strong>International</strong>. Monograph.Chakraborty, S., R. Gatti, J. Klugman and G. Gray-Molina. 2002. “When is “Free” NotSo Free? Informal Payments for Basic Health Services in Bolivia. Mimeo.Processed.Chaudhury, N., and J.S. Hammer. 2004. “Ghost Doctors: Absenteeism in BangladeshiHealth Facilities”. World Bank Economic Review 18(3).Chaudhury, N., J.S. Hammer, M. Kremer et al. 2004. “Provider Absence in Schools andHealth Clinics”. Northeast Universities Development Consortium Conference,HEC Montreal, October.Chawla, M. 2001. “How Well Does the Health Sector in Georgia Serve the Poor: AnExamination of Public and Out-of-Pocket Expenditures on Health”. WashingtonD.C.: World Bank. Processed.Chawla, M. 2002. “Poland Informal Payments in Health”. Washington, D.C.: WorldBank. Mimeo. PRocessed.Chawla, M., et al. 1999. “Provision of Ambulatory Health Services in Poland: A CaseStudy from Krakow.” Social Science and Medicine 58:227–235.Chawla, M., P. Berman, A. Windak, and M. Kulis. 2001. “The Changing Face of theHealth Care Providers Market: A Case Study from Poland”. Processed.Cohen, J. C. 2002. “Improving Transparency in Pharmaceutical Systems:Strengthening Critical Decision Points against Corruption”. Washington, D.C.:World Bank. Mimeo.Cohen, J. C. and J.C. Montoya. 2002. “Using Technology to Fight Corruption inPharmaceutical Purchasing: Lessons Learned from the Chilean Experience”World Bank. Mimeo.Commission for Africa. 2005. Our Common Interest: Report of the Commission for AfricaCommission on Macroeconomics and Health. 2001. Macroeconomics and Health:Investing in Health for Economic Development. Geneva: World Health Organization.Das Gupta, M., V. Gauri, and S. Khemani. 2003. “Primary Health Care Service Deliveryin Nigeria. Survey Evidence from Lagos and Kogi”. Development Research Group.Washington D.C.: World Bank.Dehn, J., R.Reinikka, and J. Svensson. 2003. “Survey Tools for Assessing Performancein Service Delivery.” In Francois Bourguignon and Luiz Pereira da Silva, eds.,Evaluating the Poverty and Distributional Impact of Economic Policies. OxfordUniversity Press and World Bank.Delcheva, El, D. Balabanova, and M. McKee. 1997. “Under-the-Counter Payments forHealth Care.” Health <strong>Policy</strong>, 42:89–100.
Sources 285Di Tella, R. and Savedoff, W. D. (eds.). 2001. Diagnosis Corruption. Washington, DC:Inter-American Development Bank.Di Tella, R. and Savedoff, W. D. “Shining Light in Dark Corners.” In Di Tella, R. andSavedoff, W. D. (eds.). 2001. Diagnosis Corruption. Washington, DC: Inter-American Development Bank.Eichler, R., P. Auxilia and J. Pollock. 2001. “Output-Based Health Care: Paying forPerformance in Haiti.” World Bank, Viewpoint, Note 236. Washington, D.C.Elliott, K. A. 1997. (Ed). Corruption and the Global Economy. Washington, DC: Institutefor <strong>International</strong> Economics.Falkingham, J. 2002. “Health, health seeking behavior and out of pocketexpenditures in Kyrgyzstan 2001”. Kyrgyz Household Health Finance Survey.London School of Economics. Monograph.Falkingham, J. 2000. “Poverty, out-of-pocket payments and inequality in access tohealth care: evidence from Tajikistan”. London School of Economics.Falkingham, J. 2004. “Poverty, Out-of-Pocket Payments and Access to Health Care:Evidence from Tajikistan.” Social Science and Medicine, 58: 247–258.Filmer, D. and L. Pritchett. 1999. “ The Impact of Public Spending on Health: DoesMoney Matter?” Social Science and Medicine. 49; 1309–1323.Fisman, R., R. Gatti. 2000. “Decentralization and Corruption: Evidence acrossCountries”. Development Research Group. Washington D.C. World Bank.Processed.Gatti, R., G. Gray-Molina, and J. Klugman. 2003. “Determinants of Corruption inLocal Health Care Provision: Evidence from 108 Municipalities in Bolivia”. WorldBank. Processed.Giedion, U. Morales, L. G. and Acosta, O. L. “The Impact of Health Reforms onIrregularities in Bogot‡ Hospitals.” In Di Tella, R. and Savedoff, W. D. (eds.). 2001.Diagnosis Corruption. Washington, DC: Inter-American Development Bank.Gilson, L. 1997. “The Lessons of User Fee Experience in Africa.” Health <strong>Policy</strong> andPlanning 12(4): 273–285Gopakumar, K. 1998. “Citizen Feedback Surveys to Highlight Corruption in PublicServices: the Experience of Public Affairs Centre, Bangalore.” (September)Mimeo.Gosden, T., L. Pedersen and d. Torgerson. 1999. “How should We Pay Doctors? ASystematic Review of Salary Payments and their Effect on Doctor Behavior”Quarterly Journal of Medicine (92) 47–55.Gray-Molina, G., de Rada, E. P. and Ya–ez, E. “Does Voice Matter? Participation andControlling Corruption in Bolivian Hospitals.” In Di Tella, R. and Savedoff, W. D.(eds.). 2001. Diagnosis Corruption. Washington, DC: Inter-American DevelopmentBank.Gray-Molina, G., E. Perez de Rada and E. Yanez. 2001. “Does Voice Matter?Participation and Controlling Corruption in Bolivian Hospitals,” In DiagnosisCorruption Fraud in Latin America’s Public Hospitals W. Savedoff and R. Di Tellaeds.Gupta, S., H. Davoodi, and E. Tiongson. 2000. “Corruption and the Provision ofHealth Care and Education Services”. IMF Working Paper. Washington D.C.:<strong>International</strong> Monetary Fund.
286 Fighting the Diseases of PovertyHotchkisss, D., P. Hutchinson, A. Malaj and A. Berruti. 2005. “Out-of-pocket Paymentsand Utilization of Health Care Services in Albania: Evidence from ThreeDistricts.” Health <strong>Policy</strong> (forthcoming).Hsiao, W. 2005. Personal communication based on studies in China.IMF and World Bank. 2005. Global Monitoring Report. Washington, D.C.: <strong>International</strong>Monetary Fund and World Bank.IMF. 1997. “Good Governance: The IMF’s Role”. IMF Guidance Note. Washington,D.C.: <strong>International</strong> Monetary Fund.Jack, W. and M. Lewis. 2004. “Falling Short of Expectations: Public HealthInterventions in Developing and Transition Economies.” Social Science andMedicine 58(2).JaÎn, M. H. and Paravinski, D. “Wages, Capture and Penalties in Venezuela’s PublicHospitals.” In Di Tella, R. and Savedoff, W. D. (eds.). 2001. Diagnosis Corruption.Washington, DC: Inter-American Development Bank.Kaufman , D. and A. Kraay. 2003. Governance and Growth: Causality which way? –Evidence for the World, in brief.” Washington, D.C.: World BankKaufman, D, A. Kraay and M. Maztruzzi. 2005. “Governance Matters III: GovernanceIndicators for 1996–2002.” Washington, D.C.: World Bank.Kaufman, D, A. Kraay and P. Zoido-Lobat – n. 1999. “Governance Matters.” WorldBank <strong>Policy</strong> Research Working Paper 2196. Washington, D.C.: World Bank.Kaufmann, D. 2003. “On Evidence-based Rethinking of Governance and ChallengingOrthodoxy.” Presentation at USAID, Washington, DC, September 23.http://www.worldbank.com/wbi/governance/pdf/usaid_present092303.pdfKaufmann, D. and A. Kraay. 2002. “Growth Without Governance”. Economia3(1):169–215.Kaufmann, D. and S.-J. Wei. 1999. “Does “Grease Money” Speed Up the Wheels ofCommerce?” NBER Working Papers 7093. National Bureau of Economic Research,Inc.Khemani, S. 2004. “Local Government Accountability for Service Delivery in Nigeria.”World Bank. Processed.Killingsworth, J., N. Hossain, Y. Hedrick-Wong et. al. 1999. “Unofficial Fees inBangladesh: Price, Equity and Institutional Issues.” Health <strong>Policy</strong> and Planning,14(2): 152–163.Klitgaard, R. 1998. “Strategies against Corruption.” Presentation at Agencia Espa–olade Cooperaci – n Internacional Foro Iberoamericano sobre el Combate a laCorrupci – n, Santa Cruz de la Sierra, Jun 15–16.http://unpan1.un.org/intradoc/groups/public/documents/clad/clad0035403.pdfKoenig, M. A., M. A. Khan, B. Wojtyniak, J. D. Clemens, J. Chakraborty, V. Fauveau, J. F.Phillips, J. Akbar, and U.S. Barua. 1991. “Impact of Measles Vaccination onChildhood Mortality in Rural Bangladesh.” Bulletin of the World HealthOrganization 68(4): 441–447.Kutzin, J., T. Maeimanaliev, A. Ibraimova, C. Cashin, and S. O’Dougherty. 2003.“Formalizing Informal Payments in Kyrgyz Hospitals: Evidence from PhasedImplementation of Financing Reforms.” Paper presented at IHEA Conference, SanFrancisco, California.
Sources 287La Forgia, G. 2005. Health System Innovations in Central America: Lessons and Impact ofNew Approaches. World Bank Working Paper No. 57, Washington, D.C.: WorldBank.La Forgia, G., R. Levine, A. Dias and M. Rathe. 2004. “Fend for Yourself, SystemicFailure in the Dominican Health System. Health <strong>Policy</strong> 67:173–186.Leonard, K. 2005. “Getting Clinicians To Do Their Best: Ability, Altruism andIncentives.” University of Maryland. Mimeo (Draft)Lewis, M. 2000. “Who Is Paying for Health care in Europe and Central Asia?” Europeand Central Asia Region. Monograph. Washington D.C.: World Bank.Lewis, M. 2003. “Health and Corruption in Developing and Transition Countries”Presented at the Transparency <strong>International</strong> Annual Conference, Seoul, Korea.(May)Lewis, M. 2005. “Improving Efficiency and Impact in Health Care Services – Lessonsfrom Central America” in Health System Innovations in Central America: Lessonsand Impact of New Approaches. World Bank Working Paper No. 57, Washington,D.C.: World Bank.Lewis, M., 2002. “Informal Health Payments in Central and Eastern Europe and theFormer Soviet Union: Issues, Trends and <strong>Policy</strong> Implications” in Funding HealthCare: Options for Europe. Figueres and Moussiales. editors. Buckingham: OpenUniversity Press.Lewis, M., G. Eskeland, and X. Traa-Valarezo. 2004. “Effectiveness and Impact ofRural Health Care Policies in El Salvador”. Health <strong>Policy</strong>. 70(3): 303–325.Lewis, M., G. La Forgia, and M. Sulvetta. 1992. “Productivity and Quality of PublicHospital Staff: A Dominican Case Study.” <strong>International</strong> Journal of Health Planningand Management. 6.Lewis, M., G. La Forgia, and M. Sulvetta. 1996. “Measuring Public Hospital Costs:Empirical Evidence from the Dominican Republic.” Social Science and Medicine.43(2): 221 – 234.Lindelow, M. and J. Dehn. 2001. “Public Expenditure Tracking Survey of the HealthSector in Mozambique”. Washington, D.C.: World Bank. Draft.Lindelow, M., I. Kushnarova and K. Kaiser. 2005. “Measuring Corruption in theHealth Sector: What We Can Learn from Public Expenditure Tracking and ServiceDelivery Surveys in Developing Countries.” Washington D.C.: World BankLindelow, M., P. Serneels, and T. Lemma. 2003. “Synthesis of Focus Group Discussionswith Health Workers in Ethiopia.” Washington, D.C.: World Bank, DEC Draftpaper.Lindelow, M., P. Ward, and N. Zorzi. 2004. “Expenditure Tracking and ServiceDelivery Survey”, The Health Sector in Mozambique”. Final Report. WashingtonD.C.: World Bank. Processed.Lindelow, M., R. Reinikka, and J. Svensson. 2003. “Health Care on the Frontlines.Survey Evidence on Public and Private Providers in Uganda”. Africa RegionHuman Development Working Paper Series. Washington D.C.: World Bank.Forthcoming.McPake, B.,A. D. Asiimwe, F.Mwesigye, et. al. 1999. “Informal Economic Activities ofPublic Health Workers in Uganda: Implications for Quality and Accessibility ofCare.” Social Science and Medicine. 49: 849–865
288 Fighting the Diseases of PovertyMurrugarra E., and Cnobloch, R. 2003. “Health Status and Health Care Dimensions ofPoverty in Armenia”. Europe and Central Asia Region, Human DevelopmentDepartment. Washington D.C.: World Bank. Processed.Narayan, D. 2000. Voices of the Poor. Washington, D.C.: World Bank and OxfordUniversity Press.Partnership for Governance Reform. 2002. A Diagnostic Study of Corruption inIndonesia.Phongpaichit, P., N. Treerat, Y. Chaiyapong, and C. Baker. 2000. “Corruption in thePublic Sector in Thailand Perceptions and Experience of Households. Report of anationwide survey”. Political Economy Centre. Bangkok.: ChulalongkornUniversity. Processed.Rajkumar, A. S. and V. Swaroop 2002. “Public Spending and Outcomes: DoesGovernance Matter?” <strong>Policy</strong> Research Working Paper Series 2840. WashingtonD.C.: World Bank.Rauch, J. E. and P. B. Evans. 2000. “Bureaucratic Structure and BureaucraticPerformance in Less Developed Countries.” Journal of Public Economics 75(1):49–71.Reinikka, R. and J. Svensson. 2003. “Working for God? Evaluating service delivery ofreligious not-for-profit health care providers in Uganda” World Bank <strong>Policy</strong>Research Working Paper 3058 (May).Reinikka, R. and J. Svensson. 2004. “The Power of Information: Evidence from aNewspaper Campaign to Reduce Capture.” Mimeo (March).Reinikka, R. and J. Svensson. 2002. “Measuring and Understanding Corruption at theMicro Level.” Mimeo (January) Processed.Reinikka, R. and J. Svensson. 2004. “Local Capture: Evidence from a CentralGovernment Transfer Program in Uganda.” Quarterly Journal of Economics 119(2):679–705.Rigobon, R. and D. Rodrik. 2004. “Rule of Law, Democracy, Openness and Income:Estimating the Interrelationships.” NBER Working Papers 10750. NationalBureau of Economic Research, Inc.Rodrik, R., A. Subramanian and F. Trebbi. 2002. “Institutions Rule: The Primacy ofInstitutions over Geography and Integration in Economic Development.” NBERWorking Papers 9305. National Bureau of Economic Research, Inc.Roland, M. 2004. “Linking Physician’s Pay to the Quality of Care – A MajorExperiment in the UK.” New England Journal of Medicine 351(14): 1448–1458.Ryterman, J., J. Hellman and G. Jones et al., 2000. “Corruption in Russia: InterimReport.” World Bank. Mimeo (June) Processed.Sari, A., J. Langenbrunner, and M. Lewis. 2000. “Affording Out-of-Pocket Paymentsfor Health Care Services: Evidence from Kazakhstan.” Euroheath 6,2 (Spring).Geneva: World Health Organization.Schargrodsky, E., Mera, J. and Weinschelbaum, F. “Transparency and Accountabilityin Argentina’s Hospitals.” In Di Tella, R. and Savedoff, W. D. (eds.). 2001.Diagnosis Corruption. Washington, DC: Inter-American Development Bank.Shahriari, H., P. Belli, and M. Lewis. 2001. “Institutional Issues in Informal HealthPayments in Poland: Report on the Qualitative Part of the Study”. HNP WorkingPaper. Washington D.C.: World Bank.
Sources 289Shishkin, Sergey. 2003. “Informal Payments for Health Care in Russia”. Presentationat IHEA 2003 4th World Congress, San Francisco. Processed.Shleifer, A. and R. W. Vishny. 1993. “Corruption.” Quarterly Journal of Economics108(3): 599–617.Soto, B. 2002. “Corruption and the Colombian Health System Reform.” Corruption inHealth Services. WHO/I-ADB/Transparency <strong>International</strong> Report. Mimeo.Sparrow, M. (1996). License to Steal: Why Fraud Plagues the American Health CareSystem. Boulder, Colorado: Westview Press.Stempovscaia, E. 2002. “Corruption in the Public Health Service in a Post-CommunistCountry: Some Elements of corruption in the Transition Period in Moldova.” InCorruption in Health Services. WHO/IDB/Transparency <strong>International</strong> Report.Tendler, J. and S. Freedheim. 1994. “Trust in a Rent- Seeking World: Health andGovernment Transformed in Northeast Brazil.” World Development 22(12):1771–1791.Thampi, G.K. 2002. Corruption in South Asia, Insights & Benchmarks from CitizenFeedback Surveys in Five Countries. Monograph.Thamrin, Jalan M.H. 2002. “A Diagnostic Study of Corruption in Indonesia”.Partnership for Governance Reform in Indonesia. Final Report. Processed.Thompson, R. 2004. Informal Payments for Emergency Hospital Care in Kazakhstan:An Exploration of Patient and Physician Behavior. Ph.D. thesis. York, UK:University of York.Thompson, R. and A. Xavier. 2002. “Unofficial Payments for Acute State Hospital Carein Kazakhstan. A Model of Physician Behavior with Price Discrimination andVertical Service Differentiation”. LICOS Centre for Transition Economics. LICOSDiscussion Papers.Transparency <strong>International</strong>. 2003. Global Corruption Report 2003.Transparency <strong>International</strong>. 2005. Global Corruption Report 2005.United Nations Millennium Project. 2005. Investing in Development: A Practical Plan toAchieve the Millennium Development Goals. Sterling: Earthscan.Van Rijckeghem, C. and B. Weder. 2001. “Bureaucratic Corruption and the Rate ofTemptation: Do Wages in the Civil Service Affect Corruption and by How Much?Journal of Development Economics (65) 307–331.Vitosha/USAID, 2002. “Regional Corruption Monitoring in Albania, Bosnia andHerzegovina, Bulgaria, Croatia, Macedonia, Romania, and Yugoslavia”. Mimeo.Processed.Wagstaff, A. and M. Claeson. 2004. Rising to the Challenge: The MillenniumDevelopment Goals for Health. Washington, D.C.: World Bank.World Bank 2000c. “Paraguay: Resultados de los Diagnosticos a FuncionariosPublicos y Ususarios de los Servicios”. Washington D.C.: World Bank. Processed.World Bank 2001a. “Voices of the Misgoverned and Misruled: An EmpiricalDiagnostic Study on Governance, Rule of Law and Corruption for Peru”.Washington D.C.: World Bank. Processed.World Bank. 1997. World Development Report. The State in a Changing World.Washington, D.C.: World Bank.World Bank. 2000a, “Armenia Institutional and Governance Review”. World BankReport. Washington D.C.: World Bank. Processed.
290 Fighting the Diseases of PovertyWorld Bank. 2000b. “Cambodia Governance and Corruption Diagnostic: Evidencefrom Citizen, Enterprise and Public Official Survey”.. World Bank Report.Washington D.C.: World Bank. Processed.World Bank. 2000d. “The Ghana Governance and Corruption Survey, Evidence fromHouseholds, Enterprises and Public Officials. Africa Region”. Washington D.C.:World Bank. Processed.World Bank. 2001b. “Voice of the Poor and Taming of the Shrew: Evidence from theBolivia Public Officials’ Survey”. Latin America and Caribbean Region.Washington D.C.: World Bank. Processed.World Bank. 2001c. “Kazakhstan Governance and Service Delivery: A DiagnosticReport”. Poverty Reduction and Economic Management Unit, Europe and CentralAsia Region. Washington D.C.: World Bank. Processed.World Bank. 2001d. “Diagnostic Survey of Corruption in Romania”. Washington D.C.:World Bank. Processed.World Bank. 2001e. “Bosnia and Herzegovina Diagnostic Surveys of Corruption”.Washington D.C.: World Bank. Processed.World Bank. 2001f. “Honduras: Public Expenditure Management for PovertyReduction and Fiscal Sustainability.” Report No. 22070. Washington D.C.: WorldBank.World Bank. 2002a. “A Strategy to Combat Corruption in the ECA Region”. IssuesPaper and Progress Report. Washington D.C.: World Bank. Processed.World Bank. 2002b. “Governance and Service Delivery in the Kyrgyz Republic –Results of Diagnostic Surveys”. Poverty Reduction and Economic ManagementUnit, Europe and Central Asia Region. Washington D.C.: World Bank. Processed.World Bank. 2003a. “Albania: Poverty Assessment”. Europe and Central Asia Region.Washington D.C.: World Bank.World Bank. 2003b. Better Governance for Development in the Middle East and NorthAfrica: Enhancing Inclusiveness and Accountability. Washington, D.C.: World BankWorld Bank. 2003c. Turkey: Reforming the Health Sector for Improved Access andEfficiency. Report No. 24358-TU. Washington, D.C.: World Bank.World Bank. 2004a. World Development Report. Making Services Work for Poor People.Washington, D.C.: World Bank.World Bank. 2004b. Ethiopia: A Country Status Report. Report No. 28963-ET.Washington, D.C.: World Bank.World Bank. 2004c. The Millennium Development Goals for Health: Rising to theChallenge. Washington, D.C.: World Bank.World Bank. 2005a. Doing Business in 2005: Removing Obstacles to Growth.Washington, D.C.: World Bank.World Bank. 2005b. Ethiopia: A Country Status Report on Health and Poverty.Washington, D.C.: World Bank.World Bank. 2006. World Development Report. Equity and Development. Washington,D.C.: World Bank.World Bank. Forthcoming. Nigeria: Health, Nutrition and Population: Country StatusReport. Washington D.C.: World Bank Draft.
Sources 2914 The diseases of poverty and the 10/90 gapAttaran, A., Barnes, K., Curtis, C., d’Alessandro, U., Fanello, C., Galinski, M., Kokwaro,G., Looareesuwan, S., Makanga, M., Mutabingwa, T., (2004), “WHO, the GlobalFund, and medical malpractice in malaria treatment,” The Lancet, 363:9404, pp237–240.Barat, L., Palmer, N., Basu, S., Worrall, E., Hanson, K., Mills, A., (2003), “Do MalariaControl Interventions Reach the Poor?: A view Through the Equity Lens,” DiseaseControl Priorities Project, Bethesda: National Institutes of Health.Black, RE., Where and why are 10 million children dying every year? The Lancet 2003;361: 2226–34Bruce, N., Perez-Padilla, R. & Albalak, R., (2002), “The health effects of indoor airpollution exposure in developing countries”, Geneva: World HealthOrganization.Carrin, G., (2002), “Social Health Insurance in developing countries: a continuingchallenge,” <strong>International</strong> Social Security Review, Vol. 55.Chima, R., Goodman, C. & Mills, A., (2003), “The economic impact of malaria inAfrica: a critical review of the evidence,” Health <strong>Policy</strong>, 63(1): 17–36Deolalikar, A., (1995), “Government Health Spending in Indonesia: Impact onChildren in Different Economic Groups.” In Public Spending and the Poor: Theoryand Evidence, eds. Van de Walle, D., & Nead, K., Baltimore: John HopkinsUniversity Press.Department of Health and Human Services, United States, (2002), “Report to thePresident: Prescription drug coverage, spending, utilization, and prices”, April2002.de Soto, H., (2001), The Mystery of Capital, London: Bantam Books.Fenwick, A, (2006), “Waterborne Infectious Diseases – Could They Be Consigned toHistory?” Science, 313:5790, pp 1077 – 1081Filmer, D. & Pritchett, L., (1999), “The Impact of public spending on health: doesmoney matter?” World BankFilmer, D., Hammer, J., Pritchett, L., (2000), “Weak links in the chain: a diagnosis ofhealth policy in poor countries,” World Bank Research Observer, 15(2): 199–224.Jones, G., & Stetekee R., (2004), How many child deaths can we prevent this year? TheLancet, vol 362, 5 July 2004Kumarasamy, N., (2004), “Generic antiretroviral drugs – will they be the answer toHIV in the developing world?” The Lancet, vol 364.Levison, L. & Laing, R., (2003), “The hidden costs of essential medicines,” WHOessential drugs monitor, Issue 33.Levison, L., (2003), “<strong>Policy</strong> and programming options for reducing the procurementcosts of essential medicines in developing countries”, concentration paper:Boston University School of Public Health.Love J., Hubbard T., (2003) “An agenda for research and development,” Meeting onthe role of generics and local industry in attaining the Millennium DevelopmentGoals in pharmaceuticals and vaccines. World Bank: Washington DC, June 2003Monath, T., (2005), “Yellow Fever Vaccine,” Expert Review of Vaccines, 4(4):553–74Medecins Sans Frontiers & Drugs for Neglected Diseases Working Group, (2001),“Fatal Imbalance: The Crisis in Research and Development for Drugs for
292 Fighting the Diseases of PovertyNeglected Diseases”, September 2001, available at http://www.accessmedmsf.org/documents/fatal_imbalance_2001.pdfMuheki, C., McIntyre, D. & Barnes K., (2004), “Artemisinin-based combinationtherapy reduces expenditure on malaria treatment in KwaZulu Natal, SouthAfrica,” Tropical Medicine and <strong>International</strong> Health 9, 959–966.PAHO, (2006), “New malaria treatments guidelines issued,” 20/01/2006, available athttp://www.paho.org/English/DD/PIN/pr060120.htm.Poisal, J. & Chulis, G., (2000), “Medicare beneficiaries and drug coverage,” HealthAffairs, 19(2).Rice, A., West, K., & Black, R., (2004), “Vitamin A Deficiency” (Chapter 4), in Ezzati,M. et al. (Eds.) Comparative Quantification of Health Risks. Geneva: World HealthOrganization.Shaw, R. & Ainswoth, M., (1995), “Financing heath services through user fees andinsurance,” World Bank discussion paper 294.Soderlund, N. & Hansl, B., (2000), “Health Insurance in South Africa: an empiricalanalysis of trends in risk-pooling and efficiency following deregulation,” Health<strong>Policy</strong> and Planning, 15(4):378–385.Trouiller et al., (2002), Drug development for neglected diseases: a deficient market and apublic-health policy failure, The Lancet, vol 359, June 22, 2002Wirth, D., (2001), Survey for the Drugs for Neglected Diseases Working Group,Switzerland, May 2001. [Online]. Original survey and letter available:www.accessmed-msf.org. Andra Brichacek, Top 50 Pharmaceutical Companies of2000, Pharmaceutical Executive, April 2001. Available: http://www.pharmaportal.com/articles/pe/pe0401_062-82.pdf [2001, August 6].Monath, T. & Nasidi, A., (1993), “Should Yellow Fever vaccine be included in theexpanded program of immunisation in Africa? A cost-effectiveness analysis forNigeria,” American Journal of Tropical Medicine and Hygiene, 48(2):274–299.Moran, M., Ropars, A., Guzman, J. Diaz, J. & Garrison, C., (2005), “The New landscapeof neglected disease drug development,” London School of Economicspharmaceutical R&D policy project, Wellcome Trust: LondonMurray H., Pepin, J., Nutman, T., Hoffman, S., Mhamoud, A., (2001), “Recentadvances, tropical medicine”, British Medical Journal, 320:490–494PhRMA, (2005), data solicited by author, November 2005.Saleh, K. & Ibrahim, M., (2005), “Are Essential Medicines in Malaysia Accessible,Affordable and Available?” Pharmacy World & Science, 27:6 442–446.WHO, (1995), Global prevalence of Vitamin A deficiency, Micronutrient DeficiencyInformation System working paper no.2, Geneva: WHOWHO (1999), Report on Infectious Diseases: Removing Obstacles to Healthy Development,Geneva: WHO.WHO, (2002), World Health Report 2002, Geneva: WHOWHO, (2002a), State of the world’s vaccines and immunisation, Geneva: WHOWHO, (2003), World Health Report 2003, Geneva: WHOWHO, (2003a), Medicines Strategy Report 2002–2003, Geneva: WHOWHO, (2004), World Health Report, Statistical Annex, Geneva: WHO.WHO, (2005a), Preventing Chronic Disease: a vital investment, Geneva: WHO.WHO-IFPMA (2001) Round Table, Working paper on priority infectious diseasesrequiring additional R&D, July 2001
Sources 293Wofford, D., & Shanahan, C., (2004), Doing Business in 2005, World Bank.5 Increasing access to medicinesAdams, C., & Brantner, V., (2003), “New Drug Development: Estimating Entry formHuman Clinical Trials,” Federal Trade Commission, working paper 262.Attaran, A., (2004), “How Do Patents and Economic Policies Affect Access to EssentialMedicines in Developing Countries”, Health Affairs, 23:3, 155–66.Barat, L., Palmer, N., Basu, S., Worrall, E., Hanson, K., Mills, A., (2003), “Do MalariaControl Interventions Reach the Poor?: A view Through the Equity Lens,” DiseaseControl Priorities Project, Bethesda: National Institutes of Health.Bate, R., Tren, R. & Urbach, J., (2005), Taxed to death, Washington DC: AEI-BrookingsJoint Center for Regulatory Studies.Carrin, G., (2002), “Social Health Insurance in developing countries: a continuingchallenge,” <strong>International</strong> Social Security Review, Vol. 55.Castro-Leal, F., Dayton, J., Demery, L. & Mehra, K., (1999), “Public Social Spending inAfrica: Do the Poor Benefit?” World Bank Research Observer, 14(1):49–72.CMR <strong>International</strong> Institute for Regulatory Science, (2004), The changing regulatoryenvironment: reality and perception, R&D briefing no. 42.Danzon, P. & Furukawa, M., (2003), “Prices And Availability of Pharmaceuticals:Evidence From Nine Countries,” Health Affairs, W3: 521–536.Danzon, P., Wang, Y. & Wang, L., (2003), The impact of drug price regulation on thelaunch of delay of new drugs-evidence from 25 major markets in the 1990s,National Bureau of Economic Research, working paper 9874.Deolalikar, A., (1995), “Government Health Spending in Indonesia: Impact onChildren in Different Economic Groups.” In Public Spending and the Poor: Theoryand Evidence, eds. Van de Walle, D., & Nead, K., Baltimore: John HopkinsUniversity Press.DiMasi, J., (1995), “Trends in Drugs Development Costs, Times and Risks,” DrugInformation Journal, 29.DiMasi, J., Jansen, R., & Grabowski, H., (2003), “The Price of innovation: newestimates of drug developments costs,” Journal of Health Economics, 22: 151–185.Department of Health and Human Services, United States, (2002), “Report to thePresident: Prescription drug coverage, spending, utilization, and prices.”de Soto, H., (2001), The Mystery of Capital, London: Bantam Books.Dranover, D., & Meltzer, D., (1994), “Do Important Drugs reach the Market Sooner?”The RAND Journal of Economics, 25(3): 402–423.Dussault, G., & Dubois, C., (2003), Human resources for health policies: a criticalcomponent in health policies, Human Resources for Health.European Commission, (2003), Working Document on developing countries’ duties andtaxes on essential medicines used in the treatment of major communicable diseases,European Commission, Directorate-General for Trade.Filmer, D. & Pritchett, L., (1999), “The Impact of public spending on health: doesmoney matter?” World Bank.Filmer, D., Hammer, J., Pritchett, L., (2000), “Weak links in the chain: a diagnosis ofhealth policy in poor countries,” World Bank Research Observer, 15(2): 199–224.
294 Fighting the Diseases of PovertyGambardella, A., Orsenigo, L. & Pammolli, P., (2000), Global competitiveness inpharmaceuticals: a European Perspecitve, Paper prepared for the EnterpriseDirectorate-General of the European Commission, November.Giacotto, C., (2004), “Explaining pharmaceutical R&D growth rates at the industrylevel: new perspectives and insights,” AEI- Brookings Joint Centre for RegulatoryStudies.IFPMA (2004), The Pharmaceutical Innovation Platform, GenevaKimani, D., (2005), “Malaria, HIV, TB, Diabetes Drugs to Cost 10 per cent more,” TheEast African, 24 January. At: http://allafrica.com/stories/200501260090.html.Kremer, M. & Glennerster, R., (2004), Strong Medicine, Princeton University Press:Princeton.Kumarasamy, N., (2004), “Generic antiretroviral drugs – will they be the answer toHIV in the developing world?” The Lancet, vol 364.Lichtenberg, F., (2003), “The value of new drugs,” Milken Institute Review, FourthQuarter, 2003.Maskus, K., (2000), Intellectual Property in the global economy, Institute for<strong>International</strong> Economics, Washington DC.Menon, D., (2001), “Pharmaceuticals cost control in Canada: Does it work?” HealthAffairs, 20(3) 92–103.Padma, T., (2005), “India’s drug tests,” Nature, 436, 485. 28 July 2005.Poisal, J. & Chulis, G., (2000), “Medicare beneficiaries and drug coverage,” HealthAffairs, 19(2).Rawlins, M., (2004), “Cutting the cost of drug development?” Nature, 3:360.Reekie, D.W., (1997), “How Competition Lowers the Cost of Medicines,” Cuadernos deDerects Europeu Farmaceutico, 3(8): 35–48. Reprinted in Pharmacoeconomics,14:107–113.Rozek, R., (2000), “The effects of compulsory licensing on innovation and access tohealthcare,” NERA, September.Saleh, K. & Ibrahim, M., (2005), “Are Essential Medicines in Malaysia Accessible,Affordable and Available?” Pharmacy World & Science, 27:6 442–446.Sauer, R. & Sauer, C., (2005), “Reducing Barrier to the Development of High Quality,Low Cost Medicines: A Proposal for Reforming the Drug Approval Process,”London: <strong>International</strong> <strong>Policy</strong> Press.Shaw, R. & Ainswoth, M., (1995), “Financing heath services through user fees andinsurance,” World Bank, discussion paper 294.Sherwood, R., (2000), “The economic importance of judges,” Federal Circuit BarJournal, 9(4): 619–633.Soderlund, N. & Hansl, B., (2000), “Health Insurance in South Africa: an empiricalanalysis of trends in risk-pooling and efficiency following deregulation,” Health<strong>Policy</strong> and Planning, 15(4):378–385.UNAIDS, (2006), 2006 Report on the global AIDS epidemic, UNAIDS, Geneva, available athttp://www.unaids.org/en/HIV_data/2006GlobalReport/default.aspU.S. Department of Commerce, (2004), “Pharmaceutical price controls in OECDCountries: implications for US consumers, pricing, research and development,and innovation,” <strong>International</strong> Trade Administration, December.Wofford, D., & Shanahan, C., (2004), Doing Business in 2005, World Bank.
Sources 2956 Cost effective means of fighting the diseases of povertyAttaran, A., Barnes, K., Curtis, C., d’Alessandro, U., Fanello, C., Galinski, M., Kokwaro,G., Looareesuwan, S., Makanga, M., Mutabingwa, T., (2004), “WHO, the GlobalFund, and medical malpractice in malaria treatment,” The Lancet, 363:9404, pp237–240.Baird, J., (2000), “Resurgent malaria at the millennium: control strategies in crisis,”Drugs, (4) 719–743.Bean, J., (2001), “Can we roll back malaria?” The Health Exchange, December 2001.Black, R.,. Morris, S. & Bryce, J., (2003), “Where and why are 10 million childrendying every year?” The Lancet, 361:2226–2234.Blower, S., Ma, L., Farmer, P. & Koenig, S., (2003), “Predicting the Impact ofAntiretrovirals in Resource-Poor Settings: Preventing HIV Infections whilstControlling Drug Resistance”, Current Drug Targets – Infectious Disorders, 3:4,345–353.Bruce, N., Perez-Padilla, R. & Albalak, R., (2002), “The health effects of indoor airpollution exposure in developing countries”, Geneva: World HealthOrganization.Choi, H., Breman J., Teutsch S., Liu S. & Hightower A., (1995), “The effectiveness ofinsecticide-impregnated bednets in reducing cases of malaria infection: a metaanalysisof published results,” American Journal of Tropical Medicine and Hygiene(52) 377–382.Galiani, S., Gerther, P., Schargrodsky, E., (2002), “Water for life: the impact of theprivatization of water services on child mortality,” Stanford Institute forEconomic <strong>Policy</strong> Research (SIEPR), Stanford University.Greenspan, A., (2003), “Market Economies and Rule of Law,” New York: FederalReserve Board.Goswami, I., (2004), “Changing contours of rural India,” Financial Express, September14, http://www.financialexpress.com/fe_full_story.php?content_id=68671.Gwartney, J. & Lawson, R., (2004), Economic Freedom of the World, 2004 Annual Report,Vancouver: Fraser Institute.Hamel, M., Odhacha, A., Roberts, J. & Deming, M., (2001), “Malaria control inBungoma District, Kenya: a survey of home treatment of children with fever,bednet use and attendance at antenatal clinics,” Bulletin of the World HealthOrganization, 79(11): 1014–1023.Kasper, W., (2006), Make Poverty History: Tackle Corruption, Australia: Centre forIndependent Studies.Malaria Consortium, (2002), “Roll Back Malaria to Date,” available athttp://www.rbm.who.int/cmc_upload/0/000/015/905/ch2.pdfOkonski, K., ed., (2006), The Water Revolution: Practical Solutions to Water Scarcity,London: <strong>International</strong> <strong>Policy</strong> Press.Paalberg, R., (2006), “Let them eat precaution: why GM crops are beingoverregulated in the developing world,” in Entine, J. (Ed.) Let them eat precaution,Washington, DC: American Enterprise Institute.Paine, J., Shipton, C., Chaggar, S., Howells, R., Kennedy, M., Vernon, G., Wright, S.,Hinchliffe, E., Adams, J., Silverstone, A., & Drake, R., (2005), “Improving thenutritional value of Golden Rice through increased pro-vitamin A content,”Nature Biotechnology, 23, 482–487.
296 Fighting the Diseases of PovertyPhillips-Howard, P., Nahlen, B., Kolczak, M., et al., (2003), “Efficacy of permethrintreatedbednets in the prevention of mortality in young children in an area ofhigh perennial malaria transmission in western Kenya,” American Journal ofTropical Medicine and Hygiene, 68 (suppl): 23–29.Premji Z., Lubega P., Hamisi Y., Mchopa E., Minjas J., Checkley W. & Shiff C., (1995),“Changes in malaria associated morbidity in children using insecticide treatedmosquito nets in the Bagamoyo District of Tanzania,” Tropical Medicine andParasitology, 46: 147–153.Ramiah, I. & Reich, M., (2005), “Public-Private Partnerships and Antiretroviral Drugsfor HIV/AIDS: Lessons from Botswana,” Health Affairs, 24(2): 545–551Rao, K., Mishra, V. & Retherford, R., (1998), “Knowledge and Use of Oral RehydrationTherapy for Childhood Diarrhoea in India: Effects of Exposure to Mass Media,”National Family Health Survey Subject Reports (10).Roberts, D., Laughlin, L., Hsheih, P. & Legters, L., (1997), “DDT Global Strategies, anda Malaria Control Crisis in South America,” Emerging Infectious Diseases, 3(3):295–302.Rosegrant, M., & Gazmuri-Schleyer, R., (1994), Reforming Water Allocation <strong>Policy</strong>Through Markets in Tradable Water Rights: Lessons from Chile, Mexico, andCalifornia. Washington DC: <strong>International</strong> Food and Production TechnologyDivision, EPTD Discussion Paper No. 6.Salomon, J., Hogan, D., Stover, J., Stanecki, K., Walker, N., Ghys, P. & Schwartlander,B., (2005), “Integrating HIV Prevention and Treatment: From Slogans to Impact,”PLOS Medicine, 2(1): 50–56.Sharma, G., (1987), “A critical review of the impact of insecticidal spraying underNMEP on the malaria situation in India,” Journal of Communicable Diseases. (19)187–290.Singh, S., Darroch, J. & Bankole, A., (2003), A, B and C in Uganda: The Role ofAbstinence, Monogamy, and Condom Use in HIV Decline, The Alan GuttmacherInstitute: New York and Washington.Snow R., Guerra, C., Noor, A., Myint, H. & Hay, S., (2005), “The global distribution ofclinical episodes of Plasmodium falciparum malaria,” Nature 434, 214–217 (10March 2005).Stover, J., Bertozzi, S., Gutierrez, J., Walker, N., Stanecki, K., Greener, R., Gouws, E.,Hankins, C., Garnett, G., Salomon, J., Ties Boerma, T., De Lay, P., Ghys., P, (2006),“The Global Impact of Scaling Up HIV/AIDS Prevention Programs in Low- andMiddle-Income Countries”, Science, 311: 5766, 1474–1476UNAIDS, (2004), 2004 Report on the global AIDS epidemic, UNAIDS, Geneva.UNAIDS, (2005a), AIDS epidemic update 2005, UNAIDS, Geneva.UNAIDS, (2005b), Intensifying HIV prevention: UNAIDS policy position paper, Geneva.UNAIDS, (2006), 2006 Report on the global AIDS epidemic, UNAIDS, Geneva, available athttp://www.unaids.org/en/HIV_data/2006GlobalReport/default.asp.UNAIDS, (2006b), Evaluation of WHO’s contribution to “3 by 5”, WHO, Geneva,available at http://www.who.int/hiv/topics/me/3by5evaluationreport.pdf.WHO, (1995), Global prevalence of Vitamin A deficiency, Micronutrient DeficiencyInformation System working paper no.2, Geneva: WHO.World Bank, (2002), “Water – the essence of life,” Washington DC: World Bank.
Sources 2977 Counterfeit medicines in LDCs: problems and solutionsAhmad, K., (2004), “Antidepressants are sold as antiretrovirals in DR Congo”, TheLancet, 363: 713.Cockburn, R., Newton, P., Agyarko, E., Akunyili, D., White, N., (2005), “The GlobalThreat of Counterfeit Drugs: Why Industry and Governments MustCommunicate the Dangers”, PLoS Medicine, 2(4): e100.Dondorp, A., Newton, P., Mayxay, M., Van Damme, W., Smithuis, F., Yeung, S., Petit,A., Lynam, A., Johnson, A., Hien, T., McGready, R., Farrar, J., Looareesuwan, S.,Day, N., Green, M. & White, N., (2004), “Fake antimalarials in Southeast Asia are amajor impediment to malaria control: multinational cross-sectional survey onthe prevalence of fake antimalarials”, Tropical Medicine & <strong>International</strong> Health,9(12): 1241.Hanif, M., Mobarak, M., Ronan, A., Rahman, D., Donovan, J. et al., (1995), “Fatal renalfailure caused by diethylene glycol in paracetamol exlixir: The Bangladeshepidemic”, British Medical Journal, 311: 88–91.Pcoul, B., Chirac, P., Trouiller, P., Pine, J., (1999), “Access to Essential Drugs in PoorCountries – A Lost Battle?” JAMA, 281(4)Raufu, A., (2003), “India agrees to help Nigeria tackle the import of fake drugs”,British Medical Journal, 326: 1234.Shakoor, O., Taylor, R., Behrens, R., (1997), “Assessment of the incidence ofsubstandard drugs in developing countries,” Tropical Medicine & <strong>International</strong>Health 2(9): 839–845.White, N., (1999), “Delaying antimalarial drug resistance with combinationchemotherapy,” Parassitologia 41, 301–308.WHO, (2003), “The quality of antimalarials: a study in seven African countries,”Geneva: WHO, available at http://whqlibdoc.who.int/hq/2003/WHO_EDM_PAR_2003.4.pdf9 The World Health Organisation: a time for reconstitutionsBarro, Robert J. (1967). “Second Thoughts on Keynesian Economics.” AmericanEconomic Review, Proceedings, 69: 54–59.Bauer, Peter. (2000). From Subsistence to Exchange. Princeton: Princeton UniversityPress.Boettke, Peter J. (1993). Why Perestroika Failed: The Politics and Economics of SocialistTransformation. London: Routledge.Boettke, Peter J. ed. (1994). The Collapse of Development Planning. New York: New YorkUniversity Press.Borcherding, Thomas E., ed. (1977). Budgets and Bureaucrats. Durham, NC: DukeUniversity Press.Cheung, Steven N. S. Cheung. (1973). “The Fable of the Bees: An EconomicInvestigation.” Journal of Law and Economics, 16: 11–33.Downs, Anthony. (1967). Inside Bureaucracy. Boston: Little, Brown.Easterly, William (2001). The Illusive Quest for Growth. New York: St. Martin’s Press.Friedman, Milton and Anna J. Schwartz. (1963). A Monetary History of the UnitedStates Princeton: Princeton University Press.
298 Fighting the Diseases of PovertyGwartney, James and Robert Lawson. (2004). Economic Freedom of the World.Vancouver: Fraser Institute.Hayek, F. A., ed. (1935). Collectivist Economic Planning. London: Routledge.Ikeda, Sanford. (1997). Dynamics of the Mixed Economy. London: Routledge.Johnson, David B. (1973). “Meade, Bees, and Externalities.” Journal of Law andEconomics, 16: 35–66.Kealey, Terence. (1997). The Economic Laws of Scientific Research London: PalgraveMacmillan.Lal, Deepak. (1983). The Poverty of Development Economics. Cambridge: HarvardUniversity Press.Littlechild, Steven C. (1978). The Fallacy of the Mixed Economy. London: Institute ofEconomic Affairs.Meade, James E. (1952). “External Economies and Diseconomies in a CompetitiveSituation.” Economic Journal, 62: 54–67.Morris, Julian, Philip Stevens and Alec van Gelder. (2005). Incentivising Research andDevelopment for the Diseases of Poverty. London: <strong>International</strong> <strong>Policy</strong> Press.Niskanen, William A. (1971). Bureaucracy and Representative Government. Chicago:Aldine.Nutter, G. Warren. (1961). The Growth of Industrial Production in the Soviet Union.Princeton: Princeton University Press.Roberts, D et al., (2000). “A probability model of vector behaviour: effects of DDTrepellency, irritancy and toxicity in malaria control.” Journal of Vector Ecology, 25(1):48–61.Roberts, Paul Craig. (1971). Alienation and the Soviet Economy. Albuquerque:University of New Mexico Press.Rothbard, Murray Rothbard. (1963). America’s Great Depression. Kansas City: SheedAndrews.Samuelson, Paul A. and William D. Nordhaus. (1989). Economics, 13th ed. New York:McGraw-Hill.Snow, B et al., (2005). “The global distribution of clinical episodes of Plasmodiumfalciparum malaria”, Nature 434, 214–217. Available at: http://www.who.int/3by5/about/initiative/en/index.html, accessed 10 May 2005.Tullock, Gordon. (1967). The Organisation of Inquiry.Durham, NC: Duke UniversityPress.Wagner, Richard E., ed. (1991). Charging for Government. London: Routledge.Wagner, Richard E. (1997). “Does the World Health Organisation Return Good Valueto American Taxpayers?” Delusions of Grandeur: The United Nations and GlobalIntervention. Ed. Ted Galen Carpenter. Washington DC: Cato Institute.
The Campaign forFighting DiseasesAdvisory councilDr Amir Attaran Amir Attaran holds the Canada Research Chair inPopulation Health and Global Development <strong>Policy</strong> at the Universityof Ottawa. He is also an associate fellow of the Royal Institute of<strong>International</strong> Affairs, London and a member of Africa fightingMalaria, an organisation aimed at the eradication of the disease. Previouslyhe was an adjunct lecturer in Public <strong>Policy</strong> at Harvard University,publishing research as part of the Center for <strong>International</strong>Development and the Carr Center for Human Rights <strong>Policy</strong> at theJohn F. Kennedy School of Government.Professor Lucas Bergkamp is a professor of environmental liabilitylaw at Erasmus University Rotterdam, and partner at Hunton &Williams in Brussels, Belgium. He is the author of numerous lawreview articles, and is a member of the editorial board of severalacademic and trade journals. He is an expert in the emerging areaof biotechnology.Professor Sir Colin Berry is professor of morbid anatomy andhistopathology at Queen Mary, University of London. He has heldthe position of Dean of the London Hospital Medical College and hasserved on advisory committees on health and related matters, andhas penned more than 200 papers on development, toxicology andvascular biomechanics.Dr Philip Brown is the former owner of PJB Publications Ltd,the leading business-to-business publisher for the international
healthcare industry. He writes and speaks on a variety of issuesrelated to the development and use of pharmaceutical products. DrBrown is the Chairman of Council of the University of London Schoolof Pharmacy and is the owner of a number of pharmacies and otherbusinesses.Dr. Alphonse L. Crespo, a Swiss orthopaedic surgeon, is currentlyDirector of Research and member of the Board of Directors of theInstitut Constant de Rebecque, an independent think tank foundedin January 2005. As well as publishing numerous books and articlesDr. Crespo maintains his professional qualifications, sits on the EditorialBoard of Le Courrier du Mdecin Vaudois and is a medical consultantfor the Swiss Accident Insurance Fund in Lausanne.Professor William Keatinge is author to more than 200 scientificpapers, reviews, chapters and two books, and commentator on themedia about effects of cold and heat on human health.Dr John Kilama is founder and president of the Global BioscienceDevelopment Institute. He has a broad background in the pharmaceutical,agricultural biotechnology and agrochemical chemistry buthis areas of expertise include Intellectual Property rights andBiotechnology Strategy development.Professor Deepak Lal is James S. Coleman Professor of <strong>International</strong>Development Studies, University of California at Los Angeles, ProfessorEmeritus of Political Economy, University College London, andco-director of the Trade and Development Unit at the Institute ofEconomic Affairs, London.Professor The Lord McColl is Emeritus Professor of Surgery at Guy’sHospital and continues to teach at King’s College on the Guy’sCampus. He is also Surgeon to the international charity Mercyshipsand frequently operates in the poorest countries of West Africa.
Dr. Henry I. Miller joined the Food and Drug Administration in 1979and served in a number of posts. He was the medical reviewer forthe first genetically engineered drugs evaluated by the FDA and wasinstrumental in the rapid licensing of human insulin and humangrowth hormone. Thereafter, he was a special assistant to the FDAcommissioner, with responsibility for biotechnology issues, andfrom 1989 to 1993 was the founding director of the FDA’s Office ofBiotechnology. After leaving government service, Miller became theRobert Wesson Fellow in Scientific Philosophy and Public <strong>Policy</strong> atthe Hoover Institution, 1994–96.Professor Paul Reiter is a British scientist who has devoted hisentire career to the epidemiology of mosquito-borne diseases. Hisreputation for original research and innovative solutions broughthim to the US, where he worked for 22 years as a researcher in theDivision of Vector-borne Infectious Diseases of the Centers forDisease Control and Prevention. In 2003 he was appointed Professorat the Institut Pasteur, Paris, where he is in the process of establishinga new unit of Insects and Infectious Disease.CFD partner organisationsAction Research on Community Health, Gujarat, IndiaAIDS Responsibility Project, San Francisco, USAEuropean Coalition of Positive People, London, UKFree Market Foundation, Johannesburg, South AfricaFundacion DL, Bogota, ColombiaThe Global Bioscience Development Institute, USAImani: The Centre for Humane Education, Accra, GhanaInter Region Economic <strong>Network</strong>, Nairobi, KenyaInstitute for Public <strong>Policy</strong> Analysis, Lagos, NigeriaLiberty Institute, New Delhi, India
Fighting theDiseases of PovertyHow does economic globalisation affect health? Why is access tomedicines in many poor countries so low? Why, despite record levelsof spending, are intergovernmental efforts to fight disease soineffectual? In this book, a collection of experts address these andother questions, showing that:• Human health has been improvingglobally since the mid 18th Century andhealth inequalities between countries –with a few exceptions – are decreasing.• As a result, the populations of poorercountries are ageing and their burden ofdisease increasingly resembles that ofwealthy countries.• Despite these significant advances,access to medicines in poor countriesremains low – in large part becauseof a range of counterproductivegovernment policies.• Intellectual property is blamed by somefor restricting access to medicines, yetthis is rarely the case; rather, it is a vitalincentive for the development of newdrugs for the diseases of poverty.• A lack of enforceable property rights andweak rule of law are contributing to anexplosion of counterfeit medicines inless developed countries, to the gravedetriment of the health of the poor.• Government attempts to plan andcontrol universal healthcare systemsresult in rationing, inequitable accessand entrenched corruption.• Endemic corruption in the healthsystems of less developed countriesundermines the effectiveness ofoverseas development aid.• The politicisation of diseases suchas HIV/AIDS has led to a diversionof resources away from more easilytreatable diseases that affect morepeople. Cost-effective and simpleinterventions such as vaccinationare being subordinated to other more‘politically correct’ diseases.• Meanwhile, the UN’s centrally-plannedAIDS and malaria programmes haveharmed patients and wasted resources.• The structure and funding of the WorldHealth Organization leads it to focusresources on the modish health issuesof wealthy countries, rather thanfighting the diseases of poverty.www.fightingdiseases.org<strong>International</strong> <strong>Policy</strong> Press, LondonPrice: £12