
Create successful ePaper yourself
Turn your PDF publications into a flip-book with our unique Google optimized e-Paper software.
Calypso 2.0 Rev-A SchematicPage 3/3
AcknowledgementsThe author wishes to thank the seed growers who made their crops available for study and providedhelpful information in discussions, and data on crop management and yields.Tony Campbell KeithHugh EllisForbesMark Green ForbesMichael Green ForbesRobert Green ForbesDavid Pengelly KeithBrendan Smart KeithStaff <strong>of</strong> Lachlan Valley Seeds and Seedco provided substantial assistance, introductions to seedgrowers, and made facilities available to support the project.About the AuthorDr Ross Downes studied at Queensland University for the B Agr Sc (1st class Honours) and M Agr Scdegrees and Cornell University, NY where he obtained the PhD degree in genetics, plant breeding,physiology and agronomy.He worked in CSIRO Plant Industry for many years where he rose to Senior Principal ResearchScientist, working in the fields <strong>of</strong> crop adaptation, plant physiology and plant breeding. He haspublished 80 scientific papers.Since 1988 he has operated as a consultant, contractor and research director <strong>of</strong> Innovative PlantBreeders. He has been Principal Investigator in four RIRDC projects.iv
ContentsForeword ...................................................................................................................................iiiAcknowledgements ................................................................................................................... ivAbout the Author....................................................................................................................... ivExecutive Summary .................................................................................................................viiFindings............................................................................................................................................ viiImplications..................................................................................................................................... viiiRecommendations ..................................................................................................................... ixCrop establishment and management................................................................................................ ixSelection <strong>of</strong> <strong>Varieties</strong> ........................................................................................................................ ixManagement <strong>of</strong> Pollination............................................................................................................... ixBreeding New <strong>Varieties</strong> .................................................................................................................... ix<strong>Evaluation</strong> <strong>of</strong> irrigation practices ...................................................................................................... ixIntroduction ................................................................................................................................ 1Outcomes and Objectives....................................................................................................................2Literature Review....................................................................................................................... 3Management........................................................................................................................................3Flowering and Tripping.......................................................................................................................3Insects and Pollination ........................................................................................................................4Fertilisation .........................................................................................................................................5Variation and Selection.......................................................................................................................6Methodology .............................................................................................................................. 8Results ...................................................................................................................................... 10Effect <strong>of</strong> Seasonal Conditions on Seed Yield ...................................................................................10Effect <strong>of</strong> Management and Location on Seed Yield .........................................................................25Performance <strong>of</strong> <strong>Varieties</strong> in Seed Production ...................................................................................29Pollination and Fertilisation ..............................................................................................................32Variation Within <strong>Varieties</strong> ................................................................................................................38Selection Within <strong>Varieties</strong> ................................................................................................................42Discussion ................................................................................................................................ 46The findings are discussed in more detail below. .............................................................................46Effect <strong>of</strong> Seasonal Conditions...........................................................................................................46Effect <strong>of</strong> Management.......................................................................................................................47Effect <strong>of</strong> Variety................................................................................................................................48Pollination .........................................................................................................................................49Variation within <strong>Varieties</strong> .................................................................................................................51Conclusions.......................................................................................................................................51Implications.............................................................................................................................. 53Crop Establishment and Management...............................................................................................53Selection <strong>of</strong> <strong>Varieties</strong> ........................................................................................................................53Breeding ............................................................................................................................................53Pollination .........................................................................................................................................54Irrigation practices ............................................................................................................................54Recommendations .................................................................................................................... 55v
Crop Establishment and Management...............................................................................................55Selection <strong>of</strong> <strong>Varieties</strong> ........................................................................................................................55Management <strong>of</strong> Pollination...............................................................................................................55Breeding New <strong>Varieties</strong> ....................................................................................................................55<strong>Evaluation</strong> <strong>of</strong> Irrigation Practices......................................................................................................55Appendices ............................................................................................................................... 56Appendix 1........................................................................................................................................56Presentation to <strong>Lucerne</strong> growers at Keith and Forbes 2000/2001.....................................................56Appendix 2........................................................................................................................................62Letters to Participating <strong>Lucerne</strong> Growers .........................................................................................62Appendix 3 Travel Grant Report......................................................................................................66A Travel Report presented to RIRDC ...................................................................................... 66Summary ...........................................................................................................................................67Travel Report............................................................................................................................ 68Itinerary.............................................................................................................................................68Purpose..............................................................................................................................................68Achievements/ Findings....................................................................................................................68Benefits .............................................................................................................................................70Recommendations.............................................................................................................................70Comments .........................................................................................................................................71Acknowledgements...........................................................................................................................71References ................................................................................................................................ 72vi
Introduction<strong>Lucerne</strong> is a valuable multi-purpose fodder plant with characteristics which make it well adapted tothe variable Australian environment. It is sown on approximately 200000 irrigated hectares for hayproduction, and alone or in mixtures under dry land conditions where its drought resistance andresilience are highly valued. In recent times it has gained acceptance as a valuable plant to dry soilsand lower water-tables in efforts to arrest the spread <strong>of</strong> dry land salinity.This report describes a research program conducted by Dr Ross Downes, Innovative Plant Breeders,and supported by RIRDC for three years, to evaluate lucerne varieties for seed yield and to investigatestrategies to enhance seed productivity. The project was developed in an effort to investigate theconsiderable discrepancy between average seed yields and superior production obtained by someexperienced seed growers. In addition, an explanation <strong>of</strong> the variation in seed productivity on anannual basis, even in irrigated crops, was needed.Figure 1 <strong>Lucerne</strong> Plants Showing Differences in Pod setThe perception <strong>of</strong> variation among varieties in yield and reliability was investigated because seedproducers have to make long term commitments when sowing fields for seed production. Improvedknowledge <strong>of</strong> factors affecting seed production was also investigated to ensure reliable production, animportant factor in gaining and maintaining an increased share <strong>of</strong> export markets.1
It was anticipated that greater understanding <strong>of</strong> the physiology <strong>of</strong> the seed production process andidentification <strong>of</strong> deficiencies in varieties would assist breeders improve seed production in varietiesbeing developed for Australian conditions. Walker et al. (1996) reported that seed growers thoughtplant breeders need to place a higher priority, during breeding programs, on selecting plant characterswhich will increase pollination efficiency and seed yield. However, neither Humphries and Auricht(2001) nor Irwin et al. (2001) in extensive reviews, mentioned past or current efforts to select lucernefor high seed yield in Australia. Consequently it was considered that this project could make avaluable contribution if it could evaluate varieties for seed yield and through identification <strong>of</strong>restraints, propose strategies to enhance seed productivity.Of the seed produced in Australia about 65% (sometimes as much as 5000 tonnes) is exported,returning up to AUD15 million. If adequate seed yields can be obtained to make seed productionmore rewarding, there is potential for a significant expansion <strong>of</strong> seed exports, particularly to the US.Although improved management practices have been identified in New South Wales, in ‘<strong>Lucerne</strong>Seedcheck’ (Walker et al., 1996), and appropriate practices are used by experienced growers in SouthAustralia, average seed yield is very low, only 250 kg/ha in South Australia and 115 kg/ha in NewSouth Wales. However some growers have obtained yields <strong>of</strong> more than one tonne/ha, indicating thataverage yield is significantly below potential.It is well recognised that an adequate plant stand is essential for good yields <strong>of</strong> seed. Growers areaware <strong>of</strong> the need to obtain good establishment at sowing, careful grazing management and adequatedisease and pest control to maintain plant populations. However some varieties have a goodreputation for consistently high seed yields but others have an inferior and variable performance.This study was designed to not only evaluate varieties for seed yield but also to determine the keycharacteristics <strong>of</strong> the varieties which contribute to their performance. However, as varieties areexposed to a large number <strong>of</strong> influences, interactions between varieties and management andenvironmental factors have to be considered. As the seed production process is determined byinitiation <strong>of</strong> flowering, numbers <strong>of</strong> flowers and duration <strong>of</strong> flowering, tripping <strong>of</strong> flowers, pollinatorsand pollination, fertilisation, pod set and seed development, a detailed examination <strong>of</strong> the reproductivebiology <strong>of</strong> lucerne was undertaken.A study <strong>of</strong> this nature requires that a large number <strong>of</strong> influences and effects be dissected and analysedto gain a thorough understanding <strong>of</strong> the issues affecting lucerne production. It is anticipated thatinterpretation <strong>of</strong> factors affecting seed production and their synthesis into a new framework willfacilitate the development <strong>of</strong> strategies to enhance seed productivity.Outcomes and Objectives<strong>An</strong> evaluation <strong>of</strong> currently available lucerne varieties and management practices<strong>An</strong> understanding <strong>of</strong> the characteristics <strong>of</strong> a lucerne variety with potential for high and stable seedyield<strong>An</strong> understanding <strong>of</strong> the various environmental and management conditions necessary for potentialyield to be realised<strong>An</strong> analysis <strong>of</strong> potential economic and environmental consequences <strong>of</strong> use <strong>of</strong> modified varieties andmanagement<strong>An</strong> indication <strong>of</strong> additional research and development needed to achieve greater productivity in thelucerne seed industry2
Literature ReviewFactors affecting lucerne seed production have been actively researched for close to 100 years. Asmany <strong>of</strong> the issues debated now are similar to those concerning seed growers and scientists inAustralia and in other countries in the past, relevant published information is reviewed here.ManagementManagement <strong>of</strong> lucerne seed crops in South Australia was discussed by Doull (1961). He consideredthat improved yield <strong>of</strong> lucerne seed is dependent on three factors, changes in management, bettercontrol <strong>of</strong> insect pests and more efficient pollination. Monitoring <strong>of</strong> South Australian lucerne seedcrops for insect attack was undertaken by Maelzer et al. (1981). They noted that lucerne produces anabundance <strong>of</strong> flowers which allows crops to compensate for insect damage. Although they consideredthe level <strong>of</strong> insect attack during their studies was below an economic threshold, De Barro (2001)estimated that the seed wasp alone caused lost export potential <strong>of</strong> $5million annually.‘<strong>Lucerne</strong> Seed Check’, a management support system addressing a large number <strong>of</strong> issues wasdeveloped in New South Wales (Walker et al., 1996). Seed growers were encouraged to keep notes,improve pest management, fertility and weed control, and pay greater attention to irrigation practices.Rincker et al. (1988) investigated appropriate practices contributing to lucerne seed production underirrigated conditions in California. Positive factors included clear warm days with little or no rainfall topromote flowering and activity <strong>of</strong> pollinating insects, control <strong>of</strong> detrimental insects, supply <strong>of</strong>effective pollinators and skilful application <strong>of</strong> irrigation water. Grandfield (1945) quoted Alter (1920)as stating that lucerne plants require some stress to force seed set. Grandfield observed that thenumber <strong>of</strong> flowers setting pods increased as humidity decreased from 90 to 10 percent. He alsoreported that 27 0 C was the optimal temperature for pod setting and that setting decreased above 37 0 C.Engelbert (1932) concluded that before the blooming period there must be sufficient water forvigorous growth <strong>of</strong> plants, a dry period at flowering to slightly stress plants aids seed set and later,when pods have set, more moisture is required to ensure pod filling. He considered that stripping <strong>of</strong>flowers is due to failure <strong>of</strong> fertilisation, and can be caused by lack <strong>of</strong> moisture, heat stress and hot drywinds. Similar conclusions were reached by Tysdal (1946) who reported poor seed set if fields wereirrigated at flowering time through competitive vegetative growth being stimulated and adverselyaffecting seed set. Favourable results were obtained with light irrigation after flowering. Clarke andFryer (1930) reported that crop failures had been attributed to unfavourable weather during floraldevelopment and rapid vegetative growth during the flowering period due to excessive soil moisture.Flowering and TrippingClarke and Fryer (1930) found that some plants consistently produced a high percentage <strong>of</strong> sterilepollen while others reliably produced fertile pollen. They quoted Gray (1925) for noting wind as anineffective agent for tripping flowers and Piper et al. (1914) for observing automatic tripping <strong>of</strong>flowers in bright sunshine in the absence <strong>of</strong> pollinating insects. Knowles (1943) reported thatoccasional plants set seed well without insect visitation because <strong>of</strong> a high degree <strong>of</strong> automatic tripping.Further, he detected considerable variation in the variety Grimm, in both tripping and pod settingbehaviour. Carlson (1946) also demonstrated considerable variation among clones in seed set.Hadfield and Calder (1936) concluded that lucerne flowers must be tripped to produce seed.Armstrong and White (1935) showed that tripping effected contact between stigma and pollen throughrupturing a thin membrane on the stigma. The anatomical structure <strong>of</strong> the lucerne flower and anexplanation <strong>of</strong> the tripping mechanism were provided by Larkin and Graumann (1954). Theyidentified two forces in tripping: pressure exerted by the sexual column from cells under tension at thejuncture <strong>of</strong> the staminal tube and the keel; and the restraining nature <strong>of</strong> keel petals that cohere due to3
interlocking finger-like projections <strong>of</strong> cutinised tissue on the appressed surfaces <strong>of</strong> the keel petal.When the force <strong>of</strong> restraint is overcome, the flower trips. Studies by Kreitner and Sorensen (1985)using electron microscopy revealed that keel petals are locked together by parallel ridges and grooves.They concluded that moisture tension facilitates tripping and speculated that intermeshed cell-wallridges partially collapse with loss <strong>of</strong> turgidity and are more easily disengaged by pollinator activity.Busbice and Wilsie (1966) found the easy-to trip-trait was highly heritable. Knapp and Teuber (1990)observed that flowers were easier to trip when the humidity was low coupled with high soil moisture.They found that under field conditions easy-to-trip plants have 230% as many flowers tripped, and41% greater seed yield than do hard-to-trip plants. They concluded that ease <strong>of</strong> tripping should bemore easily increased by breeding than by modifying field conditions. Knapp et al. (1993) determinedthat phenotypic recurrent selection is the most efficient breeding method to improve ease <strong>of</strong> tripping.Knapp and Teuber (1994) selected for increased ease <strong>of</strong> tripping in lucerne populations with a view todeveloping types that were easier to trip by honey bees. The outcrossing rate <strong>of</strong> easy-to-trippopulations did not differ from outcrossing rate <strong>of</strong> hard-to-trip groups indicating that selection for ease<strong>of</strong> tripping does not increase inbreeding, (Knapp and Teuber 1993). Plants with the ability to tripautomatically were observed to set the most seed in the current investigation.Insects and PollinationTysdal (1940) concluded that leaf-cutter bees (Megachile) and alkali bees (Nomia) were responsiblefor most <strong>of</strong> the tripping and pollination <strong>of</strong> lucerne flowers while honey bees tripped only 1% <strong>of</strong>flowers visited. Bohart (1957) reported Muller (1873) as the first to note that nectar-collecting honeybees avoid the pollination mechanism in lucerne by inserting their proboscis into the side <strong>of</strong> theflower. Rincker et al. (1988) and Petersen et al. (1972) reported that pollen collecting honey bees tripa large proportion <strong>of</strong> florets visited but nectar collecting bees trip only 2% <strong>of</strong> florets. Palmer-Jonesand Forster (1972) demonstrated that when honey bees were confined in cages in which lucerne wasthe only pollen source, lucerne pollination was enhanced. However elimination <strong>of</strong> alternative pollensources in the field, to increase cross pollination <strong>of</strong> lucerne was not considered feasible in NewZealand. Although there was increased seed production with increased bee populations <strong>of</strong> up to 11hives per hectare in Canada (Pankiw et al. 1956), it was concluded that returns did not justify costs. InSouth Australia in an extensive field experiment no relation was found between lucerne seed yield andbee numbers by Maelzer and Pinnock (1983).Tysdal (1946) reported honey bees vigorously collecting pollen and tripping lucerne when there werefew other pollen sources. Stephen (1955) noted that honey bees are <strong>of</strong> little importance in lucerneseed production in Manitoba because <strong>of</strong> the abundance <strong>of</strong> sources from which pollen can be morereadily obtained. To monitor sources <strong>of</strong> pollen collected by honey bees, Vansell and Todd (1946)examined the types <strong>of</strong> pollen in traps on bee hives. They found much more lucerne pollen in hives inUtah when fields were surrounded by desert rather than diversified crops. Near Logan, a diversifiedfarming area, no lucerne pollen was detected in hives, bees preferring pollen from Composites, cloversand Brassicas. In one study it was observed that Megachile (leaf-cutter bees) were also much moreattracted to a weed (Grindelia) than to lucerne.In Alberta, Hobbs and Lilly (1955) observed almost no lucerne pollen collected while bees took pollenfrom other legumes. In contrast, Hare and Vansell (1946) reported honey bees collected lucernepollen very actively in the Delta, Utah. In South Australia, red gum (Eucalyptus camaldulensis)flowers in December and January and competes strongly with lucerne as a pollen source (Doull 1961).Dwyer and Allman (1933) noted variable reports <strong>of</strong> the effectiveness <strong>of</strong> bees in tripping flowers butthey were able to increase seed production by caging honey bees on lucerne plants. They concludedthat hives <strong>of</strong> honey bees should be placed near lucerne seed areas.4
observed 36 and 69% pod set, and 2.4 and 3.8 seeds per pod respectively. He also noted considerablevariation among plants in pod set after self-pollination but not with cross-pollination. Bolton (1948)found that self-pollination resulted in 1.58 seeds per pod compared with 5.54 with cross-pollination.When Pharis and Unrau (1953) tripped flowers mechanically and found self-pollination resulted in32% <strong>of</strong> flowers forming pods with 1.7 seeds per pod while cross-pollination achieved 75% pod set and4.7 seeds per pod. Bolton and Fryer (1937) suggested that an accumulation <strong>of</strong> genetic factors whichcontribute to fertility may tend to retain the seed-setting stability <strong>of</strong> fertile plants even underunfavourable environmental conditions. Spafford (1938) drew attention to problems <strong>of</strong> cold weatherhindering tripping and rain at flowering time adversely affecting fertilisation. Similar observationswere made in this study.Variation and SelectionDwyer (1931) reported that although lucerne seed does not set well under natural conditions in NewSouth Wales, some individual plants set seed much better than others. He also observed a markedcorrelation between sparse vegetative development and good seed production on individual plants. Heconcluded that:‘In those districts in which seed setting in lucerne is in general very poor, there are to be found someindividual plants which set seed freely. If these are good fodder types, and if the characters <strong>of</strong> goodseed and fodder production can be fixed by selection in self fertilised lines, there will be goodprospects for evolving superior strains or types <strong>of</strong> lucerne for these districts from locally-raised seed.’The possibility that variation in seed production might be related to pollen viability was investigatedby Sexsmith and Fryer (1943). They observed little variation in viability <strong>of</strong> pollen from individualplants during the season but noted that plants differed in their pollen viability. Engelbert (1932)considered that some sterile pollen was insignificant in view <strong>of</strong> the total quantity <strong>of</strong> pollen produced.Bolton and Fryer (1937) could not find a general correlation between pollen viability and pod-settingalthough Armstrong and White (1935) considered that pollen sterility influences pod-setting andnumber <strong>of</strong> seeds per pod.Tysdal et al. (1942) and Hadfield and Calder (1936) showed that self-fertilisation leads to loss <strong>of</strong> seedand fodder yield in subsequent generations. Bolton (1948) reported Kirk as finding four generations<strong>of</strong> inbreeding reduced yield <strong>of</strong> fodder by 46% and seed by 78%. Kirk (1927) reported that onegeneration <strong>of</strong> inbreeding reduced seed yield 40% and two generations by 70% compared withoutcrossed plants <strong>of</strong> the same strain. Viands et al. (1988) concluded that self-incompatibility is onlypartially effective in preventing self-fertilization. Sayers and Murphy (1966) observed a higher level<strong>of</strong> ovule abortion after self-pollinating clones <strong>of</strong> low seed producers than <strong>of</strong> high seed producers.Forage yield losses <strong>of</strong> 32, 49 and 47% after 1,2 and 3 generations respectively <strong>of</strong> self-pollination wereobserved by various authors cited by Kimbeng and Bingham (1998). The reduced seed and forageyield following inbreeding caused Kirk (1933) and many others subsequently to discount usefulness <strong>of</strong>inbreeding in lucerne. However Tysdal and Clark (1934) demonstrated that although inbreeding canreduce seed production, with rigid selection increases in seed yield were achieved with inbreeding.Kimbeng and Bingham (1998) improved herbage yield during inbreeding through selection, whichincreases the frequency <strong>of</strong> favourable genes and reduces unfavourable alleles.In Canada, Fryer (1939) developed a selection programme to increase seed-setting in lucerne. Thiswas initiated in response to long term irregularity in seed production and variation within varietieswith some plants producing seed well in regions where seed production was poor. He was able toincrease seed production and there was no penalty in terms <strong>of</strong> fodder production in lines producinghigh seed yield. Heinrichs (1965) quoted Pedersen (1962) as stating that although lucerne breederspr<strong>of</strong>ess to have good seed production in mind, few varieties possess superiority in seed production.Walker et al. (1996) reported that seed growers thought plant breeders need to place a higher priority,6
during breeding programs, on selecting plant characters which will increase pollination efficiency andseed yield. However, neither Humphries and Auricht (2001) nor Irwin et al. (2001) in extensivereviews, mentioned past or current efforts to select lucerne for high seed yield in Australia. Heinrichs(1965) reported a breeding program to improve seed production and from progeny tests predicted a30% and a 13% increase in seed yield at two locations.Huyghe et al. (1999) reported a series <strong>of</strong> experiments to examine the components <strong>of</strong> seed yield inlucerne. The seed yield was highly correlated with harvest index and seed weight per pod. A study <strong>of</strong>the genetic variation for components <strong>of</strong> seed yield between and within 45 varieties showed greatervariance within populations than between varieties especially with respect to seed yield per plant.High seed yielding populations and low seed yielding populations exhibited similar levels <strong>of</strong> variationfor seed weight per inflorescence. The available variation suggests considerable opportunities to breedfor increased seed production.7
MethodologyThese studies were conducted in the vicinity <strong>of</strong> Keith in South Australia and Forbes in New SouthWales which are the major centres <strong>of</strong> lucerne seed production. Studies were conducted in commercialseed production fields managed by experienced Australian seed growers, with supplementaryinvestigations in nurseries and glasshouses.At the commencement <strong>of</strong> the project discussions were held with seed companies in South Australiaand New South Wales to identify appropriate growers to participate in the project. Individualapproaches were made to these growers, and a group <strong>of</strong> 3 in each area were selected. Throughout theproject, growers provided valuable information concerning management practices and theirexperiences producing lucerne seed.As these collaborators are all highly skilled growers who take particular care with crop managementincluding pest control, it was anticipated that the effects <strong>of</strong> some <strong>of</strong> the factors which can adverselyaffect production were minimised.Seed crops were visited and observations taken at regular intervals <strong>of</strong> about three weeks, during theseed production period from December until March each year. When crops were mature, sampleswere taken to allow subsequent study <strong>of</strong> parameters affecting yield. For progeny tests and additionalobservations, plots were established on a property at Bordertown, South Australia. Research findingsand implications were discussed with seed growers individually throughout the project, andpresentations were made at district meetings at both Keith and Forbes. (Appendix 1)The observations made in this project were confined to an examination <strong>of</strong> performance under currentpractices in both dry land and irrigated fields. The co-operating seed growers provided high qualitymanagement, effective weed and pest control, and the timing <strong>of</strong> operations such as cutting, flowering,and harvesting were those in common use. Possibilities outside the range considered normal practicewere not evaluated. In view <strong>of</strong> the need for isolation <strong>of</strong> crops in the process <strong>of</strong> producing certifiedseed it was not possible to establish plot trials in which varieties could be compared under identicalconditions.Independent crop monitoring services were employed by seed growers in South Australia to managepest control. Growers at Forbes used ‘<strong>Lucerne</strong> Seedcheck’, a management support system (Walker etal., 1996). Crops were most frequently set aside for seed production between mid November and midDecember which is much later than the time (equivalent to 20 October) recommended in California(Jones and Pomeroy, 1962).In general, plants were watered both to ensure that they were not stressed and to fit into a tightrotational watering regime. This did not allow for a period <strong>of</strong> moisture stress at flowering which hasbeen considered to enhance seed set (eg Engelbert, 1932). Australian seed growers consider thatattempting to generate a modest moisture stress is hazardous and difficult to manage because <strong>of</strong>possible hot and windy conditions at flowering time.Hives <strong>of</strong> honey bees were placed in fields at flowering time to aid in ensuring flowers were trippedand cross-pollinated.In some instances fields held a primary seed crop, and regrowth from the crown also flowered toprovide a double crop. Such mixtures tended to lodge, providing difficulties at harvest time incommercial crops. In thin stands, in which plants carrying mature pods were buffeted by winds, many8
pods were dislodged and were seen in the litter on the soil surface. Excellent seed yields were <strong>of</strong>tenobserved on prostrate plants which avoided wind-induced losses. Seed crops were drilled in narrowrows, as opposed to the widely spaced rows recommended for high yield in California (Peterson,1972).Plants were observed at flowering time to determine the effect <strong>of</strong> branches on the main stem on theamount <strong>of</strong> flowering and pod set on the main stem. The flowering process was studied extensively tomonitor bee populations and their activity during the day in relation to weather conditions. The extentto which bees tripped flowers was examined and the propensity <strong>of</strong> flowers to trip automatically wasnoted. The numbers <strong>of</strong> flowering racemes were recorded and the intensity <strong>of</strong> pod set noted.When crops were mature, either 10 or 25 individual stems were selected at random and collected fordetailed examination. On the main stem attributes considered were : height, number <strong>of</strong> racemes,number <strong>of</strong> pods set, and weight <strong>of</strong> pod, and seed. Weight <strong>of</strong> pods and seeds on branches was alsodetermined, as was total dry matter <strong>of</strong> the stem and branches.In the first year <strong>of</strong> the study, considerable variation in pod set was observed within individual crops soa selection exercise was undertaken to ascertain whether variation was induced by environmental orgenetic factors. Pods were collected both from plants setting a large number <strong>of</strong> pods and from plantswhich set few pods. They were then threshed to provide sowing seed from both high and low seedsetting plants in a number <strong>of</strong> varieties. Seed was sown in a nursery near Bordertown, South Australia,in which progenies were observed at flowering and during pod set. Random stems were selected atmaturity for dissection and detailed examination.The possibility that a considerable amount <strong>of</strong> the automatic flower tripping observed might result inself-pollination was investigated. To provide genetic markers, white-flowered plants were selected invarious crops and seed was harvested when crops matured. Seed from individual white floweredplants was sown in a nursery and numbers <strong>of</strong> plants with blue and white flowers were recorded.In June 2000 a RIRDC Travel Grant made it possible to attend the 37 th North American AlfalfaImprovement Conference in Madison Wisconsin, which provided much useful information andenabled the developing <strong>of</strong> an extensive network <strong>of</strong> researchers and growers , with whom contact hasbeen maintained. Throughout the project discussions have been held with Emeritus Pr<strong>of</strong>essor RoyceMurphy from Cornell, NY, who have given freely <strong>of</strong> his time, and provided some very useful insights,particularly in the interpretation <strong>of</strong> results. ( Appendix 3)9
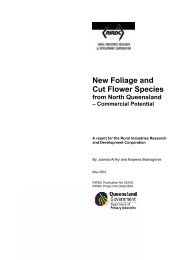
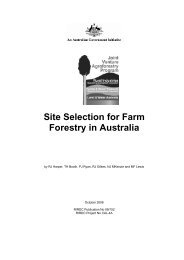
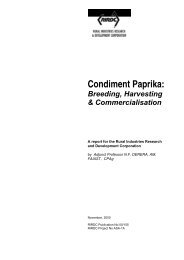
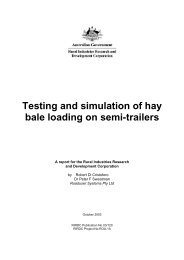
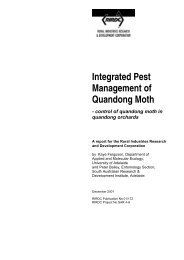
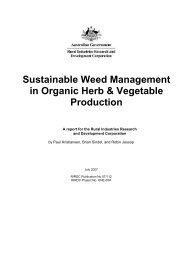
ResultsEffect <strong>of</strong> Seasonal Conditions on Seed Yield<strong>Lucerne</strong> seed production depends on the number <strong>of</strong> plants or stems per hectare and on the seed yieldper plant. In seed production blocks, plant stand varies both with location and within fields but isrelatively stable from year to year. The number <strong>of</strong> plants establishing per hectare reflect sowing rate,pest attack and conditions after germination. Subsequently, numbers <strong>of</strong> plants surviving depend onmanagement conditions, disease attack, weed competition and age <strong>of</strong> plants. Under irrigatedconditions the number <strong>of</strong> plants per hectare is not normally limited by moisture stress and variesbetween 10 and 25 or more per m 2 . The stand in dry land crops tends to be lower because plants arelost due to summer drought. In this case the stand is commonly in the range <strong>of</strong> 6 to 10 plants per m 2 .Individual plants can produce a large number <strong>of</strong> shoots or stems, producing a dense crop to utiliseavailable environmental resources <strong>of</strong> light and water. Plants can also compensate for loss <strong>of</strong> stand byproducing shoots from the crown so that individual plants may possess more than 20 stems. Datashown in Figure 2) indicate a relationship between stems per plant and plant number. The result isfrequently a population <strong>of</strong> 150 to 200 stems per m 2 . The relationship between plant stand and number<strong>of</strong> stems per m 2 is shown in Figure 3. It appears that number <strong>of</strong> stems per hectare is extremelyimportant in determining seed yield potential, with low stem number severely limiting yield.Conversely, the highest seed yield per hectare observed in the three years <strong>of</strong> this study was a harvestedyield <strong>of</strong> 1400 kg/ha, in a field in which a very high number (320) <strong>of</strong> stems per m 2 was recorded. Thiswas also the highest population <strong>of</strong> stems per m 2 observed. In dry land situations plant population islower, and compensation by stem numbers frequently leads to 100 or 120 stems per m 2 .In view <strong>of</strong> the significance <strong>of</strong> the population <strong>of</strong> stems per hectare in determining both potential andrealised yield, it is important to recognise that thin stands impose ceilings on yield potential. In thecrop analyses reported in this study the average weight <strong>of</strong> seed per stem was 0.53 grams in irrigatedcrops. In dry land crops the average yield was 0.46 grams per stem. The substantial effect <strong>of</strong> numbers<strong>of</strong> stems per hectare is illustrated in the yield projections shown in Table 1. ∗SD is standard deviationabout the meanTable 1. Expected lucerne yield per hectare (kg/ha)Crop typeWt seed per stemgrams100 stems per m 2 150 stems per m 2 200 stems per m 2Irrigated crops 0.78 mean + SD* 780 1170 15600.53 (mean) 530 795 10600.28 mean - SD 280 420 560Dryland crops 0.67 mean + SD 670 1005 -0.46 (mean) 460 690 -0.25 mean - SD 250 375 -Theoretical 1.00 1000 1500 200010
Plants and stems per m2302520Stems/plant1510500 10 20 30Stand: plants/m2Figure 2 Relationship between plant numbers and stems on plants11
Plants and stems per m2350300250Stems/m22001501005000 10 20 30Stand: plants/m2Figure 3 Relationship between stem and plant numbers12
Some varieties under some circumstances produced about 1 gram <strong>of</strong> seed per stem under both irrigatedand dry land conditions. Under suitable conditions and 100 and 200 stems per m 2 , yields <strong>of</strong> 1000 kgand 2000 kg/ha can be expected under dry land and irrigated conditions respectively.Although plant stand and branch number are extremely important in determining the potential andrealised seed yield, they reflect standard management techniques rather than varietal characteristicsand will not be addressed particularly in this report. Rather, the emphasis will be on seed productionper stem. For this purpose stems were randomly selected in fields as the crops reached maturity.The following data, obtained in a field <strong>of</strong> ‘Aquarius’ provide an indication <strong>of</strong> the variation in crops indifferent years. Stems on an irrigated crop at Keith were sampled and dissected.Table 2. Seed yield components ‘Aquarius’ 1Year 1999 2000 2001 LSDRacemes per mainstem7.7b 12.5a 11.2a 2.2Number <strong>of</strong> pods 42.1a 52.1a 20.1b 21.0Pods per raceme 5.32a 4.29a 1.65b 1.84Total seed weight 0.45a 0.51a 0.05b 0.23Seed weight per100 pods0.65 a 0.60a 0.18b 0.17Harvest Index 0.16a 0.19a 0.00b 0.05These data indicate that seed yield per stem was much greater in 1999 and 2000 than in 2001. Similaryields were realised whether there were 7.7 or 12.5 racemes on the main stem in the first two years. In1999, although there were fewer racemes produced than in the other two years, number <strong>of</strong> pods set andseed production was not reduced. This suggests that if there is a good early seed set, the development<strong>of</strong> further flowers is reduced as the plant concentrates resources into seed production In the third yearnot only were there fewer pods set, but the seed weight per pod and therefore and weight <strong>of</strong> seed wasreduced. The much poorer performance in this field was not reflected in other crops in 2001. It islikely that this particular field experienced a catastrophic event about flowering time, which reducedpod set, seed weight per pod and consequently the seed yield and harvest index.In contrast, results from stems on another irrigated crop <strong>of</strong> ‘Aquarius’ at Keith, sampled in 1999 and2001, (Table 3) show that the variety performed better in 2001 than in 1999 through higher seedproduction per stem which reflected higher seed weight per pod. This indicates better pollination in2001 than in 1999. However in their both Tables 2 and 3 illustrate considerable variation betweenyears in seed production in two fields.13
The Board <strong>of</strong> Directors and the General Manager/Chief Operating Officer 65• Ask for an employment contract. A general manager should have an employmentcontract, or at least a letter <strong>of</strong> agreement, from the club’s board. It isalways wise to have employment terms and conditions in writing, especiallyif the club’s board changes annually. The general manager should make surethis document is updated and signed each time he or she goes through a benefitor compensation review.• Work with the club’s committees. Club committees are resources that generalmanagers should tap into. General managers should make an effort to knowwhat’s going on with the club’s committees and attend as many <strong>of</strong> their meetingsas possible. A general manager who works closely with club committees<strong>of</strong>ten has greater membership support.• Continue your education. It becomes more important every year for club generalmanagers to continue their educations. Some general managers are ableto put aside funds in the club’s annual budget for pr<strong>of</strong>essional development.Educational opportunities give general managers a chance to pick up moneysavingideas and other ways to improve their clubs.• Communicate, communicate, communicate. Communication is a general manager’slifeline. He or she must keep in touch with the membership. Generalmanagers should listen to the vocal minority, but not forget to communicatewith the silent majority. A great way to keep in touch is by writing a monthlyarticle in the club newsletter. Also, the general manager must communicatewith the board about everything going on at the club. The general managershould never spring any last-minute surprises on the board.• Don’t forget the basics. Do communicate. Do be visible to the membership. Dodress the part. Do continue to improve the club for the members, makingsure that you know what they really want. Do continue your education—keepmoving ahead in your career.• Don’t use the club. This may sound surprising, but many experienced clubgeneral managers maintain that a general manager shouldn’t use his or herclub—ever. 7 General managers who frequently play on their club’s golf courseor use other club facilities may regret it because, inevitably, at least a few <strong>of</strong>the club’s members will frown on it, or make remarks such as the following:“Gee, I couldn’t get a tee time this morning, but I noticed the club managerdidn’t have any trouble getting on the course.” The key to success in usingclub facilities is for the manager to always use club facilities with discretion.Pr<strong>of</strong>essional DevelopmentBecause <strong>of</strong> the constantly changing nature <strong>of</strong> the club industry, a club generalmanager’s education should be ongoing. Fortunately, there are many pr<strong>of</strong>essionaldevelopment opportunities available.Club Managers Association <strong>of</strong> America. The Club Managers Association <strong>of</strong>America (CMAA) is a major source <strong>of</strong> pr<strong>of</strong>essional development opportunities for
Table 5. Seed yield ‘Aurora’Year 1999 2000 2001 LSDRacemes per mainstem9.9a 13.8a 11.7a nsNumber <strong>of</strong> pods 36.8a 37.2a 28.9a nsPods per raceme 3.81a 2.81a 2.80a nsTotal seed weight 0.28a 0.18a 0.20a nsSeed weight per100 pods0.34a 0.20b 0.41a 0.11Harvest Index 0.10a 0.05b 0.10a 0.04In an analysis <strong>of</strong> a crop <strong>of</strong> Genesis and Keith, Table 6, variation within the variety again made itdifficult to establish differences among the yield components in different years. However the lownumber <strong>of</strong> pods per raceme in 2000 was reflected in a low harvest index in contrast to 1999 when ahigh number <strong>of</strong> pods contributed to a high harvest index. The low number <strong>of</strong> pods per raceme in 2000is an indication that adverse conditions prevailed at pollination time. The low harvest index indicatesthat excess vegetative growth may have competed with reproductive growth during the period <strong>of</strong> podsetting. A different effect <strong>of</strong> season was shown by ‘Hunter River’ (Table 7)Table 6. Seed yield components ‘Genesis’Year 1999 2000 2001 LSDRacemes per main stem 11.3a 15.4a 12.7a nsNumber <strong>of</strong> pods 60.0a 35.3a 62.3a nsPods per raceme 5.49a 2.32b 4.68a 1.55Seed weight 0.64a 0.32a 0.48a nsSeed weight per 100 pods 0.66a 0.43a 0.50a nsHarvest Index 0.20a 0.11b 0.14b 0.05Table 7 Seed yield components ‘Hunter River’ 1Year 1999 2001 LSDRacemes per main stem 9.3a 7.9a nsNumber <strong>of</strong> pods 23.0b 47.3a 18.9Pods per raceme 2.46b 6.09a 2.13Total seed weight 0.18b 0.53a 0.17Seed weight per 100 pods 0.50b 0.76a 0.23Harvest Index 0.12b 0.23a 0.0615
In this irrigated field <strong>of</strong> ‘Hunter River’ the number <strong>of</strong> racemes remained fairly constant over threeyears, although the number <strong>of</strong> pods on the main stem and the number <strong>of</strong> pods per raceme increasedfrom 1999 to 2001. As both the number <strong>of</strong> racemes and the pod numbers were low in 1999 it appearsthat pods were aborted after the main stem had lost the ability to produce more flowers to compensatefor poor pod set. The exceptional performance <strong>of</strong> the variety in 2001 reflects the high number <strong>of</strong> podsset and large number <strong>of</strong> pods per raceme. In addition the seed weight per pod indicates excellentpollination conditions in 2001. These factors contributed to a much higher harvest index in 2001 thanin 1999.In a further crop <strong>of</strong> ‘Hunter River’ results (Table 8) are similar in many respects to those in Table 7indicating that 2001 was an exceptionally good year for ‘Hunter River’ seed production. The number<strong>of</strong> racemes increased in 2000, suggesting that additional racemes developed and flowered tocompensate for poor pod set in the earliest flowering racemes. The exceptional seed weight realised in2001 reflects the total number <strong>of</strong> pods set and number <strong>of</strong> pods set per raceme. The high weight <strong>of</strong>seed per pod in each year indicates a high level <strong>of</strong> pollen availability to affect fertilisation in this field.Table 8. Seed yield components ‘Hunter River’ 2Year 1999 2000 2001 LSDRacemes per mainstem8.4b 12.3a 10.4ab 2.7Number <strong>of</strong> pods 24.6b 34.2b 74.0a 17.4Pods per raceme 2.95b 2.79b 7.61a 1.95Seed weight (T) 0.29b 0.47b 0.92a 0.38Seed weight per100 pods0.61a 0.68a 0.76a nsHarvest Index 0.18a 0.15a 0.22a nsTable 9 demonstrates variation in the performance <strong>of</strong> ‘Salado’. As the number <strong>of</strong> racemes was low in1999 it appears that good early pod set was achieved. In contrast, plants continued to produceadditional racemes in 2000, presumably to compensate for poor pod set per raceme and low seedweight per pod. These observations probably reflect poor pollination conditions in 2000. High levels<strong>of</strong> vegetative production to produce additional racemes coupled with poor seed production contributedto the poor harvest index in 2000. Despite the additional vegetative development and low harvestindex in 2000, the total seed weight was comparable in the three years.Table 9. Seed yield components ‘Salado’Year 1999 2000 2001 LSDRacemes per main stem 7.3b 18.3a 14.5a 4.1Number <strong>of</strong> pods 34.8a 44.4a 55.0a nsPods per raceme 4.77a 2.48b 4.16a 1.55Seed weight (T) 0.36a 0.39a 0.49a nsSeed weight per 100 pods 0.58a 0.41b 0.59a 0.14Harvest Index 0.17a 0.08b 0.14a 0.0416
Stems on an irrigated crop <strong>of</strong> ‘Siriver’ at Keith were sampled over three years (Table 10). In thisvariety there was no statistical difference among years in yield components. Despite the relatively lownumber <strong>of</strong> racemes there was high level <strong>of</strong> pod set and large number <strong>of</strong> pods per raceme. This varietyin this field exhibited a constant performance over the three years.Table 10. Seed yield components ‘Siriver’1Year 1999 2000 2001 LSDRacemes per mainstem9.1a 10.3a 8.5a nsNumber <strong>of</strong> pods 58.2a 79.5a 57.6a nsPods per raceme 6.16a 7.75a 6.46a nsTotal seed weight 1.05a 0.61a 0.58a nsSeed weight per100 pods0.71a 0.56a 0.71a nsHarvest Index 0.19a 0.15a 0.17a nsSimilar observations (Table 11), indicate that the performance <strong>of</strong> ‘Siriver’ over 1999 and 2001 wasstable with rapid pod set reflected in the low raceme number. High seed weight and high seed weightper pod resulted in a high harvest index.Table 11. Seed yield components ‘Siriver’ 2Year 1999 2001 LSDRacemes per main stem 9.1a 11.4a nsNumber <strong>of</strong> pods 46.0a 39.9a nsPods per raceme 4.94a 4.21a nsTotal seed weight 1.01a 0.82a nsSeed weight per 100pods0.97a 0.83a nsHarvest Index 0.26a 0.21a nsThe crop <strong>of</strong> ‘Siriver’ shown in Table 12, continued to grow in 2000, and produce additional racemescompared with 1999 indicating that initial pod set was low. This led to more pods being set so that thenumber <strong>of</strong> pods per raceme did not differ significantly between the two years. The total seed weightwas greater in 2000 than in 1999.17
Table 12. Seed yield components ‘Siriver’ 3Year 1999 2000 LSDRacemes per main stem 8.0b 13.3a 3.2Number <strong>of</strong> pods 25.5b 46.3a 19.8Pods per raceme 3.22a 3.62a nsTotal seed weight 0.52b 0.79a 0.25Seed weight per 100pods0.67a 0.56a nsHarvest Index 0.14a 0.19a nsIn ‘Sirosal’, (Table 13) it appears that additional racemes were produced in 2000 and 2001 tocompensate for a modest pod set. The data also indicate a superior seed set per pod in 1999. Thiscontributed to a higher harvest index in 1999 than in subsequent years.Table 13. Seed yield components ‘Sirosal’Year 1999 2000 2001 LSDRacemes per mainstem7.4b 13.0a 13.8a 2.4Number <strong>of</strong> pods 47.2a 69.3a 64.8a nsPods per raceme 6.93a 5.22a 4.73a nsSeed weight (T) 0.81a 0.84a 0.62a nsSeed weight per100 pods0.75a 0.42b 0.56b 0.18Harvest Index 0.23a 0.17b 0.12c 0.03The variety L69, Table 14, exhibited a stable performance. In this respect its performance was similarto that <strong>of</strong> ‘Siriver’ (see Table 10). The high number <strong>of</strong> pods per raceme and a high seed weight perpod are indicators <strong>of</strong> a high yield . These factors contributed to high seed yield and harvest index.Table 14. Seed yield components ‘Pioneer L69’1Year 1999 2000 2001 LSDRacemes per main stem 8.5a 10.2a 10.8a nsNumber <strong>of</strong> pods 44.3a 60.8a 72.6a nsPods per raceme 5.14a 5.83a 6.80a nsSeed weight (T) 0.84a 0.83a 1.10a nsSeed weight per 100 pods 0.89a 0.80a 1.00a nsHarvest Index 0.23a 0.23a 0.26a ns18
<strong>An</strong>other crop <strong>of</strong> ‘L69’ (Table 15) also exhibited stability in performance over the sampling period butthe performance <strong>of</strong> this crop was inferior to that reported in Table 14.Table 15. Seed yield components ‘Pioneer L69’ 2Year 1999 2000 LSDRacemes per main stem 8.2b 11.8a 3.5Number <strong>of</strong> pods 29.9a 43.4a nsPods per raceme 3.61a 4.08a nsTotal seed weight 0.25a 0.46a nsSeed weight per 100pods0.60a 0.67a nsHarvest Index 0.17a 0.19a nsThe performance <strong>of</strong> ‘Trifecta’ was also constant over three years (Table 16). There was a tendency forthe variety to continue to produce new racemes to counter a modest pod set in 2000. Overall thevariety produced high seed yield and a high harvest index. The performance <strong>of</strong> this variety wassimilar to that <strong>of</strong> ‘Siriver’ and ‘Pioneer L69’.Table 16. Seed yield components ‘Trifecta’ 1Year 1999 2000 2001 LSDRacemes per mainstem10.9a 13.7a 13.2a nsNumber <strong>of</strong> pods 55.4a 42.9a 57.0a nsNumber <strong>of</strong> podsper raceme5.26a 3.51a 4.38a nsTotal seed weight 0.89a 0.77a 0.99a nsSeed weight per100 pods0.87a 0.67a 0.79a nsHarvest Index 0.26a 0.22a 0.21a nsIn contrast to the data in Table 16, in another crop <strong>of</strong> ‘Trifecta’, Table 17, the number <strong>of</strong> pods set perraceme and per stem was greater in 2001 than in 2000. The seed weight per pod was much lower in2000 suggesting poor pollination conditions. This contributed to the low harvest index in 2000. Inview <strong>of</strong> the data in Table 16 it appears that the depression <strong>of</strong> yield components in 2000 reflectsmanagement or soil problems depressing yield in 2000.19
Table 17. Seed yield components ‘Trifecta’ 2Year 2000 2001 LSDRacemes per main stem 12.4a 11.8a nsNumber <strong>of</strong> pods 36.2b 64.3a 26.5Pods per raceme 3.05b 5.58a 1.75Total seed weight 0.49b 0.96a 0.46Seed weight per 100 pods 0.33b 0.66a 0.22Harvest Index 0.11b 0.18a 0.07The variety ‘Flairdale’, Table 18, performed poorly in 2000 through poor pod set per raceme and perplant. The low seed weight per pod also suggests that pollen availability was lower than in the othertwo years. Poor pod and seed set in 2000 depressed the value <strong>of</strong> the harvest index.Table 18. Seed yield components ‘Flairdale’Year 1999 2000 2001 LSDRacemes per main stem 7.3a 11.4a 10.1a nsNumber <strong>of</strong> pods 44.5a 20.4b 42.6a 16.7Pods per raceme 6.58a 1.63c 4.74b 1.69Seed weight (T) 0.41a 0.24a 0.38a nsSeed weight per 100 pods 0.69a 0.46b 0.77a 0.21Harvest Index 0.21a 0.10b 0.20a 0.06At Forbes ‘Aurora’ (Table 19) produced more racemes per stem in 2000 compared with the otheryears presumably to compensate for poor initial pod set. The data suggest that plants were able tocompensate for this as other yield components were not significantly different among the three years.The performance <strong>of</strong> this variety was relatively stable over the three seasons.Table 19. Seed yield components ‘Aurora’Year 1999 2000 2001 LSDRacemes per main stem 8.7b 13.6a 9.6b 3.1Number <strong>of</strong> pods 47.0a 60.8a 57.9a nsPods per raceme 5.38a 5.06a 5.93a nsSeed weight (T) 0.34a 0.34a 0.40a nsSeed weight per 100 pods 0.51a 0.34a 0.43a nsHarvest Index 0.16a 0.14a 0.16a ns20
‘Genesis’, planted at Forbes, (Table 20) produced a comparable number <strong>of</strong> racemes per stem in thethree years but the number <strong>of</strong> pods set and the number <strong>of</strong> pods per raceme were much higher in 2001than in the other years. However in 1999 seed production on branches compensated for poor pod seton the main stem. In 2000 the total seed weight was very low as was the weight <strong>of</strong> seed per pod, andthe harvest index. Not only was the pod set poor but the seed weight per pod indicates low pollenavailability for fertilisation.Table 20. Seed yield components ‘Genesis’ 1Year 1999 2000 2001 LSDRacemes per mainstem12.9a 12.1a 12.3a nsNumber <strong>of</strong> pods 43.1b 27.1b 75.3a 30.3Pods per raceme 3.52b 2.58b 6.36a 2.42Seed weight (T) 0.62a 0.12b 0.69a 0.40Seed weight per100 pods0.73a 0.16b 0.61a 0.22Harvest Index 0.20a 0.04b 0.21a 0.08In another field at Forbes different results were obtained in an irrigated crop <strong>of</strong> ‘Genesis’ sampled overthree years and results are summarised in Table 21.In this field ‘Genesis’ produced more racemes in 2000 than in the other years but there were nostatistical differences in total number <strong>of</strong> pods, number <strong>of</strong> pods per raceme or total seed weight due toconsiderable variation in the populations. However there was a greater seed weight per pod andharvest index in 1999.Table 21. Seed yield components ‘Genesis’2Year 1999 2000 2001 LSDRacemes per mainstem9.6b 15.6a 10.9b 4.0Number <strong>of</strong> pods 50.2a 62.5a 44.0a nsPods per raceme 5.59a 4.16a 4.09a nsTotal seed weight 0.86a 0.37a 0.47a nsSeed weight per100 pods0.65a 0.31b 0.39b 0.15Harvest Index 0.21a 0.10b 0.13b 0.05Stems on another irrigated crop <strong>of</strong> ‘Genesis’ at Forbes were sampled over three years and results aresummarised in Table 22. Although there was no significant difference in numbers <strong>of</strong> pods or number<strong>of</strong> pods per raceme, there was more seed set in 1999 through seed production on branches. As shownin Table 21, the seed weight per pod was higher in 1999 than subsequently.21
Table 22 Seed yield components <strong>of</strong> ‘Genesis’ 3Year 1999 2000 2001 LSDRacemes per mainstem12.6a 13.7a 13.8a nsNumber <strong>of</strong> pods 62.2a 67.9a 43.2a nsPods per raceme 4.65a 4.61a 3.69a nsTotal seed weight 0.80a 0.31b 0.37b 0.34Seed weight per100 pods0.81a 0.33b 0.46b 0.16Harvest Index 0.21a 0.10b 0.13b 0.06Similar results were obtained in another irrigated crop <strong>of</strong> ‘Genesis’ at Forbes which was sampled overtwo years, Table 23. This site was monitored for two years and yield was much lower in 2000 than in1999. There was no significant difference between years in racemes and pods on the main stem orpods per raceme but the total seed weight with a major contribution from branches was greater in1999. In 1999 the weight <strong>of</strong> seed per pod was much higher, indicating better pollination and/orfertilisation conditions than in 2000. The low seed weight contributed to the harvest index beingextremely low in 2000.Table 23. Seed yield components <strong>of</strong> ‘Genesis’ 4Year 1999 2000 LSDRacemes per main stem 11.6a 11.9a nsNumber <strong>of</strong> pods 43.8a 37.1a nsPods per raceme 4.06a 3.27a nsTotal seed weight 0.55a 0.11b 0.23Seed weight per 100pods0.57a 0.22b 0.12Harvest Index 0.18a 0.05b 0.04Stems on a dry land crop <strong>of</strong> ‘Siriver’ at Keith were sampled over three years (Table 24) . Seed weightper 100 pods was greatest in 1999 and 2000, reflecting better pollination or fertilisation conditions.Otherwise these dry land crops did not vary over the three years.Table 24. Seed yield components ‘Siriver’Year 1999 2000 2001 LSDSeed weight (T) 0.84a 0.50a 0.44a nsSeed weight per 100 pods 0.80a 0.87a 0.55b 0.23Harvest Index 0.26a 0.20a 0.19a ns22
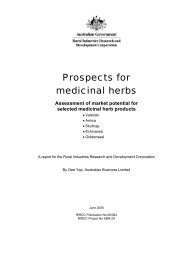
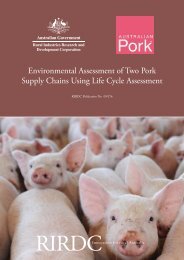
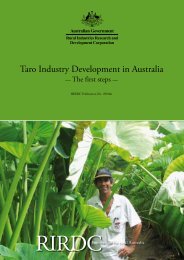
Stems on a dryland crop <strong>of</strong> ‘Hunter River’ at Keith were sampled over three years (Table 25). Therewas no variation detected in the components <strong>of</strong> yield <strong>of</strong> dry land ‘Hunter River over three yearsindicating these dry land crops were exposed to similar conditions each year.Table 25. Seed yield components <strong>of</strong> ‘Hunter River’Year 1999 2000 2001 LSDTotal seed weight 0.48a 0.67a 0.49a nsSeed weight per 100 pods 0.80a 0.67a 0.84a nsHarvest Index 0.17a 0.26a 0.19a nsStems on a dry land crop <strong>of</strong> ‘Trifecta’ at Keith were sampled during 1999 and 2000, Table 26. Thiscrop <strong>of</strong> ‘Trifecta’ was stable in performance in the two years it was observed.Table 26. Seed yield components <strong>of</strong> dry land ‘Trifecta’Year 1999 2000 LSDTotal seed weight 0.35a 0.23a nsSeed weight per 100 pods 0.66a 0.76a nsHarvest Index 0.18a 0.17a nsStems on a dry land crop <strong>of</strong> ‘Genesis’ at Keith were sampled over three years ,Table 27. Theperformance <strong>of</strong> this field <strong>of</strong> ‘Genesis’ varied considerably from a high total seed weight in 1999, to alow total seed weight in 2000. The seed weight per 100 pods was also low in 2000 and this contributedto a low harvest index that year. It appears that yield <strong>of</strong> this variety is less stable under dry landconditions than is yield <strong>of</strong> ‘Siriver’, ‘Hunter River’ and ‘Trifecta’. (Tables 24, 25 and 26).Table 27. Seed yield components <strong>of</strong> ‘Genesis’Year 1999 2000 2001 LSDTotal seed weight 0.66a 0.17b 0.38ab 0.34Seed weight per 100 pods 0.58ab 0.41b 0.81a 0.31Harvest Index 0.17a 0.08b 0.21a 0.08In any year it is difficult to compare the performance <strong>of</strong> one variety in different fields, or to comparevarieties in different fields because <strong>of</strong> different management and conditions. However if comparisonsare made over a period <strong>of</strong> years pronounced effects <strong>of</strong> seasonal conditions on yield parameters can bedemonstrated. Data for weight <strong>of</strong> seed from 100 pods were plotted against yield <strong>of</strong> seed harvested inFigure 3. This shows the relationships in four fields over three years. In one year at Forbes cool wetconditions did not greatly affect pod set. This indicates that flowers were tripped but the fertilisationprocess was disrupted so that very few ovules per pod developed into seeds. This demonstrates thatseasonal conditions can override varietal and management effects. In the three years the average yield<strong>of</strong> seed harvested was 604, 131 and 478 kg/ha. This variation was far greater than differences amongthe varieties as indicated by standard deviations <strong>of</strong> 195, 60 and 66 kg/ha for the three years.23
Seed yield vs seed/pod, Forbes,three years900800700600seed harvest kg/ha50040030020010000 0.2 0.4 0.6 0.8 1weight seed/100 pods (g)Figure 4 Seed yield vs Weight <strong>of</strong> seed/pod at Forbes, over 3 years24
Effect <strong>of</strong> Management and Location on Seed YieldAlthough performance <strong>of</strong> lucerne varieties may change from year to year with changing seasonalconditions, performance is affected by irrigation timing, flowering time and soil within and betweenfarms. The extent <strong>of</strong> such effects is shown in the following data.Stems on dry land crops <strong>of</strong> ‘Aurora’ at Keith were sampled over three years, Table 28. The dataindicate that effects due to seasons were more significant than differences due to local effects. Forexample performance <strong>of</strong> the variety was superior at both sites in 2001 than in 1999 with total seedweight, seed weight per 100 pods and harvest index all lower in 1999. In one field the harvest indexwas lower than in the other in 1999. In 2000 the seed weight per 100 pods was higher in one fieldthan in the other. This suggests conditions favoured pollen production, pollination or fertilisationmore in one field than in the other.Table 28. Seed yield components Aurora’Grower 1 1 1 2 2 2Year 1999 2000 2001 1999 2000 2001 LSDSeed weight(T)Seed weightper 100 pods0.11b 0.39a 0.44a 0.28ab 0.25ab 0.48a 0.250.28b 0.70a 0.70a 0.48b 0.47b 0.80a 0.26Harvest Index 0.05c 0.18ab 0.16ab 0.13b 0.13b 0.21a 0.07Stems on irrigated and semi-dryland crops <strong>of</strong> ‘Siriver’ were sampled on two farms at Keith in1999.The results, Table 29, demonstrated that in ‘Siriver’ at Keith, one fully irrigated crop did notdiffer from a dryland crop on the same farm in any <strong>of</strong> the seed yield components. At the other site,seed yield was enhanced by full irrigation, as was the seed weight <strong>of</strong> 100 pods and the harvest index.In comparing the two crops with limited irrigation, on one farm flowering stopped abruptly and fewerpods were set on the stem and per raceme than on the other farm. This was reflected in markeddifferences in total seed weight and harvest index. There were considerable differences between thetwo irrigated crops. They differed in number <strong>of</strong> racemes produced and number <strong>of</strong> pods set. Howeverin the field in which plants produced fewer pods per stem plants compensated by producing greaterseed weight per pod reflecting better pollination and fertilisation. These results indicate the significantdifferences between fields which particularly affected pollination.Table 29. Seed yield components ‘Siriver’ 1999TreatmentSite 1 Site 1 Site 2 Site 2OneIrrigationFullyIrrigatedOneIrrigationFullyIrrigatedRacemes per main stem 11.8ab 13.2a 8.0c 9.1bc 3.4Number <strong>of</strong> pods 70.8a 74.1a 25.5b 46.0b 25.6Pods per raceme 6.14a 5.91a 3.22b 4.94ab 2.17Seed weight (T) 1.03a 0.68ab 0.25b 1.01a 0.52Seed weight per 100 pods 0.74ab 0.55b 0.67b 0.97a 0.23Harvest Index 0.21ab 0.17bc 0.14c 0.26a 0.06LSD25
In a comparison between a dryland crop, a crop with one irrigation and a completely irrigated crop,fields <strong>of</strong> ‘Hunter River’ were monitored at Keith in 1999 (Table 30). When three levels <strong>of</strong> watersupply were provided to crops <strong>of</strong> ‘Hunter River’ in 1999 there were no statistical differences inracemes produced or numbers <strong>of</strong> pods. Although there were fewer pods per raceme under dryconditions, there was no statistical difference between treatments in total seed per stem, seed weight <strong>of</strong>100 pods or harvest index. The dry land crop was grown on residual soil water from the winter andspring and was ready for harvest in January while the two irrigated crops were mature in March.Consequently the constant value <strong>of</strong> total seed weight and pod weight indicates that these factors werenot much affected by time <strong>of</strong> flowering.Table 30. Seed yield components <strong>of</strong> ‘Hunter River’Treatment dry one irrigation irrigated LSDRacemes per mainstem8.7a 7.4a 8.7a nsNumber <strong>of</strong> pods 23.4a 33.1a 47.5a nsPods per raceme 2.57b 4.58a 5.29a 2.01Total seed weight 0.48a 0.32a 0.54a nsSeed weight per100 pods0.80a 0.60a 0.76a nsHarvest Index 0.17a 0.19a 0.24a nsStems were collected from an irrigated and a dry land crop <strong>of</strong> ‘Aurora’ at Forbes in 1999 (Table 31).There were no statistical differences between dry land and irrigated plants in parameters affecting seedyield. This illustrates the fact that yield differences between dry land and irrigated lucerne seed cropscan be primarily determined by number <strong>of</strong> stems per hectare rather than by seed production on theindividual stems.Table 31. Seed yield components <strong>of</strong> ‘ Aurora’Treatment Irrigated Dryland LSDRacemes per main stem 9.9a 6.4a nsNumber <strong>of</strong> pods 36.8a 31.1a nsPods per raceme 3.81a 4.20a nsTotal seed weight 0.28a 0.43a nsSeed weight per 100pods0.34a 0.42a nsHarvest Index 0.10a 0.15a nsPerformance <strong>of</strong> ‘Aurora’ (Table 32) grown at one site was constant over the two years but in the otherthere were more racemes in 2001 and fewer pods per raceme. In 1999 there was compensation forfewer racemes per main stem at one site by increased number <strong>of</strong> pods per raceme in contrast to theother site. In both years the seed weight per 100 pods was similar indicating comparable pollinationconditions, and there was no significant difference between sites.26
Table 32. Seed yield components <strong>of</strong> ‘Aurora’Site 1 Site 1 Site 2 Site 2Treatment 1999 2001 1999 2001 LSDRacemes per main stem 11.7a 9.6ab 7.8b 11.1a 2.8Number <strong>of</strong> pods 46.2a 42.3a 57.0a 38.8a nsPods per raceme 3.97b 4.40b 7.83a 3.62b 2.6Total seed weight 0.53a 0.33a 0.46a 0.35a nsSeed weight per 100 pods 0.51a 0.49a 0.65a 0.63a nsHarvest Index 00.16a 0.13a 0.23a 0.17a nsTable 33, a comparison <strong>of</strong> the effect <strong>of</strong> overhead and flood irrigation on crops at Keith in 2001, showsno difference in the two types <strong>of</strong> irrigation except in seed weight per 100 pods and harvest index. Thelower seed weight per pod may reflect the adverse effect <strong>of</strong> overhead irrigation during pollination andfertilisation.Table 33. Seed yield components <strong>of</strong> crops with overhead and flood irrigationYear Overhead (pivot) Flood LSDRacemes per main stem 10.4a 11.4a nsNumber <strong>of</strong> pods 48.9a 39.9a nsPods per raceme 4.59a 4.21a nsTotal seed weight 0.86a 0.82a nsSeed weight per 100 pods 0.51b 0.83a 0.32Harvest Index 0.13b 0.21a 0.07To provide another comparison between flood and overhead irrigation systems at Keith, yieldcomponents were measured on stems, Table 34. There were no significant differences between floodand overhead irrigation treatments in this case except for number <strong>of</strong> racemes on the main stem.Table 34. Seed yield components <strong>of</strong> crops with flood and overhead irrigation.Treatment Flood Overhead LSDRacemes per main stem 12.9a 9.6b 2.3Number <strong>of</strong> pods 43.3a 35.8a nsPods per raceme 3.63a 4.32a nsTotal seed weight 0.53a 0.35a nsSeed weight per 100 pods 0.65a 0.64a nsHarvest Index 0.14a 0.17a ns27
In Table 35 Stems on irrigated crops <strong>of</strong> ‘Genesis’ in fields at Forbes and Keith were sampled overthree years. The performance <strong>of</strong> the variety was similar in both locations with higher pod weights andharvest index in 1999 than in other years. In both Forbes and Keith the seed weight per 100 pods wasmuch lower in 2000 than in 1999 indicating poor pollination conditions in 2000. This contributed tothe harvest index being lower in 2000 than in 1999.Table 35. Seed yield components <strong>of</strong> ‘Genesis’Forbes Forbes Forbes Keith Keith KeithYear 1999 2000 2001 1999 2000 2001 LSDTotal seedweightSeed weightper 100 pods0.86a 0.37a 0.47a 0.64a 0.32a 0.48a ns0.65a 0.31c 0.39bc 0.66a 0.43bc 0.50ab 0.18Harvest Index 0.21a 0.10b 0.13b 0.20a 0.11b 0.14b 0.05Stems on two dry land crops <strong>of</strong> ‘Aurora’ at Keith were sampled over three years and results aresummarised in Table 36. This variety performed poorly at one site in 1999 through low seed weight.The weight <strong>of</strong> seed per pod was low indicating poor fertilisation. The harvest index was low in 1999at both sites. Performance at both sites was better in 2001 than in the other years.Table 36 Seed yield components <strong>of</strong> ‘Aurora’Field 1 1 1 2 2 2Year 1999 2000 2001 1999 2000 2001 LSDTotal seed weight 0.11b 0.39ab 0.44ab 0.28ab 0.25ab 0.48a 0.25Weight per 100 pods 0.28b 0.70a 0.70a 0.48b 0.47b 0.80a 0.26Harvest Index 0.05c 0.18ab 0.16ab 0.13b 0.13b 0.21a 0.0728
Performance <strong>of</strong> <strong>Varieties</strong> in Seed ProductionTwo varieties were compared when irrigated by overhead pivots at Keith in 2000 and 2001. Resultsare summarised in Table 37. The varieties differed in seed weight per pod possibly in response todifferent irrigation treatment during flowering. This affected total seed weight.Table 37. Seed yield components <strong>of</strong> two varietiesVariety A B LSDRacemes per main stem 10.7a 11.3a nsNumber <strong>of</strong> pods 31.5a 33.8a nsPods per raceme 3.18 3.20a nsTotal seed weight 0.31b 0.58a 0.27Seed weight per 100 pods 0.62b 0.82a 0.16Harvest Index 0.15a 0.18a nsStems on three varieties grown as dry land seed crops in 1999 at Keith were analysed (Table 38).There was little difference in the yield parameters <strong>of</strong> the three varieties. All achieved good pod setand excellent seed weight per pod indicating good conditions for pollen transfer at flowering time.Table 38. Seed yield components <strong>of</strong> three varieties grown without irrigationVariety 1 2 3 LSDRacemes per main stem 10.1a 7.9a 8.8a nsNumber <strong>of</strong> pods 38.5a 39.3a 25.2a nsPods per raceme 3.78a 5.25a 3.06a nsTotal seed weight 1.02a 0.43a 0.45a nsSeed weight per 100 pods 0.90ab 0.70b 1.00a 0.21Harvest Index 0.18a 0.14a 0.17a nsStems on another three varieties grown as dry land seed crops in 1999 at Keith were sampled andanalysed (Table 39). There was little difference in the yield parameters <strong>of</strong> these varieties. All achievedgood pod set and excellent seed weight per pod indicating favourable conditions at flowering.29
Table 39. Seed yield components three dryland varieties<strong>Varieties</strong> 4 5 6 LSDNumber <strong>of</strong> pods 47.1a 40.0a 51.0a nsPods per raceme 4.35a 4.41a 5.29a nsTotal seed weight 0.81a 0.41a 0.68a nsSeed weight per 100 pods 0.77ab 0.65b 0.99a 0.27Harvest Index 0.20a 0.20a 0.20a nsStems on crops <strong>of</strong> another two varieties, ‘Genesis’ and ‘Aurora’, grown in 1999 at Keith wereanalysed and results are summarised in Table 40. As with the varieties above, there was littledifference in the yield parameters <strong>of</strong> these varieties grown under dry land conditions. Both achievedgood pod set.Table 40. Seed yield components <strong>of</strong> dryland ‘Genesis’ and ‘Aurora’<strong>Varieties</strong> Genesis Aurora LSDNumber <strong>of</strong> pods 40.7a 39.2a nsPods per raceme 4.10a 4.90a nsTotal seed weight 0.69a 0.56a nsSeed weight per 100 pods 0.78a 0.56a nsHarvest Index 0.15a 0.15a nsAlthough soils and management may vary from field to field some sources <strong>of</strong> variation are removed ifvarieties are compared for three years on one property. ‘Aurora’ and ‘Genesis’ were compared atForbes, Table 41. The only appreciable difference in yield parameters was in seed weight. Seedweight per stem advantage <strong>of</strong> ‘Genesis’ appears to be due to superior seed production on branches andincreased dry matter production because the harvest index was identical in the two varieties.Table 41. Seed yield components <strong>of</strong> irrigated ‘Genesis’ and ‘Aurora’<strong>Varieties</strong> Genesis Aurora LSDRacemes per main stem 12.0 10.6 nsNumber <strong>of</strong> pods 52.2 55.2 nsPods per raceme 4.6 5.5 nsTotal seed weight 0.57a 0.36b 0.19Seed weight per 100 pods 0.45 0.43 nsHarvest Index 0.15 0.15 ns30
‘Aquarius’ and ‘Salado’ were grown on one property at Keith for three years, Table 42. There wereno differences except in racemes per stem which indicates that ‘Salado’ flowered for a longer period.Table 42. Seed yield components <strong>of</strong> irrigated ‘Aquarius’ and ‘Salado’<strong>Varieties</strong> Aquarius Salado LSDRacemes per main stem 10.5b 13.4a 1.8Number <strong>of</strong> pods 38.1 44.7 nsPods per raceme 3.75 3.80 nsTotal seed weight 0.33 0.42 nsSeed weight per 100 pods 0.48 0.53 nsHarvest Index 0.13 0.13 nsWhen ‘Aquarius’ was compared with ‘Siriver’ on one farm at Keith the data shown in table 43 wererecorded. Over three years ‘Siriver’ was more productive than ’Aquarius’ in all <strong>of</strong> the yieldcomponents except number <strong>of</strong> racemes on the main stem. The number <strong>of</strong> pods set on the main stemand the weight <strong>of</strong> seed per pod, indications <strong>of</strong> higher levels <strong>of</strong> tripping, and better pollination andfertilisation were higher in ‘Siriver’ and these factors contributed to a superior harvest index.Table 43. Seed yield components <strong>of</strong> irrigated ‘Aquarius’ and ‘Siriver’<strong>Varieties</strong> Siriver Aquarius LSDRacemes per main stem 9.3 10.5 nsNumber <strong>of</strong> pods 65.1a 38.1b 20.3Pods per raceme 6.8a 3.8b 1.2Total seed weight 0.75a 0.33b 0.25Seed weight per 100 pods 0.66a 0.48b 0.11Harvest Index 0.17a 0.13b 0.0331
Pollination and FertilisationBees Distance from HivesExperiments were conducted in three varieties to determine if distance from hives affected seed yield.Samples were taken in three irrigated crops at Keith. In ‘Aquarius’ (Table 44) samples were taken 10metres and 420 m from hives. There was no significant difference between locations in the characters:pod number, seed number, number <strong>of</strong> seeds /pod, total seed weight, weight <strong>of</strong> seeds per 100 pods andharvest index. Similarly, in ‘Hunter River’ and ‘Trifecta’ there were no significant differencesbetween sites (Tables 45 and 46). When the data from the three varieties were polled (Table 47) therewas no difference in yield parameters between plants close to or remote from hives.Table 44. Effect <strong>of</strong> distance from hive on yield components <strong>of</strong> ‘Aquarius’Stem characters 420 metres from hive 10 metres from hive LSDPod number 87.4 112.0 nsSeed number 161.5 175.7 nsNumber seeds /pod 1.94 1.74 nsTotal seed weight 0.39 0.42 nsWt seed per 100 pods 0.47 0.42 nsHarvest Index 0.11 0.13 nsTable 45. Effect <strong>of</strong> distance from hive on yield components <strong>of</strong> ‘Hunter River’Stem characters 700 metres from hive 50 metres from hive LSDPod number 100.1 107.9 nsSeed number 307.1 264.4 nsNumber seeds /pod 2.93 2.50 nsTotal seed weight 0.74 0.64 nsWt seed per 100 pods 0.73 0.60 nsHarvest Index 0.24 0.20 nsTable 46. Effect <strong>of</strong> distance from hive on yield components <strong>of</strong> ‘Trifecta’Stem characters 500 metres from hive 20 metres from hive LSDPod number 112.1 88.4 nsSeed number 226.5 246.8 nsNumber seeds /pod 2.18 2.99 nsTotal seed weight 0.55 0.59 nsWt seed per 100 pods 0.52 0.72 nsHarvest Index 0.16 0.19 ns32
Table 47. Effect <strong>of</strong> distance from hive on seed yield componentsVariety Trifecta HunterRiverStemcharactersPodnumberSeednumberNumberseeds /podTotal seedweightWt seed /100 podsHarvestIndexRemotefromhiveCloseto hiveRemotefromhiveCloseto hiveAquarius MeanRemotefromhiveCloseto hiveRemotefromhiveCloseto hive112.1 88.4 100.1 107.9 87.4 112.0 99.9 102.8 ns226.5 246.8 307.1 264.4 161.5a 175.7 231.7 229.0 ns2.18a 2.99 2.93 2.50 1.94 1.74 2.35 2.41 ns0.55 0.59 0.74 0.64 0.39 0.42a 0.56 0.55 ns0.52 0.72 0.73 0.60 0.47 0.42a 0.58 0.58 ns0.16 0.19 0.24 0.20 0.11 0.13 0.17 0.17 nsLSDBees, tripping, and pod setDuring the summer <strong>of</strong> 1999-2000 there was very little evidence in either Keith or Forbes <strong>of</strong> beestripping flowers. When present in the field they were collecting nectar, not tripping flowers.In December 1999 in both sites crops were setting pods well but there were no bees tripping flowers.Observations made on a windy morning in January, when the temperature about 20 0 C indicated littleevidence <strong>of</strong> bee activity or tripping and no automatic tripping was observed.On another property, detailed observations were made on activity <strong>of</strong> bees over a one day period inJanuary when crops were in full flower. In the morning the temperature had reached 40 0 C and beeswere not evident in the crops. During the afternoon, from 1 until 5 pm, the temperature averaged 34 0 Cand there was a wind <strong>of</strong> approximately 40 km/hr. Some bees were swarming, others remainedclustered at the entrances <strong>of</strong> hives.During this period there were no bees observed in any the 14 crops monitored. Nevertheless whenflowers were observed closely, an average <strong>of</strong> 3% <strong>of</strong> open flowers had recently been tripped. One cropin which 12% <strong>of</strong> flowers had recently tripped had been watered three days previously, but five otherfields which had also been recently irrigated showed no more evidence <strong>of</strong> tripping than fields awaitingwater.At the end <strong>of</strong> January bees were seen to trip 6% <strong>of</strong> flowers in one field., Other flowers were visitedfor nectar but flowers were not tripped. Despite the low frequency <strong>of</strong> tripping in lucerne, largenumbers <strong>of</strong> bees were actively collecting pollen from skeleton weed and couch grass in the field. On athird property no bees were seen to trip flowers or collect pollen during observations in the summer <strong>of</strong>1999-2000.During observations for pod setting early in February 2000, plants setting large numbers <strong>of</strong> pods andplants setting few pods were examined to observe the amount <strong>of</strong> recent tripping on racemes stillflowering. No bees tripped flowers during these observations. The data in Table 48 show that plantswith a heavy pod set were the ones on which freshly tripped flowers were observed despite anyevidence <strong>of</strong> bees tripping flowers. These data suggest that in each <strong>of</strong> these varieties there are plantswhich trip automatically under favourable conditions and also plants which do not trip automatically.33
Table 48. Relationship between automatic tripping flowers and seed setVariety Seed setting ability Number with manytripped flowersHunter River Good 6 0Poor 1 6Siriver Good 5 0Poor 0 5Sirosal Good 6 0Poor 0 5Salado Good 5 0Poor 0 5Total good 22 0poor 1 21Number with notripped flowersIn March 2000 another study investigated the distribution <strong>of</strong> tripped flowers among good seed settingand poor seed setting plants in ‘Siriver’ at Keith. Notes were taken on a day when there were few beesin the field. The temperature was 23 0 C. The data from 50 plants are shown in table 49.Substantially more flowers were tripped on high seed setting plants than on low seed setters. In theabsence <strong>of</strong> bees the tripping observed must have been largely automatic. The difference between thetwo groups suggests that high seed setters are those that are capable <strong>of</strong> a high level <strong>of</strong> automatictripping. However on a few <strong>of</strong> the poor seed setting plants there were many tripped flowers. It issuggested that although these exhibit a high level <strong>of</strong> automatic tripping there are other restraints, suchas female sterility which inhibited seed setting. Since plants are largely cross pollinated poor seed setshould not be caused by poor pollen quality or male sterility.In one field on one property at Keith approximately 25% <strong>of</strong> bees were observed to be tripping flowersand collecting pollen during peak flowering in January 2001. As there was a total <strong>of</strong> 2 to 3 beesworking per square metre, approximately 1 per m 2 was tripping flowers at the rate <strong>of</strong> 8 flowers perminute. Despite this activity, at harvest time there was considerable variation among plants in pods setper stem and per raceme. Whether poor pod set was due to flowers being unattractive to bees, difficultfor bees to trip, or female sterile or other cause was not determined. No bees were observed trippingflowers or collecting pollen in February 2001. On another property, 30% <strong>of</strong> bees were trippingflowers and collecting pollen from lucerne in January 2001 but not in December or February. On athird property at Keith, bees were collecting nectar and not tripping flowers.In some varieties greater activity <strong>of</strong> bees collecting pollen in 2001 than in 2000 may have beenreflected in an increase in number <strong>of</strong> pods per raceme (eg Genesis in Table 6, Hunter River , Table 8in which number <strong>of</strong> pods, pod number per raceme and total seed weight were higher in 2001 than inthe previous years and Salado (table 9) in which number <strong>of</strong> pods per raceme and seed weight per 100pods changed. In other varieties such as Siriver, Pioneer L69 and Trifecta (tables 10, 14 and 16) therewas no significant difference in yield components between 2000 and 2001. It is possible that thesevarieties contain more plants capable <strong>of</strong> automatic tripping than other varieties and thus rely less onpollinating insects for tripping and seed set.At Forbes, activity <strong>of</strong> bees was observed in January 2000. In several fields there were 2 bees per m 2but they were not collecting pollen or tripping flowers. When collecting nectar bees visited 19 flowersper minute. In February there was no evidence <strong>of</strong> bees tripping flowers but on one afternoon when thetemperature was 27 0 C considerable automatic tripping was observed especially in old flowers about 4days since opening. In January 2001, when bees were only collecting nectar from lucerne,considerable automatic tripping was evident when the temperature was 23 0 C at 10 am. Automatictripping was observed on some plants which set very few pods. This suggests that in this case lack <strong>of</strong>tripping was not the reason for poor seed set. Female sterility may have contributed to low pod set.34
Table 49. Flower number and number tripped, high and low seed-setting plantsGood seed setting plantsPoor seed setting plantsFlowers/raceme Number tripped Flowers/raceme Number tripped2 2 2 14 4 5 03 2 4 03 0 2 14 2 1 16 4 4 14 4 5 14 4 5 23 2 3 23 2 7 12 2 10 65 1 5 15 4 3 03 0 9 67 4 10 04 1 5 03 2 4 13 2 4 03 1 4 16 2 2 06 2 6 14 3 3 05 0 3 04 1 3 32 3 4 4Means3.9 2.2 (55% tripped) 4.5 1.3 (29% tripped)In another area bees tripped only 1% <strong>of</strong> flowers visited in one field, and none in others while theycollected nectar in January 2000. Although bees were not observed to trip flowers generally in earlyMarch 2000 they did visit recently tripped flowers and may have effected cross pollination in theprocess. On a bright sunny day and at 30 0 C in early March, there was extensive automatic trippingobserved while bees only collected nectar. Only in one field were 50% <strong>of</strong> bees tripping flowers andcollecting pollen. Although this may have led to considerable cross pollination, this crop washarvested before the seed arising from bee pollination matured.Observations <strong>of</strong> dense crops at full flower reveal the huge potential for seed set. Each stem may have5 flowering racemes, which in a crop <strong>of</strong> 200 stems m 2 is 1,000 racemes. Each may have 10 flowersopen, providing 10,000 flowers m 2 at one time. As flowering continues, additional flowers per raceme35
and racemes per stem develop providing some 100,000 flowers per m 2 over a few weeks. In a varietycapable <strong>of</strong> setting 100 pods per stem and 1 g seed per 100 pods, and a stand <strong>of</strong> 200 stems per m 2 wouldrequire only 20,000 flowers to produce 20,000 pods and a yield <strong>of</strong> 2 t/ha seed crop.Apart from the flexibility to produce a crop provided by such large numbers <strong>of</strong> flowers it is importantto take account <strong>of</strong> the density <strong>of</strong> flowers at full flower. Racemes are distributed throughout the canopyat a density <strong>of</strong> one flower per cm 2 . This provides the opportunity for pollen to be readily dispersedthroughout the crop with automatic tripping. Alternatively, if bees trip flowers, 2 bees per m 2 eachtripping 10 flowers per minute could trip 10,000 flowers per day. Thus a high seed yielding varietycould be pollinated to produce a 1 t/ha crop in one day.In the 1999-2000 lucerne seed production season very little flower tripping and cross pollination wasobserved to be effected by bees. This suggested that considerable amounts <strong>of</strong> self pollination mightoccur. To gain information concerning the levels <strong>of</strong> self and cross pollination under seed productionconditions, white flowered plants (white flower colour being recessive to blue) were identified infields during the season. Plants were allowed to open pollinate and seed was harvested when mature.Seed was sown in nurseries to allow observation <strong>of</strong> the flower colour <strong>of</strong> the progenies. The data fromthe progeny tests are shown in table 50.It is clear from this table that there was very little self pollination in lucerne, only 5% on average, inthe 1999-2000 season. Observations reveal that because bees were not tripping flowers crosspollination was not mediated by bees. This suggests that automatic tripping was <strong>of</strong> considerableimportance during this season and that cross pollination was achieved by pollen moving within thecrop canopy by means other than insect vectors.36
Table 50. Flower colour in progenies <strong>of</strong> white-flowered plantsPlant numberNumber <strong>of</strong> blueflowersNumber <strong>of</strong> whiteflowers1 13 2 132 22 2 83 32 0 04 46 5 105 38 1 36 27 6 187 46 6 128 59 2 39 13 0 010 26 1 411 24 0 012 52 2 413 49 2 414 15 0 015 54 1 216 77 11 1217 22 3 1218 23 0 019 33 0 020 36 1 321 14 0 022 9 0 023 38 0 024 41 0 025 63 4 626 60 1 2Percentage selfpollinationMean 35.8 1.9 5.137
Variation Within <strong>Varieties</strong>Apart from the variation observed among varieties, seasons, management, and other factors, it isimportant to note effects among plants within varieties. Although several plant characters weremeasured in the studies, two particularly important components <strong>of</strong> crop yield are: plant population(stand) or stems per hectare, and seed yield per stem. Seed yield per stem is the product <strong>of</strong> number <strong>of</strong>pods per stem and weight <strong>of</strong> seed per pod. These relationships are illustrated using a small sample <strong>of</strong>data collected in 1999. Figure 5 demonstrates that seed weight per stem is closely related to number<strong>of</strong> pods, and Figure 6 that seed weight per stem is determined by seed weight per 100 pods.However varieties are a population <strong>of</strong> individual plants which may exhibit considerable variation inopen pollinated species like lucerne. As an example, variation among 20 ‘Siriver’ plants in seed yieldper stem is illustrated in Figure 7. In all varieties examined typically 25% <strong>of</strong> plants produce 50% <strong>of</strong>seed yield. <strong>An</strong> indication <strong>of</strong> the variation in yield components in a range <strong>of</strong> varieties grown underirrigation in Forbes and Keith during the three years <strong>of</strong> this study is shown in table 51.Table 51 Variation within varieties, mean and standard deviationVarietyLocation,YearPods/mainstemPods perracemeTotal seedweightWt seed/100podsHarvestIndexGenesis Forbes1999 43 (32) 3.5 (1.8) 0.36 (0.35) 0.73 (0.28) 0.20 (0.11)Genesis Forbes 2000 27 (30) 2.6 (2.9) 0.12 (0.16) 0.16 (0.15) 0.04 (0.04)Genesis Forbes 2001 75 (37) 6.4 (3.1) 0.69 (0.46) 0.61 (0.26) 0.21 (0.08)Genesis Keith 1999 60 (22) 5.5 (1.1) 0.64 (0.39) 0.66 (0.28) 0.20 (0.04)Genesis Keith 2000 35 (29) 2.3 (3.7) 0.32 (0.32) 0.43 (0.22) 0.11 (0.09)Genesis Keith 2001 62 (35) 4.7 (1.9) 0.48 (0.33) 0.50 (0.18) 0.14 (0.04)Aurora Forbes 1999 47 (22) 5.4 (2.2) 0.34 (0.26) 0.51 (0.25) 0.16 (0.08)Aurora Forbes 2000 61 (29) 5.1 (3.3) 0.34 (0.12 0.34 (0.07) 0.14 (0.05)Aurora Forbes2001 58 (33) 5.9 (2.4) 0.40 (0.27) 0.43 (0.20) 0.16 (0.05)Aurora Keith 1999 37 (28) 5.0 (4.0) 0.59 (0.47) 0.71 (0.20) 0.17 (0.12)Aurora Keith 2000 29 (20) 2.5 (1.9) 0.26 (0.25) 0.48 (0.27) 0.14 (0.08)Aurora Keith 2001 42 (22) 4.4 (1.8) 0.33 (0.21) 0.49 (0.25) 0.13 (0.08)Trifecta Keith 1999 55 (20) 5.3 (2.1) 0.89 (0.56) 0.87 (0.27) 0.26 (0.10)Trifecta Keith 2000 43 (280 3.5 (2.1) 0.77 (0.64) 0.67 (0.39) 0.22 (0.15)Trifecta Keith 2001 57 (26) 4.4 (1.8) 0.99 (0.84) 0.79 (0.30) 0.21 (0.08)Siriver Keith 1999 58 (29) 6.2 (1.9) 1.05 (0.92) 0.71 (0.19) 0.19 (0.03)Siriver Keith 2000 79 (49) 7.7 (3.9) 0.61 (0.54) 0.56 (0.23) 0.15 (0.07)Siriver Keith 2001 58 (37) 6.5 (2.0) 0.58 (0.30) 0.71 (0.29) 0.17 (0.04)Aquarius Keith 1999 42 (24) 5.3 (2.3) 0.45 (0.31) 0.65 (0.17) 0.16 (0.07)Aquarius Keith 2000 52 (27) 4.3 (2.4) 0.51 (0.30) 0.60 (0.24) 0.19 (0.05)Aquarius Keith 2001 20 (16) 1.6 (1.1) 0.05 (0.06) 0.18 (0.10) 0.03 (0.03)HunterRiver Keith 1999 25 (12) 2.9 (1.3) 0.29 (0.24) 0.61 (0.12) 0.18 (0.07)HunterRiver Keith 2000 34 (19) 2.8 (1.5) 0.47 (0.56) 0.68 (0.24) 0.15 (0.10)HunterRiver Keith 2001 74 (24) 7.6 (3.1) 0.92 (0.40) 0.76 (0.17) 0.22 (0.02)38
Figure 5 Relationship between seed weight and pod numberRelationship: pod number/seed0.50.450.40.35Seed weight g0.30.250.20.150.10.0500 20 40 60 80 100Pod number39
Relationship: pod/seed1.210.8Seed weight per stem (g)0.60.40.200 0.2 0.4 0.6 0.8 1 1.2Seed Weight per 100 podsFigure 6 Relationship between seed weight and pod weight40
Seed yield variation in 'Siriver'3.532.521.510.501357Seed yield per stem91113151719PlantsFigure 7 Seed Yield variation in Siriver41
Selection Within <strong>Varieties</strong>When considerable variation was observed among plants in lucerne seed production fields, anexperiment was conducted to determine whether the variation was due to environmental effects or togenetic differences between plants. As crops were ripening, seed was collected from plants with alarge number <strong>of</strong> well filled pods and from plants with very few pods in several varieties. Progenies <strong>of</strong>both high and low seed setting plants were evaluated in an irrigated nursery during the 1999-2000growing season at Bordertown, SA to monitor the inheritance <strong>of</strong> characters related to seed production.Observations were made during the season and random samples collected from plants as the seedcrops matured. Plants <strong>of</strong> high and low seed-setting plants were dissected to provide the data in thefollowing tables.Table 52 Progenies <strong>of</strong> selections in ‘Aquarius’Plant type High seed setters Low seed setters LSDRacemes on main stem 10.5a 14.6a nsPods on main stem 44.5a 13.2b 19.1Pods per raceme 4.37a 1.20b 1.84Weight <strong>of</strong> seed on stem 0.17a 0.06a nsTotal weight <strong>of</strong> seed 0.44a 0.31a nsWeight <strong>of</strong> seed per 100 pods 0.36a 0.20a nsSeeds per pod 1.55a 0.80a nsTotal number <strong>of</strong> seeds 74a 23a nsHarvest Index 0.15a 0.05b 0.07Table 53 Progenies <strong>of</strong> selections in ‘Genesis’Plant type High seed setters Low seed setters LSDRacemes on main stem 13.3a 11.8a nsPods on main stem 40.7a 20.7b 10.8Pods per raceme 3.14a 1.92b 1.13Weight <strong>of</strong> seed on stem 0.21a 0.08b 0.08Total weight <strong>of</strong> seed 0.91a 0.33b 0.58Weight <strong>of</strong> seed per 100 pods 0.50a 0.35a nsNumber <strong>of</strong> seeds per pod 2.09a 1.36a nsTotal number <strong>of</strong> seeds 86a 32b 34Harvest Index 0.15a 0.07b 0.0642
Table 54 Progenies <strong>of</strong> selections in ‘Hunter River’Plant type High seed setters Low seed setters LSDRacemes on main stem 8.7b 12.0a 2.3Pods on main stem 50.0a 20.6b 15.5Pods per raceme 5.73a 1.74b 1.53Weight <strong>of</strong> seed onprimary stemTotal weight <strong>of</strong> seed onstem and branchesWeight <strong>of</strong> seed per 100podsNumber <strong>of</strong> seeds perpod0.26a 0.10b 0.101.03a 0.74a ns0.51a 0.47a ns2.11a 2.18a nsTotal number <strong>of</strong> seeds 108a 44b 39Harvest Index 0.22a 0.15b 0.06Table 55 Progenies <strong>of</strong> selections in ‘Siriver’Plant type High seed setters Low seed setters LSDRacemes on main stem 11.6a 12.6a nsPods on main stem 47.8a 34.2a nsPods per raceme 4.01a 2.76a nsWeight <strong>of</strong> seed onprimary stemTotal weight <strong>of</strong> seed onstem and branchesWeight <strong>of</strong> seed per 100podsNumber <strong>of</strong> seeds perpod0.27a 0.20a ns1.06a 0.82a ns0.55a 0.55a ns2.13a 2.34a nsTotal number <strong>of</strong> seeds 109a 84a nsHarvest Index 0.19a 0.14a ns43
Table 56 Progenies <strong>of</strong> selections in ‘Trifecta’Plant type High seed setters Low seed setters LSDRacemes on main stem 10.9b 14.7a 3.8Pods on main stem 40.1a 27.9a nsPods per raceme 3.64a 1.88b 1.46Weight <strong>of</strong> seed onprimary stem0.25a 0.14a nsTotal weight <strong>of</strong> seed 0.78a 0.48a nsWeight <strong>of</strong> seed per 100podsNumber <strong>of</strong> seeds perpod0.61a 0.39a ns2.70a 1.43b 1.23Total number <strong>of</strong> seeds 108a 58a nsHarvest Index 0.17a 0.09a nsTable 57 Summary <strong>An</strong>alysisPlant type High seed setters Low seed setters LSDRacemes on main stem 11.1b 13.6a 1.5Pods on main stem 45.4a 25.1b 6.4Pods per raceme 4.31a 1.94b 0.59Weight <strong>of</strong> seed onprimary stemTotal weight <strong>of</strong> seed onstem and branchesWeight <strong>of</strong> seed per 100podsNumber <strong>of</strong> seeds perpod0.24a 0.12b 0.050.85a 0.70a 0.230.51a 0.38b 0.092.14a 1.61b 0.35Total number <strong>of</strong> seeds 97.5a 50.6b 19.2Harvest Index 0.18a 0.10b 0.03The mean value for various characters in the high seed setting progeny for each <strong>of</strong> the five varieties isshown in table 58.44
Table 58. Mean values and (standard deviation) for characters measured in fivevarieties subjected to one cycle <strong>of</strong> mass selection.Character Aquarius Genesis HunterRiverRacemes onmain stemPods on mainstemPods perracemeWeight <strong>of</strong> seedon main stemTotal weight <strong>of</strong>seedWeight <strong>of</strong> seedper 100 podsNumber <strong>of</strong>seeds per pod10.5(1.7)44.5(22.0)4.4(2.3)0.17(0.16)0.44(0.21)0.36(0.19)1.5(0.7)Harvest Index 0.15(0.08)13.3(1.9)40.7(9.3)3.1(0.9)0.21(0.10)0.91(0.75)0.50(0.22)2.1(0.9)0.15(0.06)8.7(1.6)50.0(21.2)5.7(2.2)0.26(0.13)1.03(0.78)0.51(0.19)2.1(0.8)0.22(0.07)Siriver Trifecta mean11.6(3.7)47.8(25.0)4.0(1.9)0.27(0.16)1.06(1.22)0.55(0.19)2.1(0.9)0.19(0.08)10.9(2.9)40.1(22.0)3.6(1.6)0.25(0.20)0.78(0.58)0.61(0.37)2.7(1.4)0.17(0.08)11.0(2.4)44.6(19.9)4.2(1.8)0.23(0.15)0.84(0.71)0.51(0.23)2.1(0.9)0.18The genetic gain through selection was calculated as the difference in the value <strong>of</strong> a character in thehigh seed setting progeny from the mean <strong>of</strong> the high and low populations. The genetic gain from onecycle <strong>of</strong> mass selection in each <strong>of</strong> five varieties is shown in table 59.Table 59. Genetic gain (%) in five varieties subjected to one cycle <strong>of</strong> mass selection.Character Aquarius Genesis HunterRiverRacemes on mainstemPods on mainstemSiriver Trifecta mean-16 6 -16 -4 -15 -955 33 42 17 18 33Pods per raceme 57 24 54 19 32 37Weight <strong>of</strong> seed onmain stemTotal weight <strong>of</strong>seedWeight <strong>of</strong> seed per100 podsNumber <strong>of</strong> seedsper pod49 44 46 15 29 3716 48 16 13 23 2329 17 4 0 22 1431 21 0 0 31 17Harvest Index 49 37 19 13 28 2945
DiscussionDuring this project,! <strong>Lucerne</strong> varieties were found to differ in seed yield and in reliability <strong>of</strong> production and it wasconcluded that there is a need for trials in which varieties are compared to allow the mostproductive ones to be identified.! When the expectation that bees trip flowers and contribute to seed production was examined,it was found that although bees are present in crops they collect nectar rather than pollen.However as many plants trip automatically it is likely that varieties, which do not need beesfor pollination, can be developed.! Additional variation in lucerne varieties was explored and it was found that selection for seedyield can be readily achieved, suggesting that more productive varieties can be developed.! Currently seed crops are irrigated in summer but as water is used inefficiently under hotconditions the potential to produce comparable crops in the cooler conditions <strong>of</strong> spring shouldbe examined.The findings are discussed in more detail below.Effect <strong>of</strong> Seasonal ConditionsIn each <strong>of</strong> the fields monitored over three years, the numbers <strong>of</strong> plants remained reasonably constantand variation in performance over time was due to environmental effects modifying seed productionon a constant number <strong>of</strong> stems. This made it possible to observe how different seasonal conditionsaffected the performance <strong>of</strong> the varieties grown. However, to some extent, demonstration <strong>of</strong>differences due to season was masked by the considerable variation among plants within varieties.Variation in numbers <strong>of</strong> plants within and between fields made it difficult to estimate yield potentialand to compare yields <strong>of</strong> crops in different fields in any year. Differences due to stand wereconfounded with differences due to variety or management. Consequently for comparisons betweenfields, it was necessary to consider differences between individual stems, and ignore numbers <strong>of</strong>stems. Therefore in these studies the individual stem was the unit studied and analysed. Numbers <strong>of</strong>racemes, numbers <strong>of</strong> pods, weight <strong>of</strong> seed per pod, total seed weight and harvest index were used toindicate differences between lucerne plants in different fields, varieties and years.Considerable variation in seed yield between fields and years was observed. Some stems produced arelatively small number <strong>of</strong> racemes <strong>of</strong> flowers and flowering stopped. This was particularly noticeableat Keith in 1999. The most likely interpretation is that conditions favoured pod set in 1999, and with aheavy pod set the plant devoted resources to pod fill instead <strong>of</strong> additional stem growth and flowerproduction. It is also possible that on some occasions hot and dry conditions may have adverselyaffected further stem and flower production (Engelbert, 1932).A different pattern was observed in 2000 when the number <strong>of</strong> pods set per raceme tended to be lowerin some varieties, the plant producing additional racemes to compensate. The production <strong>of</strong> additionalstem to support continued flowering reduced the harvest index. On other varieties there was a highinitial pod set and flowering stopped. It appears that these varieties were adequately pollinated underconditions that did not favour pollination in other varieties. It is possible that the flower structure(Larkin and Graumann, 1954) is such that automatic tripping is more readily achieved in varietieswhich reliably set pods irrespective <strong>of</strong> conditions.Over the three years <strong>of</strong> observations some varieties exhibited a consistent performance in pod set, totalseed weight, pod weight and harvest index, and other varieties varied considerably in performancefrom year to year. Some <strong>of</strong> the differences may be attributed to management decisions but some arelikely be due to specific varietal features contributing to seed production under certain circumstances.46
For example, in dry land crops monitored at Keith, performance <strong>of</strong> ‘Siriver’ (Table 24) and ‘HunterRiver’ (Table 25) was relatively stable over three years for total seed weight, seed weight per pod andharvest index, while less stability was exhibited by ‘Genesis’ (Table 27). Data indicate thatperformance <strong>of</strong> some varieties is more stable than others under both irrigated and dry land conditions.At Forbes also, there were differences between varieties in yield parameters over the years <strong>of</strong> thisstudy. ‘Aurora’ data for example are shown in Tables 5 and 19. In one site the number <strong>of</strong> pods,number <strong>of</strong> pods per raceme, total seed weight, seed weight per pod and harvest index were relativelyconstant and low. At the other location, the parameters were stable at a higher yield level.In contrast, ‘Genesis’ performed well at three sites in 1999 but in 2000 the seed weight per pod wasvery low. However the number <strong>of</strong> pods set, including the number <strong>of</strong> pods per raceme, was high at twosites and low at a third. In all cases the harvest index was low in 2000. The results indicate thatflowers were tripped but there was a deficiency <strong>of</strong> fertile pollen to ensure fertilisation <strong>of</strong> availableovules. Variation in the performance <strong>of</strong> ‘Genesis’ at both Keith and Forbes suggests that the fertility<strong>of</strong> this variety is variable. Sexsmith and Fryer, (1943) noted that plants differed in pollen viability.The variable performance <strong>of</strong> some varieties in different seasons provides difficulties in predictinglucerne seed yield. Others showed a degree <strong>of</strong> stability between districts and seasons. The varietieswith a broad adaptation to conditions are more desirable than the variable ones if yield stability isrequired. There was also variation within years indicating that performance is affected by localfactors such as soil, management and irrigation timing.Effect <strong>of</strong> ManagementIn dry land crops at Keith, stand was low with a total <strong>of</strong> 100 or less stems per m 2 carried on as few assix plants per m 2 . The low number <strong>of</strong> plants in non-irrigated fields is due to plant loss during extendeddry periods in summer. If high seed yields are to be achieved under dry land conditions it is likely tobe in the sowing year or possibly the second year after sowing before stand is depleted. On heavierand deeper soils with a greater ability to retain soil moisture, and in regions with summer rainfall,higher plant and stems populations may be retained. Under these conditions there is a higher dry landyield potential.Number <strong>of</strong> plants varied considerably in irrigated crops but was commonly in the range <strong>of</strong> 150 to 200stems per m 2 . There was a tendency for crops to compensate for poor stand by producing more stemsfrom the crown to maintain a fairly constant number <strong>of</strong> stems per m 2 (Figure 2). Lower populationscan be expected to have low yield and the highest yield observed, 1400 kg per ha, was obtained on acrop with a high stand, - 320 plants per m 2 . Not only is a high plant population important to achieve ahigh yield because <strong>of</strong> the potential contribution <strong>of</strong> numbers <strong>of</strong> pods per stem and seeds per pod, adense stand is less prone to blow in the wind. In several fields with relatively low numbers <strong>of</strong> stems,plants were observed to be buffeted in the wind and this caused considerable loss <strong>of</strong> pods. Excellentseed yield was <strong>of</strong>ten observed on prostrate plants, partly because the seed crop was not reducedthrough wind causing pods to drop. On the other hand, some dense fields held a primary seed cropand regrowth flowered to provide a double crop. Such mixtures are prone to lodge, providingdifficulties at harvest time. Seed crops in Australia are drilled in narrow rows giving a completesward, not in the widely spaced rows recommended for high yield in California (Peterson, 1972).A large number <strong>of</strong> factors have to be taken into account when crop management is considered. Whentwo dry land fields <strong>of</strong> ‘Aurora’ grown at Keith are considered, (Table 28), total seed weight was low in1999, and seed weight per pod was low in both sites. It appears that pollination and fertilisation werepoor and that at one site there was compensation through higher pod set. In 2000, seed weight per podwas high in Field 1 and low in Field 2 again reflecting a low level <strong>of</strong> ovule fertilisation in field 2.47
Performance was comparable and good in both fields in 2001. Management or location conditionshave different effects in different years.Further comparisons were made in irrigated crops <strong>of</strong> ‘Aurora’ at Keith in 1999 and 2001 (Table 32).In this case there was no significant difference between sites or years except that in one location in1999 there were fewer racemes produced. However these racemes carried the greatest number <strong>of</strong> podsindicating that conditions favoured tripping on this occasion. This supports the observation earlier thatwhen a good pod set is obtained the plant supports pod development rather than production <strong>of</strong> moreflowers.When irrigation treatments were applied to ‘Siriver’ in 1999 (Table 29) there was no significantdifference in yield components with one or several irrigations at one site. At the other site the totalseed weight was reduced by providing only one irrigation, and seed weight per pod and harvest indexwere reduced. It is likely that the precise timing <strong>of</strong> the one irrigation was a key difference between thetreatments. However, the fact that a crop supplied with only one application <strong>of</strong> water performed aswell, on a single stem basis, as a fully irrigated crop, warrants further testing.When three water regimes were imposed: dry land, one-irrigation and full-irrigation on a crop <strong>of</strong>‘Hunter River’ in 1999 (Table 30), the only significant difference among yield components was fewerpods per raceme in the dry land crop. The fact that the dry land crop was earlier flowering than theirrigated crops, and the total seed weight, and the seed weight per pod were not reduced under thecooler late spring conditions is important. There is cause to explore possibilities <strong>of</strong> irrigated springlucerne seed crops which would be largely grown on stored soil moisture from winter rains and likelyto use less water because <strong>of</strong> lower evaporative conditions in spring.<strong>An</strong> irrigated and a dry land crop <strong>of</strong> ‘Aurora’ were compared at Forbes (Table 31). There were nosignificant differences between the crops in any yield components measured. Comparisons were madeon a ‘per stem’ basis but as dry land crops normally have fewer stems per hectare than irrigated cropsdo, the yield per hectare would be lower in a dry land crop.Comparisons were made between different types <strong>of</strong> irrigation - overhead pivot spray, and border checkflood irrigation on two varieties. In one case (Table 34) there was no difference except for fewerracemes produced with overhead sprays. In the other case (Table 33) two fields <strong>of</strong> ‘Siriver’ werecompared. There was a lower pod weight and harvest index with overhead sprays. There is thepossibility that overhead irrigation washed pollen from flowers, (Hadfield and Calder, 1936), reducingthe amount available to fertilise flowers. In some respects overhead sprays applied at flowering timecan have a similar effect as rain, which is disadvantageous at flowering (Spafford, 1938).The performance <strong>of</strong> ‘Genesis’ at Forbes and Keith was compared in Table 35. The total seed weightdid not vary between locations but the seed weight per pod was lower at Forbes in both 2000 and2001. This is an indicator <strong>of</strong> lower fertilisation <strong>of</strong> ovules possibly through inadequate amounts <strong>of</strong>pollen available. This is likely to be the case after rain at flowering time. However there was nodifference between locations in harvest index, it being lower in 2000 and 2001 than in 1999 in bothsites. It is probable that limited fertilisation and lower seed weight per pod led to surplus assimilatesbeing available for vegetative growth and this reduced the harvest index in 2000 and 2001.Effect <strong>of</strong> VarietyComparison <strong>of</strong> two varieties for two years with overhead irrigation (Table 37) indicated differences inseed weight per pod which affected total seed weight in one variety. It is possible that this is not avarietal effect but rather due to spray irrigation removing pollen lodged on the flowers and thusreducing the pollen pool, (Hadfield and Calder, 1936), and chances <strong>of</strong> fertilisation <strong>of</strong> some ovules48
when flowers tripped. This appears to be a similar effect to that observed in the case <strong>of</strong> ‘Siriver’(Table 33) discussed above. It suggests that definitive studies should be conducted to investigatepossible pollination/fertilisation problems due to overhead irrigation. In the mean time it would beprudent to minimise use <strong>of</strong> overhead irrigation at flowering time in lucerne seed crops.When performances <strong>of</strong> three varieties were compared under dry land conditions at Keith in 1999 nosignificant differences were observed except for a slight difference in seed weight per pod. Variationwithin varieties was so high that no differences were detected in total seed weight (Table 38). Asimilar slight difference in seed weight per pod was noted when a further three varieties werecompared at Keith (Table 39). In another two varieties (Table 40) under similar conditions nodifferences were detected. It was difficult to detect differences between varieties under dry landconditions because <strong>of</strong> the considerable variation within varieties.When the performances <strong>of</strong> ‘Genesis’ and ‘Aurora’ were compared over three irrigated crops at Forbes,and some <strong>of</strong> the variation within varieties extracted statistically, the only difference was in total seedweight, with ’Genesis’ superior to ‘Aurora’ (Table 41). A comparison <strong>of</strong> performance <strong>of</strong> irrigatedcrops <strong>of</strong> ‘Aquarius’ and ‘Salado’ after three years at Keith failed to show any differences between thevarieties except number <strong>of</strong> racemes (Table 42), but when ‘Aquarius’ and ‘Siriver’ were compared(Table 43) ‘Siriver’ was superior in all yield components except number <strong>of</strong> racemes. Differencesbetween varieties can be demonstrated, either in stability <strong>of</strong> performance or on a seasonal basis.However there can be considerable variation between fields <strong>of</strong> one variety in any year demonstratingthat differences can also be attributed to management or environmental effects. Very large differencesbetween seasons as between 1999 and 2000 at Forbes can be attributed to rain which causedcommercial yields to exhibit three-fold differences between years. Although such differences may beexceptional, average yields <strong>of</strong> 604 kg/ha in 1999 were followed by 130 kg/ha in 2000. This seasonaldifference was much more significant than observed differences between fields and varieties.Part <strong>of</strong> the variable performance <strong>of</strong> varieties lies in the variation within varieties with respect to podset and weight <strong>of</strong> seed produced per pod. Pod set depends on tripping <strong>of</strong> flowers which is affected bya range <strong>of</strong> stimuli, and seed numbers in pods is modified by pollen availability, and fertilisation <strong>of</strong>ovules. These factors are discussed below.Pollination<strong>Lucerne</strong> seed growers contract beekeepers to provide hives <strong>of</strong> honey bees in seed production fields sothat bees will trip lucerne flowers, and in the process, move pollen from one plant to another, effectingcross pollination. However, observations during this study and numerous reports in the literatureindicate that bees have a tendency to only collect nectar from lucerne flowers, without tripping theflowers and ensuring cross pollination.During the 2000 season observations were made on three lucerne seed crops at Keith to determine theeffect <strong>of</strong> distance from hives on parameters affecting seed set. Data in Tables 44-47 indicate that therewas no difference in parameters affecting seed yield between locations close to hives and points 400 to700 metres away in any <strong>of</strong> three varieties. The data support field observations <strong>of</strong> almost no tripping <strong>of</strong>flowers by honey bees during the 2000 season. Although bees were present in crops they werecollecting nectar without tripping the flowers and were therefore transferring very little pollen betweenflowers except when they visited flowers that had already been tripped. These findings support those<strong>of</strong> Maelzer and Pinnock (1983) who found no relation between lucerne seed yield and bee numbers inSouth Australia. Tysdal (1940) and many others have observed that honey bees trip very few flowersunless there are no other pollen sources available (Vansell and Todd, 1946). Doull (1961) reportedthat in South Australia red gum competes strongly with lucerne as a preferred pollen source for bees.During 2000, bees were seen to be actively collecting pollen from couch grass and various weeds inlucerne fields, rather than from lucerne.49
Although bees were rarely observed to trip flowers, large numbers <strong>of</strong> flowers tripped automaticallyparticularly on mild sunny days but not under hot or windy conditions. Automatic tripping hasfrequently been observed since early reports (eg Kirk and White, 1933). Stevenson and Bolton (1947)considered automatic tripping might be useful in plant breeding if inbreeding could be avoided.Observations were made in the field in February to seek a relationship between automatic flowertripping and seed set. In four varieties, plants which were setting many pods and plants with little podset were identified. When plants were scored for degree <strong>of</strong> automatic tripping on currently floweringracemes, it was clear that the plants with extensive tripping were the ones with large numbers <strong>of</strong> podsset (Table 48). This result is in accord with the conclusion <strong>of</strong> Armstrong and White (1935) that selftrippinglargely determines the differential seed setting capacity <strong>of</strong> lucerne plants. In a more detailedsubsequent study the total numbers <strong>of</strong> open flowers and the numbers <strong>of</strong> tripped flowers werecompared on 25 plants with good pod set and 25 plants with poor pod set (Table 49). There wereapproximately twice as many tripped flowers on plants with good pod set as on poor seed settingplants.These observations indicate that plants with high seed yield possess flowers which readily tripautomatically. These plants do not require to be cross pollinated by bees but the question arises as towhether or not automatic tripping lead to self-pollination which is known to lead to progeny which areweak vegetatively and weak in seed production (Hadfield and Calder, 1936). Dwyer and Allman(1932) reported that it was generally accepted that tripping by insects contributes to cross pollinationbut that automatic tripping leads to self pollination.To resolve this issue seed was collected from white-flowered plants in seed production fields in 2000,a year when bees were rarely observed to trip flowers or collect pollen. White flower colour iscontrolled by recessive genes. As pollination was not controlled, the progeny <strong>of</strong> white flowered plantswould be expected to have white flowers if arising through self pollination and blue if cross pollinated.When progenies from white flowered plants were grown (Table 50) there was evidence <strong>of</strong> only 5%self pollination and 95% cross pollination. This level <strong>of</strong> cross pollination is similar to that observed byother investigators (eg Knowles, 1943 and Bolton, 1948). This indicates that despite lack <strong>of</strong> beeactivity, and with considerable automatic tripping, seed arises from cross pollination. This provides anadditional question as to how is pollen transferred from one plant to another to effect cross pollination.Dwyer and Allman (1932) found that when lucerne flowers were tripped, pollen was spread in a circle25 cm in diameter. Hadfield and Calder (1936) observed pollen on the standard petals <strong>of</strong> untrippedflowers and on microscope slides suspended in the crop. When it is realised that a dense crop mayhave approximately 10,000 flowers open per m 2 at full flower there is the potential for numbers <strong>of</strong>pollen grains to be drifting through the crop and providing the potential to fertilise tripped flowers.Variation in weight <strong>of</strong> seed per pod reported in this study warrants consideration in relation t<strong>of</strong>ertilisation. Cooper et al (1937) and Tysdal (1940) found higher pod set and more seeds per pod withcross- compared with self-pollination. Doull (1961) deduced that pods resulting from self-pollinationcontain only one or two seeds compared with up to 12 seeds per pod with cross pollination. Althoughself pollination may lead to few or no seeds per pod through incompatibility (Viands et al, 1988) andovule abortion (Sayers and Murphy, 1966), it is possible that low numbers <strong>of</strong> seed per pod can betraced to other causes. There is likely to be a deficiency <strong>of</strong> pollen grains on standards <strong>of</strong> flowers if it iswashed away by rain or spray irrigation, and in a poor stand with wind movement removing pollen.50
Variation within <strong>Varieties</strong>Variation within varieties has been mentioned in the context <strong>of</strong> some plants being capable <strong>of</strong>automatic tripping and producing a good pod set while other plants are less productive. Pod numberhas been shown to be related to seed yield and weight <strong>of</strong> seed per pod to seed weight per stem. Thevariation in ‘Siriver’ for seed yield per stem was illustrated in Figure 7. This is in accord with thevariation in all varieties examined, that 25% <strong>of</strong> plants produced 50% <strong>of</strong> the yield, with the balance(75%) <strong>of</strong> plants producing much less seed. Some plants in all varieties continued to flower withoutsetting any seed. Mean values and the standard deviation with respect to key parameters affectingyield are shown for a range <strong>of</strong> varieties at Keith and Forbes (Table 51). This variation suggested thatit should be possible to select for increased seed production.To evaluate the possibilities <strong>of</strong> selecting for high and low seed yielding plants, plants setting large orsmall numbers <strong>of</strong> pods were identified in production fields and seed was collected at maturity. In thismass selection process plants were open pollinated so that although there was selection pressure on thefemale parent for high or low seed production, the pollen was contributed randomly, presumably fromboth high and low seed setting plants. If the selection aim is to increase the seed production with theaim <strong>of</strong> developing a variety, conventional breeding procedures would be used. For example desirableplants would be removed and grown in isolation so that selected high seed setting ‘female’ plantswould be exposed only to pollen from other desirable plants.Differences between progenies <strong>of</strong> high and low seed yielding plants in five varieties are shown inTables 52 to 57. The greatest response to selection was in number <strong>of</strong> pods on the main stem andnumber <strong>of</strong> pods per raceme. However the variation within selections was so great that it was difficultto demonstrate statistical differences in some characters, between high and low selections. When allvarieties were considered together (Table 57) the high and low selections were shown to be differentin all characters. This indicates that selection was effective in modifying the parameters affectinglucerne seed production and that breeding for increased seed yield would be successful.The mean values and the standard deviation for the parameters related to seed yield in the high seedyielding population are shown in Table 58. The weight <strong>of</strong> seed produced was higher on ‘HunterRiver’ and ‘Siriver’ than on other varieties and this was related to the number <strong>of</strong> pods set on the mainstem. The standard deviation was high for most characters, indicating opportunities to further modifyvarieties by selection. The genetic gain realised by one cycle <strong>of</strong> mass selection was very high,averaging 30% or more for such characters as pod number and seed yield. Less progress was made forseed weight per pod and numbers <strong>of</strong> seeds per pod.It is likely that progress in selection for pod set reflects selection for plants capable <strong>of</strong> automatictripping as tripping is an essential component in pod setting. Seed number and weight per pod may beamenable to selection if attention is paid to incompatibility and sterility factors but there is aconsiderable impact <strong>of</strong> environmental on fertilisation the prerequisite for seed development. Quality<strong>of</strong> pollen may be reduced by cold or moisture stress and quantity may be reduced through poor plantstand, wind or rain.ConclusionsThis study has revealed that some lucerne varieties are capable <strong>of</strong> high and reliable seed yield andothers are more variable in performance. However production <strong>of</strong> all varieties is dependent onmanagement and seasonal conditions. Weed control and pest control were <strong>of</strong> a high order andirrigation management was sound. A very strong adverse effect is provided by rain at flowering timeas it reduces fertilisation and seed numbers in pods. In some fields potential yields were not achievedbecause <strong>of</strong> inadequate numbers <strong>of</strong> plants, particularly in old stands.51
The characteristics <strong>of</strong> a good variety include a high and stable yield with flowers that trip readily and aheavy crop <strong>of</strong> well-filled pods on approximately ten racemes. It is likely to have a high proportion <strong>of</strong>plants with flowers that trip readily and automatically. It is unlikely to have branches high on the stemas these compete with pod development. <strong>An</strong> improved variety is also likely to be uniform with few <strong>of</strong>the poor seed producing plants which reduce yield potential <strong>of</strong> current varieties.For potential yield to be realised, there should be an excellent dense stand <strong>of</strong> stems with good weedand pest control, preferably under the care <strong>of</strong> an experienced crop monitor. The crop should not bewatered heavily in the bud stage but watered about flowering time as the combination - moist soil anddry air promotes tripping. Pod set is likely to be greatest in dry, mild, sunny weather. Dry conditionsare essential for good fertilisation <strong>of</strong> flowers. Dry weather is essential as the crop matures because wetconditions cause pods to drop and split, and seed can germinate or weather.If varieties are modified to produce higher yields <strong>of</strong> seed, the cost <strong>of</strong> seed is likely to decrease,encouraging more farmers to sow lucerne in dry land salinity control programs.<strong>Varieties</strong> with a strong automatic tripping capacity are likely to reduce the costs and variabilityinduced by dependence <strong>of</strong> honey bees for pollination. If irrigation management is changed towardsthe production <strong>of</strong> seed crops in spring instead <strong>of</strong> in summer, water will be used more efficiently andprovide the potential to irrigate additional areas.Additional research is desirable in a reassessment <strong>of</strong> the effectiveness <strong>of</strong> honey bees as pollinators andin the evaluation <strong>of</strong> the potential <strong>of</strong> irrigated spring cropping for seed production.52
ImplicationsCrop Establishment and ManagementThe research reported here has emphasised that seed yield is determined by the product <strong>of</strong> twocomponents, number <strong>of</strong> stems and yield per stem. Emphasis was placed on yield per stem whichreflects the organization within the plant, with consideration <strong>of</strong> flower production, tripping <strong>of</strong> flowers,pod set and seed production in the pod. These are characters which are modified by environmentalconditions and by the genetic constitution <strong>of</strong> the plant.The number <strong>of</strong> stems in a seed production field is affected by crop establishment, losses due to diseaseand moisture stress, and management practices. Differences in stand or plant population betweendifferent fields <strong>of</strong> the one variety can have a large effect on variation in yield.It is important that seed growers ensure that their fields carry an adequate stand. Therefore effectivecrop establishment is essential and superior grazing management is needed to avoid plant losses. Plantdiseases such as lucerne yellows also cause loss <strong>of</strong> stand and should be controlled, and management <strong>of</strong>both beneficial and destructive insects is important. As this requires the judicial use <strong>of</strong> the diversity <strong>of</strong>agricultural chemicals available, more growers should obtain input from specialist independent cropmonitors. The cost <strong>of</strong> this would be easily recouped through better management practices as, if it isnecessary to replace a depleted crop after two years instead <strong>of</strong> four, there is a new establishment cost<strong>of</strong> $400 per hectare and additional losses are incurred while the land is out <strong>of</strong> production.Selection <strong>of</strong> <strong>Varieties</strong>There is variation in performance <strong>of</strong> varieties within and between farms. Plant stand, timing <strong>of</strong>irrigation, soil characteristics and other management practices have a bearing on varietal performance.Over the three years <strong>of</strong> study some varieties exhibited a consistent performance in pod set, total seedweight, pod weight and harvest index and other varieties varied considerably in performance. Thedata indicate that performance <strong>of</strong> some varieties is more stable than others under both irrigated and dryland conditions. There was also variation in performance <strong>of</strong> a variety growing in different fields, inthe one year, demonstrating that production is affected by local factors such as soil, management andirrigation timing. The varieties with a broad adaptation to field conditions appear desirable if yieldstability is required.In view <strong>of</strong> the large number <strong>of</strong> varieties grown already and the continued development <strong>of</strong> new ones, itis important that trials be conducted in seed production districts to assess seed yield potential andlongevity <strong>of</strong> varieties. This will allow growers to identify the most appropriate varieties. Somevarieties may have twice the seed yield <strong>of</strong> others, returning an additional $1000 per hectare.BreedingWhen considerable variation in pod set was observed within individual crops in the first year <strong>of</strong> theproject, a research study was undertaken to establish whether variation was due to environmentalconditions or to genetic differences among individual plants. Seed from both high and low seedsetting plants was sown in a nursery near Bordertown, South Australia where progeny evaluationrevealed that yield components had increased substantially with selection.The data presented here indicate that there is sufficient variation in lucerne varieties for seed yield tobe increased substantially by selection and breeding. This would make seed production morepr<strong>of</strong>itable and would allow seed to be produced at very competitive prices for export markets. Withsuperior varieties and good management, yields <strong>of</strong> one tonne per hectare with a value <strong>of</strong> $3000 shouldbe achieved, a three fold increase over current yields and returns <strong>of</strong> $1000/ha. Better growers alreadyachieving 1 tonne/ha can also expect an increase in returns.53
PollinationThe investigation has shown that the practice <strong>of</strong> using honey bees as pollinators, costing seedproducers about $600,000/year in hire costs, is <strong>of</strong> doubtful value. Similar observations have beenmade in Australia and overseas for the last 70 years. However as many seed producers consider thatbees are necessary, further studies are warranted to determine the effectiveness <strong>of</strong> honey bees aspollinators.During the 2000 season observations revealed that there was no difference in seed yield betweenlocations close to and remote from hives. Although bees were present in crops they were collectingnectar without tripping the flowers and were therefore transferring very little pollen between flowers.Bees were seen to be actively collecting pollen from couch grass and weeds and not from lucerne.<strong>An</strong> alternative pollinating service may be provided by the use <strong>of</strong> leaf-cutter bees, the potential <strong>of</strong>which is currently being studied. To replace the need for insect pollinators there appears to beconsiderable potential in the development <strong>of</strong> varieties capable <strong>of</strong> automatic tripping. Many plants incurrently available varieties trip automatically and their frequency can be increased by selection andbreeding.Irrigation practicesThis report showed that seed yield per stem is similar in dry land crops in spring, and summer cropswhich are irrigated four or five times using 600 mm <strong>of</strong> water. The potential <strong>of</strong> spring irrigated seedcrops, using 200 mm water, should be investigated. More efficient water use would provide anincrease in area irrigated. Irrigated spring crops should lead to a three-fold increase in productionworth $45million in lucerne seed exports compared with $15million at present. Spring crops alsoavoid seed wasp attack which currently reduces export returns by $5million/year.When overhead irrigation was used there was evidence <strong>of</strong> reduced numbers <strong>of</strong> seeds per pod,reflecting lack <strong>of</strong> fertilisation <strong>of</strong> ovules. A greater effect <strong>of</strong> water was observed at Forbes when rainyconditions depressed yield substantially in 2000 by reducing seed weight per pod. It was concludedthat rain washes pollen from the crop canopy, reducing the availability <strong>of</strong> pollen to effect fertilisation.The adverse effect <strong>of</strong> rain suggests that seed growers should attempt to spread the risk <strong>of</strong> rain reducingyield by ensuring that various crops pass through the sensitive flowering phase at different times bystaggering closing up times.54
RecommendationsCrop Establishment and Management<strong>Lucerne</strong> crops are used for various purposes, for hay, grazing and some are harvested for seed. Seedyield depends on numbers <strong>of</strong> plants, and particularly on number <strong>of</strong> plant stems per hectare. Forirrigated crops at least 200 stems per m 2 are required to realise high seed yields." Growers should take care in sowing to obtain a thick stand <strong>of</strong> plants" Rotational grazing should be used to retain stand" Effective treatments for insect and disease attack should be used" Crop monitors should be employed to advise on appropriate management strategies" Disease resistant varieties should be planted to minimise losses and maintain seed potentialSelection <strong>of</strong> <strong>Varieties</strong><strong>Varieties</strong> vary in their seed yield and in the reliability <strong>of</strong> their seed production." <strong>Varieties</strong> should be evaluated for seed production as well as for fodder production" For reliable results varieties should be included in trials for three years and in diverse sites" Trials should be conducted by independent operatorsManagement <strong>of</strong> PollinationSeed production depends upon flowers being tripped and cross pollinated." Seed growers should evaluate effectiveness <strong>of</strong> honey bees in tripping flowers" Seed growers should consider benefits <strong>of</strong> honey bees against cost <strong>of</strong> $600,000 per year" Potential <strong>of</strong> leaf-cutter bees to increase yield should be costed" Growers should seek varieties with automatic tripping to remove need for pollinating insectsBreeding New <strong>Varieties</strong>Breeders can lower seed production costs and increase returns to seed growers by selective breeding." Breeders should select varieties for increased seed yield" Development <strong>of</strong> varieties with high levels <strong>of</strong> automatic tripping should be undertaken toreduce cost <strong>of</strong> pollinators" <strong>Varieties</strong> with multiple resistances should be bred to reduce stand loss" Germplasm should be evaluated to reduce weather losses in mature crops awaiting harvest<strong>Evaluation</strong> <strong>of</strong> Irrigation PracticesIrrigation costs are increasing and water quality and quantity are decreasing suggesting that alternativeirrigation strategies should be evaluated by lucerne seed producers" Dry land seed crops should be considered to complement irrigated crops" Spring seed crops should be evaluated to conserve water and reduce seed wasp losses" Water use efficiency in spring and summer seed crops should be examined" Growers should consider having crops mature at different times to spread loss risk" Water stress to stimulate flowering should be evaluated as a management tool" Possible detrimental effects <strong>of</strong> overhead watering at flowering time should be examined55
AppendicesAppendix 1Presentation to <strong>Lucerne</strong> growers at Keith and Forbes 2000/2001Slide 1<strong>Evaluation</strong> <strong>of</strong> <strong>Lucerne</strong> <strong>Varieties</strong>for Seed YieldDr Ross DownesInnovative Plant BreedersSupported by RIRDCPasture Seed ProgramSlide 2Relative Seed Yield <strong>of</strong> <strong>Lucerne</strong><strong>Varieties</strong>Variety Kg/Ha %Siriver 605 100Sequel 482 80Trifecta 444 73Hunter River 416 69CUF 101 420 69Aurora 335 55Hunterfield 243 40Sardi certified seed statistics (Mid 90’s)56
Slide 3Factors Affecting Variation inSeed Yield• Timing• Stand•Weather• Irrigation management•Soil type•Pests•Variety• PollinationSlide 4Seed Yield• 25% <strong>of</strong> plants give 500 Kg/ha• 75% <strong>of</strong> plants give 500 Kg/ha• Total1000 Kg/ha57
Slide 5Seed Yield• 25% <strong>of</strong> plants give 50% <strong>of</strong> yield• 75% <strong>of</strong> plants give 50% <strong>of</strong> yieldSlide 6Potential Seed Yield• 25% <strong>of</strong> plants give 500 Kg/ha• 75% <strong>of</strong> plants give 1500 Kg/haTotal2000 Kg/ha58
Slide 7Selection for Seed YieldHigh Yield Low YieldVariety Seed H Index Seedg/stemg/stemH IndexSiriver 1.06 0.22 0.82 0.16Sequel 0.89 0.17 0.70 0.12Trifecta 0.78 0.20 0.48 0.13H River 1.03 0.21 0.74 0.16Genesis 0.91 0.17 0.33 0.10Aquarius 0.44 0.15 0.31 0.06Mean 0.85 0.19 0.56 0.12Slide 8Selection for Seed YieldHigh Yield Low YieldVariety Pod # Seed/Pod Pod # Seed/PodSiriver 48 2.3 34 2.4Sequel 50 2.2 34 1.8Trifecta 40 2.9 28 2.1H River 50 2.2 21 2.1Genesis 41 2.1 21 1.5Aquarius 44 1.7 13 1.7Mean 45 2.2 25 1.959
Slide 9Factors Affecting Pod Set• Flower Abortion• Competition fromshoots• Tripping <strong>of</strong> flowers• High temperature• Low moisture• Excess moisture• New vegetative growth• Automatic• BeesSlide 10PollinatorsHoney BeesWhat are your bees doing?Are they collecting pollen andtripping flowers?orAre they only collecting nectar andcollecting pollen somewhere else?60
Slide 11What Seed Producers Can Do• Lobby breeders to select for seed yield• Lobby for comparative seed yield trials tobe held in this district61
Appendix 2Letters to Participating <strong>Lucerne</strong> GrowersRE IPB/RIRDC <strong>Lucerne</strong> Project1999DearThe field measurement and collection phase <strong>of</strong> this project for 1999 is now complete.Thank you very much for permitting access to your fields, your informative discussions and ongoingsupport. I now have well over a thousand samples to analyse and interpret before moving to the nextphase <strong>of</strong> the project which involves relating observations and performance <strong>of</strong> plants to managementpractices and seed yield.In order to do this I would appreciate your cooperation in supplying me with the information requestedon the attached spreadsheet related to timing <strong>of</strong> operations, specific land management practices andyields. I also attach a rough map indicating the fields and varieties. Would you check that I have thecorrect varieties in the fields please?I am very happy with the way this project is progressing and am confident that it will achieve its aimsto• help seed producers recognise the most pr<strong>of</strong>itable varieties to grow,• identify the best management strategies to increase seed yield, and• demonstrate to breeders the need to select for increased seed yield as well as other characterswhen they develop new varieties.When I have completed the analysis <strong>of</strong> the questionnaires and the sampling, I will organise aninformation session in your area to bring you up to date with my findings and to seek your input intothe next phase <strong>of</strong> the project.I look forward to your continuing co-operation.Kind regardsRoss DownesResearch Director62
IPB/RIRDC <strong>Lucerne</strong> Project 2001DearThank you very much for permitting access to your fields, your informative discussions and ongoingsupport with this RIRDC funded project to investigate the seed production <strong>of</strong> lucerne varieties. I amconfident that the findings will be useful to lucerne seed producers both directly, and indirectly, throughdevelopment <strong>of</strong> higher seed-yielding varieties in the future.The field measurement and collection phase <strong>of</strong> the project finished when I took the final samples fromcrops in March. During the next few months I will complete the analysis <strong>of</strong> lucerne plants collectedand prepare a report detailing the research findings and conclusions.Samples collected in the 1998-99 season revealed considerable variation among varieties andbetween fields, reflecting the effects <strong>of</strong> timing, management, irrigation and soil characteristics. Therewas also a huge amount <strong>of</strong> variation within varieties, with some plants producing large quantities <strong>of</strong>seed and others little. These observations were continued during the following two crops 1999-00 and2000-01 in which different conditions affected seed yield. All <strong>of</strong> these factors will be taken intoaccount in interpreting findings.I anticipate that the reasons for some varieties consistently producing high seed yields and othersbeing less productive will be identified. This will assist breeders to focus more on seed productionwhen new varieties are being developed and it will allow seed growers to evaluate seed productionpotential <strong>of</strong> varieties available for seed production contracts. As I suggested at field meetings, theappropriate contract price should reflect the seed yield potential <strong>of</strong> varieties. This can be easilydetermined if new varieties are compared and evaluated in seed production trials.When variation in seed production was observed within fields in 1999 and it appeared that 25% <strong>of</strong>plants produced more than 50% <strong>of</strong> the seed, seed was harvested from both good and poor seedproducing plants. When this was sown the following year it was found that good seed producers hadprogeny that were good seed producers and poor setters produced inferior descendents. Thisdemonstrated that breeders should be able to improve seed production by selection.During the 1999-2000 season particular attention was paid to frequency and activity <strong>of</strong> pollinatinginsects, particularly bees. There were mostly about 2 bees per square metre working in fields, butbees were very rarely observed to trip flowers – they were working the flowers for nectar withouttripping and cross pollinating flowers. Nevertheless plants that were setting pods strongly had largenumbers <strong>of</strong> tripped flowers. This indicated that n some plants flowers tripped automatically, withoutbees being involved. It was concluded that when a flower tripped a shower <strong>of</strong> pollen was releasedand this cross pollinated flowers on neighbouring plantsTo investigate the possibility that plants were self-pollinating, which leads to weak progeny, seed wascollected from white and cream flowered plants in various fields in 2000. When this seed was sown,the flower colour on the progeny was observed to be mostly blue, indicating that there was a gooddeal <strong>of</strong> cross-pollination. This provides evidence that automatic tripping, in the absence <strong>of</strong> beestripping flowers, leads to cross-pollination.It will help me interpret my observations if you could provide me with information on management andyield in your fields in 1999-2000 and 2000-01 on the attached spreadsheets. Also attached is a roughmap indicating the fields and varieties. Would you please check that I have the correct varieties in thefields? I would very much appreciate your help with this.63
I expect to produce the final report on this project by the end <strong>of</strong> September. I will send you a draftcopy when it is ready and would very much appreciate your comments on this document.Thank you again for your support and cooperation.Kind regardsRoss Downes64
Field ReportGrowerDate ( Day and Month <strong>of</strong>)YieldNotesFieldVarietyLast CutIrrigation1Irrigation 2Irrigation 3Irrigation 4Irrigation 5Harvestkg/ha65
Appendix 3 Travel Grant ReportTA001-12A Travel Report presented to RIRDCA report on the37 th North American Alfalfa Improvement Conference,Madison, Wisconsin, 16-19 July 2000.byDr Ross Downes,Innovative Plant BreedersPrincipal Investigator,RIRDC Project IPB-1A,<strong>Evaluation</strong> <strong>of</strong> lucerne varieties for seed yield and strategies to enhance seed productivity66
SummaryAttendance at the 37 th North American Alfalfa Improvement Conference provided useful informationand an extensive list <strong>of</strong> contacts which will be <strong>of</strong> great benefit to RIRDC Project IPB-1A, <strong>Evaluation</strong><strong>of</strong> lucerne varieties for seed yield and strategies to enhance seed productivity.Reports <strong>of</strong> the success <strong>of</strong> spring flowering and seed production are encouraging and suggest that theconcept <strong>of</strong> early flowering should be evaluated in Australia. This information has since beenpresented to collaborating seed growers at locally held meetings and they are being encouraged toexperiment with early and late flowering crops. Many seed growers set aside their crops for seedproduction in summer when high temperatures make watering expensive and inefficient and havedeleterious effects on flower tripping and seed set.Considerable research on seed production is being undertaken in France and discussions with Frenchresearchers were very useful. They have identified considerable variation within varieties for seedproduction, similar to that observed in Project IPB 1-A. In both countries it has been concluded thatbreeders have not seriously selected for seed yield. There is excellent reason to expect yield can beimproved substantially in both countries.In France native pollinators trip flowers, and in the US various bees are effective in diverse seedproduction regions. In Australia we need to examine how flowers are tripped, how pollen is movedfrom plant to plant, and determine the extent <strong>of</strong> inbreeding which tends to weaken lucerne plants.Resolution <strong>of</strong> these issues will help identify the appropriate breeding strategies for lucerne.There are considerable efforts being undertaken to research the application <strong>of</strong> biotechnology tolucerne. Although lucerne can be modified relatively easily, few products are available forcommercialisation, particularly because <strong>of</strong> legal issues and adverse consumer reactions.Novel genetic resources are being used overseas in efforts to develop varieties <strong>of</strong> lucerne suitable forgrazing. In Australia grazing tolerant varieties would have advantages in ease <strong>of</strong> managementcompared with traditional hay types which must be rotationally grazed.67
Travel ReportItineraryTravel to Madison, WisconsinArrive Madison 15 July 2000Attend Conference 16 July to 19 July 2000Return to AustraliaPurposeIt was anticipated that attendance at this conference would meet the following objectives:Identify recent international research findings <strong>of</strong> potential benefit to Australian lucerne hay and seedproducersConsider environmental factors affecting seed production with a variety <strong>of</strong> people involved in seedproduction researchDiscuss with breeders the implications <strong>of</strong> cross-pollination and self-pollination on plant vigour andproductionDetermine the current thinking worldwide on the significance and effectiveness <strong>of</strong> pollinating insectsDevelop contacts working in complementary disciplines with whom findings might be discussedAchievements/ FindingsThere is considerable emphasis on biotechnological approaches to lucerne improvement. Basicstudies reporting transformation mechanisms were reported as well as more applied issues. At abiotechnology symposium the point was made that although it is relatively easy to transform lucerne,few products are ready for commercialisation. In part this is due to complex legal issues concerningpatents, but also delays can also be attributed to community concern about the use <strong>of</strong> geneticallymodified (GM) products, even as animal feed. Current indications are that among the first GMproducts to be commercialised will be both winter active and winter dormant round-up ready(resistant) lucerne varieties. These are expected to help substantially in weed control. Efforts toproduce lucerne which does not cause bloat in cattle, through incorporation <strong>of</strong> tannin genes, is provingdifficult. The genes are expressed in the seed coat but not in the leaves where tannin is required.Increased use <strong>of</strong> lucerne for grazing is being proposed in both the US and Europe. To improve thesuitability <strong>of</strong> lucerne for grazing, selection <strong>of</strong> grazing tolerant varieties is proceeding. <strong>Varieties</strong>tolerant <strong>of</strong> cattle grazing have been produced in the US, particularly for growth with grasses whichhelp balance the diet, minimising the bloat risk. Diverse germplasm is being evaluated in Europe in aneffort to locate new sources <strong>of</strong> grazing tolerance. Creeping rooted types are being evaluated forgrazing resistance but the inheritance <strong>of</strong> this character is complex, making it difficult to use.Experiments were reported in which fodder production <strong>of</strong> ‘experimental’ lines was compared withproduction from the commercial varieties produced from them. It was concluded that yield <strong>of</strong> many‘experimental’ varieties was not a good indicator <strong>of</strong> yield <strong>of</strong> varieties derived from them. The68
implication was that yield data obtained during variety testing, though widely used, can be misleading.This casts doubt on the effectiveness <strong>of</strong> evaluation procedures in many breeding programs.Diseases and pests <strong>of</strong> lucerne vary in different countries and through quarantine, efforts are made toprevent their spread. A number <strong>of</strong> papers reported progress in developing varieties with resistance tovarious pests and diseases. In the US varieties have now been bred with resistance to the potatoleafhopper. Delegates were able to view research and trials <strong>of</strong> pest resistant varieties on two researchstations on a field trip during the conference. Presumably appropriate varieties will be available foruse in Australia should this pest be introduced.<strong>Lucerne</strong> seed production was discussed in both papers and posters. Tahiraj et al reported that inAlbania early May is the most desirable time to cut the crop for subsequent seed production. Thistiming has also been recommended in various studies reported in Canada in the past. This is muchearlier (equivalent to early November in Australia) than is the practice in Australia except in dry landcrops .Seed yield is being studied extensively in France and progress was reported in several posterspresented at the conference. On several occasions seed production issues were discussed with Frenchdelegates. Huyghe et al studied the effect <strong>of</strong> cultivar and environment on seed yield by evaluating 12varieties in 12 environments (4 locations for 3 years). They reported a high correlation between seedyield and harvest index and interpreted this to mean that selection for high seed production should notbe deleterious for vegetative growth and forage production. This is not a strictly appropriateinterpretation as fodder yield is determined by cutting at the beginning <strong>of</strong> flowering, whereas seedyield depends on factors at flowering and subsequently. <strong>An</strong> alternative interpretation <strong>of</strong> the results isthat as plants with the highest harvest index are the highest seed producers, increased seed productioncan be obtained by selection for either seed yield or harvest index. Certainly plants with high harvestindex (seed yield in relation to total above ground production) are more efficient in use <strong>of</strong> resources.In another paper Huyghe et al reported a trial in which 2 varieties were studied in each <strong>of</strong> 27environments. In this case seed yield was related to above-ground dry matter production. Theyproposed that the relationship between seed yield and biomass be used as a diagnostic tool ininvestigating limiting factors in seed production in lucerne. In another study to determine thedistribution <strong>of</strong> seed in the lucerne crop canopy Huyghe et al found that few stems had more than 11main stem inflorescences. These findings agree with observations on those plants producing high seedyield in Australia. However it is a much lower figure than on the many plants which have largernumbers <strong>of</strong> inflorescences. This difference may be attributed to the effectiveness <strong>of</strong> large numbers <strong>of</strong>native pollinating insects in France compared with the lack <strong>of</strong> effective pollinators in Australia. Theyalso found that there was more seed on inflorescences deep in the crop canopy and that seedproduction is lower at the top <strong>of</strong> the plant. This contrasts with observations in Australia where seedproduction commonly varies along the stem with lower inflorescences particularly producing littleseed which encourages the plant to continue flowering until more seed is set.French researchers also provided copies <strong>of</strong> recent papers from scientists in France not attending theconference. In one <strong>of</strong> these, Bolanos-Aguilar et al (2000) reported on the genetic variation for seedyield in lucerne. They examined varieties from many countries and observed much greater variationwithin varieties than among varieties. This is in agreement with observations in RIRDC Project IPB-1A that 25% <strong>of</strong> plants produce 50% <strong>of</strong> the seed, with the remainder <strong>of</strong> the plants producing little seed.In another paper Huyghe et al reported on opportunities to select for seed weight per inflorescence toincrease seed yield. They concluded that this could be achieved through traditional methods <strong>of</strong>breeding. They also noted that though seed yield is important in the commercial uptake <strong>of</strong> varieties,little progress in improvement <strong>of</strong> seed yield has been achieved in recent times. They attributed this to69
the fact that seed yield is considered late in breeding cycles and appropriate selection criteria have notbeen identified.Historically many US scientists have considered the possibilities <strong>of</strong> producing high yielding hybridvarieties <strong>of</strong> lucerne. One aspect <strong>of</strong> this was reported in a paper which explored the combining ability<strong>of</strong> Medicago sativa and M. falcata. There was also an opportunity to discuss implications <strong>of</strong>inbreeding, a consideration in hybrid development, with Dr Ted Bingham formally from Cornell, whohas reported vigorous plants within inbred populations through an accumulation <strong>of</strong> superior genes asinferior plants are eliminated. His findings are encouraging should it emerge that Australian varietiesexperience a degree <strong>of</strong> inbreeding because <strong>of</strong> a lack <strong>of</strong> effective pollinators. The level <strong>of</strong> inbreeding inAustralian varieties is being investigated in RIRDC Project IPB-1A.US delegates to the conference did not address seed production issues. There are several reasons forthis. On the one hand, the various seed production regions in North America have appropriatepollinators - leaf-cutter bees, bumble bees, alkali bees and honey bees which appear to effectivelypollinate the crop and assure acceptable seed yields in particular zones. Resistance to pests is regardedas more important than increased seed production and chemicals, insecticides and fungicides are usedto overcome problems until resistant varieties are available. Biotechnology and related basic studiesare currently absorbing much <strong>of</strong> the lucerne research effort.BenefitsAttendance the conference provided the following benefits:Facilitation <strong>of</strong> discussions with scientists researching inbreeding, genetic resources and seedproduction, and provided opportunities to maintain on-going contact with those active in this area.Recognition <strong>of</strong> the fact that Australian lucerne seed producers <strong>of</strong>ten harvest high yielding cropswithout the benefit <strong>of</strong> the efficient pollinating insects available in other countries. This emphasises thepotential importance <strong>of</strong> RIRDC Project IPB-1A to clarify the factors affecting lucerne seed productionin Australia.Realisation that the huge variation in ability to set seed in Australian lucerne varieties is observed in awide range <strong>of</strong> varieties evaluated in France also. This appears to reflect a lack <strong>of</strong> awareness <strong>of</strong> thevalue <strong>of</strong> high seed yield by those breeding lucerne varieties world wide.Discovery <strong>of</strong> renewed international interest in the development <strong>of</strong> grazing-tolerant varieties. Thissuggests that there are opportunities for Australian breeders to enhance the grazing tolerance <strong>of</strong>varieties for local use and for seed export.Identification <strong>of</strong> biotechnology as a significant area <strong>of</strong> increasing research effort.Acceptance that progress in biotechnology is restrained by legal issues, patents and a lack <strong>of</strong>community acceptance <strong>of</strong> genetically modified products.RecommendationsBreeders <strong>of</strong> lucerne, grasses and other open pollinated crops should be encouraged to select for seedproduction as well as fodder yield.Australian breeders should be alerted to the possibilities <strong>of</strong> using the wide germplasm resourcesavailable to breed grazing-tolerant lucerne varieties as well as hay types.70
Legal problems, non-tariff trade barriers and lack <strong>of</strong> current consumer acceptance should be taken into account when additional support for biotechnology is being considered.Suggested Dissemination <strong>of</strong> InformationInformation gathered at this conference is being taken into account in planning the next phases <strong>of</strong>RIRDC Project IPB-1A.Relevant findings will be incorporated in the final report.Information from the conference has been presented to seedgrowers at district meetings andsuggestions made about modification <strong>of</strong> practices.CommentsAttendance at this conference was most valuable in providing opportunities for comparison <strong>of</strong> factorsaffecting lucerne seed production in Australia with those being experienced overseas. Variationwithin varieties provides Australian and overseas breeders with considerable opportunities to increaseseed yield through selection. However in France, Canada and the US efficient pollinators areavailable naturally or through efficient commercial pollen vectors. There are still problems inAustralia ensuring adequate tripping <strong>of</strong> flowers and seed set through action <strong>of</strong> pollinating insects.AcknowledgementsInnovative Plant Breeders appreciates very much the support from RIRDC which made attendance atthe 37 th North American Alfalfa Improvement Conference possible.Thanks also goes to Emeritus Pr<strong>of</strong>essor Royce P Murphy, Cornell University New York, wh<strong>of</strong>acilitated contacts with many US delegates.71
References<strong>An</strong>derson, D. 2001. personal communication.Armstrong, J.M., and W.J. White. 1935. J. Agr. Sc. 25: 161-79.Bohart, G.E. 1957. <strong>An</strong>n. Rev. Ento. 2: 355-80Bolanos-Aguilar, E.D.,C. Huyghe, B. Julier, and C. Ecalle. 2000. Agronomie 20: 333-45.Bolton, J.L. 1948. Sci. Agric. 28: 97-126.Bolton, J.L., and J.R. Fryer. 1937. Sci. Agr. 18: 148-60.Boren, R.B., R.L. Parker, and E.L. Sorensen. (1962). Crop Sci. 2: 185-8.Bradner, N.R., and R.V. Frakes. 1964. Crop Sci. 4: 111.Bula, R.J., and M.A. Massengale. 1972. Agron. Monogr. 15. ASA. Madison, WI.167-84.Burkart, A. 1937. Herb. Abst. 7: 296-7.Busbice, T.H., and C.P. Wilsie. 1966. Crop Sci. 6: 377-8.Carlson, J.W. 1946. J. Amer. Soc. Agron. 38: 502-14.Clarke, A.E., and J.R. Fryer. 1930. Sci. Agr. 11: 38-43.Cooper, D.C., R.A. Brink, and H.R. Albrecht. 1937. Amer. J. Bot. 24: 203-13.De Barro, J. 2001. RIRDC. Pasture Seeds 01/79. 11.Doull, K.M. 1961. J. Aust. Inst. Agric. Sci. 27: 11-5.Doull, K.M. 1967. in The <strong>Lucerne</strong> Crop. Ed Langer, R.H.M. Reed Wellington.Dwyer, R.E. 1931. Agric. Gaz. N.S.W. 42: 703-8.Dwyer, R.E. and S.L. Allman. 1932. Agric. Gaz. N.S.W. 43: 141-6.Dwyer, R.E. and S.L. Allman. 1933. Agric. Gaz. N.S.W. 44: 363-71.Engelbert, V. 1932. Sci. Agr. 12: 593-602.Fryer, J.R. 1939. Sci. Agr. 20: 131-9.Grandfield, C.O. 1945. J. Agr. Res. 70: 123-32.Hadfield, J.W. and R.A. Calder. 1936. N.Z. J. Sci. & Tech. 17: 577-95.Hanson, C.H. (1972). Agron. Monogr. 15. ASA. Madison, WI.Hare, Q.A., and G.H. Vansell. 1946. J. Amer. Soc. Agron. 38: 462-9.Heinrichs, D.H. 1965. Canadian. J. Plant Sci. 45: 177-83.Hely, F.W., and M. Zorin. 1977. Aust. J. Agric. Res. 28: 1015-27.Hobbs, G A., and C.E.Lilly. 1955. Canadian J. Agric. Sci. 35: 422-32.Humphries, A.W., and G.C. Auricht. 2001. Aust. J. Agric. Res. 52: 153-69.Huyghe, C., E.D. Bolanos-Aguilar, C. Ecalle, J. Hacquet, and B. Julier. 1999. Proc. XIII EucarpiaMedicago spp.Group Meeting, Perugia.Irwin, J.A.G., D.L.Lloyd, and K.F. Lowe. 2001. Aust. J. Agric. Res. 52: 699-712.Jones, L.G., and C.R. Pomeroy. 1962. Calif. Agric. 16: 8-10.Kauffeld, N.M., E.L. Sorensen, and R.H. Painter. 1967. J. Econ. Ento. 60: 1135-39.Kauffeld, N.M., E.L. Sorensen, and R.H. Painter. 1969. Crop Sci.9: 225-8.Kehr, W.R. 1973. Crop Sci.13: 296-8.Kehr, W.R., and W.E. LaBerge 1966. Crop Sci. 6: 91-2.Kimbeng, C.A. and E.T. Bingham, 1998. Aust. J. Exp. Agric. 38: 831-6.Kirk, L.E. 1927. Sci. Agric. 8: 1-40.3Kirk, L.E. 1933. American Naturalist 67: 515-31.72
Kirk, L.E. and W.J. White. 1933. Sci. Agr. 13: 591-3.Knapp, E.E. and L.R. Teuber. 1990. Crop Sci. 30: 270-5.Knapp, E.E. and L.R. Teuber. 1993. Crop Sci. 33: 1181-5.Knapp, E.E. and L.R. Teuber. 1994. Crop Sci. 34: 323-6.Knapp, E.E., L.R. Teuber and J.A. Henning. 1993. Crop Sci. 33: 1176-80.Knowles, R.P. 1943. Sci. Agric. 24: 29-50.Kreitner, G.L., and E.L. Sorensen. 1985. Crop Sci. 25: 631-4.Larkin, R.A., and H.O. Graumann. 1954. Bot. Gaz. 116: 40-52.Lesins, K., E. Akerberg and Z. Bojtos. 1954. Acta Agric. Scand. 4: 239-56.Maelzer, D.A., and D. Oliver. 1987. <strong>An</strong>nual Report, Waite Inst. 86/87: 125.Maelzer, D.A., D.E. Pinnock, <strong>An</strong>nual Report, Waite Inst. 82/83: 127.Maelzer, D.A., D.E. Pinnock, P.T. Bailey, and P.E. Madge. <strong>An</strong>nual Report, Waite Inst. 80/81: 121.Palmer-Jones, T., and I.W. Forster. 1972. N.Z. J. Agric. Res. 15: 186-93.Pankiw, P., and J.L. Bolton. 1965. Canadian J. Plant Sci. 45: 333-42.Pankiw, P., J.L. Bolton, H.A. McMahon, and J.R. Foster. 1956. Canadian J. Agric. Sci. 36: 114-9.Petersen, M.W. 1967.Crop Sci. 7:59-62.Petersen, M.W. 1968 Crop Sci. 8: 263-4.Petersen, M.W., G.E. Bohart, V.L. Marble, and E.C.Klostermeyer. 1972. Agron. Monogr. 15. ASA.Madison, WI. 689-720.Pharis, R.L., and J. Unrau. 1953. Canadian J. Agric. Sci. 33: 74-83.Reinhardt, J.F. 1952. Amer. Nat. 86: 257-75.Rincker, C.M., V.L. Marble, D.E. Brown, and C.A. Johansen. 1988. Agron. Monogr. 29. ASAMadison, WI.Sayers, E.R and R.P. Murphy. 1966. Crop Sci. 6: 365-8.Sexsmith, J.J. and J.R. Fryer. 1943. Sci. Agric. 24:95-100.Spafford, W.J. 1938. Dept. Agric. South Aust. Bull. 246.Stephen, W.P. 1955. J. Econ. Ento. 48: 543-8.Stevenson, T.M., and J.L. Bolton. 1947. Emp. J. Exp. Agr. 15: 82-8.Tysdal, H.M., 1940. J. Amer. Soc. Agron. 32: 570-85.Tysdal, H.M., 1946. J. Amer. Soc. Agron. 38: 515-35.Tysdal H.M., and I. Clark. 1934. J. Amer. Soc. Agron. 26: 773-80.Tysdal, H.M., T.A. Kiesselbach, and H.L. Westover. 1942. Negr. Agr. Exp. Sta. Res. Bull. 124.Vansell, G.H., and F.E. Todd. 1946. J. Amer. Soc. Agron. 38: 470-88.Viands, D.R., P. Sun, and D.K. Barnes. 1988. Agron. Monograph 29: 931-60.Waldron, L.R. 1919. J. Amer. Soc. Agron. 11: 259-66.Walker, R.B., E.G. Elliott and I.M. Smith. 1996. RIRDC final report DAN 75A. 30pp.Woodward, D. and D.A. Maelzer. 1990. <strong>An</strong>nual Report, Waite Inst. 88/89: 129.73