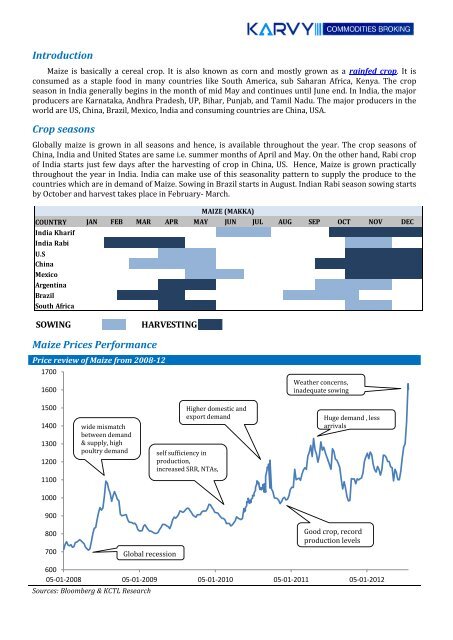
Introducti<strong>on</strong><strong>Maize</strong> is basically a cereal crop. It is also known as corn and mostly grown as a rainfed crop. It isc<strong>on</strong>sumed as a staple food in many countries like South America, sub Saharan Africa, Kenya. The cropseas<strong>on</strong> in India generally begins in the m<strong>on</strong>th of mid May and c<strong>on</strong>tinues until June end. In India, the majorproducers are Karnataka, Andhra Pradesh, UP, Bihar, Punjab, and Tamil Nadu. The major producers in theworld are US, China, Brazil, Mexico, India and c<strong>on</strong>suming countries are China, USA.Crop seas<strong>on</strong>sGlobally maize is grown in all seas<strong>on</strong>s and hence, is available throughout the year. The crop seas<strong>on</strong>s ofChina, India and United States are same i.e. summer m<strong>on</strong>ths of April and May. On the other hand, Rabi cropof India starts just few days after the harvesting of crop in China, US. Hence, <strong>Maize</strong> is grown practicallythroughout the year in India. India can make use of this <str<strong>on</strong>g>seas<strong>on</strong>al</str<strong>on</strong>g>ity pattern to supply the produce to thecountries which are in demand of <strong>Maize</strong>. Sowing in Brazil starts in August. Indian Rabi seas<strong>on</strong> sowing startsby October and harvest takes place in February- March.COUNTRYIndia KharifIndia RabiU.SChinaMexicoArgentinaBrazilSouth AfricaSOWINGMAIZE (MAKKA)JAN FEB MAR APR MAY JUN JUL AUG SEP OCT NOV DECHARVESTING<strong>Maize</strong> Prices PerformancePrice review of <strong>Maize</strong> from 2008-1217001600Weather c<strong>on</strong>cerns,inadequate sowing15001400130012001100wide mismatchbetween demand& supply, highpoultry demandHigher domestic andexport demandself sufficiency inproducti<strong>on</strong>,increased SRR, NTAs,Huge demand , lessarrivals1000900800700Global recessi<strong>on</strong>Good crop, recordproducti<strong>on</strong> levels60005-01-2008 05-01-2009 05-01-2010 05-01-2011 05-01-2012Sources: Bloomberg & KCTL Research
In the initial m<strong>on</strong>ths of the year 2008, prices were very much low due to global recessi<strong>on</strong> because of whichthe demand went down. However, during later m<strong>on</strong>ths maize prices move up due to the mismatch betweenthe demand and supply and higher poultry demand. The producti<strong>on</strong> was quite good in the year 2009-10because of various reas<strong>on</strong>s like self sufficiency in producti<strong>on</strong>, increased SRR (Seed Replacement Rate),increase in acreage of NTAs (N<strong>on</strong> Traditi<strong>on</strong>al Areas). Due to the higher supplies during Rabi seas<strong>on</strong> maizeprices fell drastically during initial m<strong>on</strong>ths of 2010. Subsequently, higher domestic and export demandsupported maize prices to recover and prices at NCDEX touched its yearly high. In year 2011, producti<strong>on</strong>was very good c<strong>on</strong>tributing 21,300 metric t<strong>on</strong>nes which resulted in huge fall in maize prices. However, inthe beginning of the year 2012, prices went up because of huge demand and less arrivals. Prices in them<strong>on</strong>ths of July 2012 made a new all time of Rs. 1640 per quintal at NCDEX Platform because of weatherc<strong>on</strong>cerns which has affected sowing to a large extent. The anticipated crop loss due to unfavourableweather is keeping maize prices firm.Factors Affecting <strong>Maize</strong> PricesIt has wide applicati<strong>on</strong>s in various fields; it is c<strong>on</strong>sumed as such after boiling, in fried form, poultry andcattle feed, bio-ethanol producti<strong>on</strong>, producti<strong>on</strong> of industrial products like starch, protein etc. Prices dependbasically <strong>on</strong> the demand and supply factors, inventory levels, current producti<strong>on</strong> levels, prices of related orsubstitute products like Soybean, domestic and internati<strong>on</strong>al demand, c<strong>on</strong>sumpti<strong>on</strong> levels of meat, Govt.interventi<strong>on</strong>s like MSP etc. Diversi<strong>on</strong> of crop for purposes other than food producti<strong>on</strong> (fuel) also leads toincrease in prices.Global scenarioWE and China are the largest maizeproducer in world followed by EU-27,Brazil and India. According to theseas<strong>on</strong> of the crop, the produce ofIndia arrives in the market at thesame time as that of the topproducers like United States, China,and European Uni<strong>on</strong> etc. HenceUnited States and India will haveenough surplus to supply to the worldand cater to the need of importingnati<strong>on</strong>s thus satisfying the food, feedand industrial sector demand. Thewinter crop of India arrives in themarket at the time after which theproduce of Brazil also enters themarket.India has an upper hand in supplyingthe produce to the world markets since it has a dual crop seas<strong>on</strong>. So in case of any problem due toproducti<strong>on</strong> or climatic c<strong>on</strong>cerns in Brazil, India will be in a positi<strong>on</strong> to supply to the demanding countries.World balance sheetGlobal <strong>Maize</strong> producti<strong>on</strong> is growing at the CAGR of 4.35% for the past five years and c<strong>on</strong>sumpti<strong>on</strong> by4.07%. Most of the global demand is estimated to be driven by China because of its increasing Hog herd,poultry populati<strong>on</strong>.Years Total Supply (Milli<strong>on</strong> T<strong>on</strong>s) Total Demand (Milli<strong>on</strong> T<strong>on</strong>s)Beginning stocks Imports Producti<strong>on</strong> Exports C<strong>on</strong>sumpti<strong>on</strong> Ending stocks2008-09 131.608 82.639 801.160 84.486 782.840 148.0812009-10 148.081 90.183 819.364 96.858 816.850 143.9202010-11 143.920 92.602 829.115 91.392 849.927 124.3182011-12 124.318 93.975 872.983 96.407 865.679 129.1902012-13* 129.190 100.316 949.933 105.322 918.379 155.738Source: USDA estimates (* projected)<strong>Maize</strong> Producing countries in worldIndia2%Ukraine3%EU7%Brazil8%Others22%Sources: USDA & KCTL Researchchina22%US36%