Fall Lower Division SFR* by Subject Area
Fall Lower Division SFR* by Subject Area
Fall Lower Division SFR* by Subject Area

You also want an ePaper? Increase the reach of your titles
YUMPU automatically turns print PDFs into web optimized ePapers that Google loves.
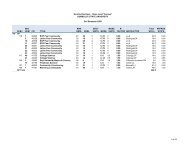
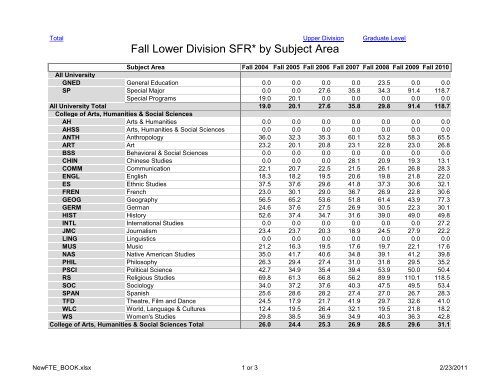
TotalUpper <strong>Division</strong><strong>Fall</strong> <strong>Lower</strong> <strong>Division</strong> <strong>SFR*</strong> <strong>by</strong> <strong>Subject</strong> <strong>Area</strong>Graduate Level<strong>Subject</strong> <strong>Area</strong> <strong>Fall</strong> 2004 <strong>Fall</strong> 2005 <strong>Fall</strong> 2006 <strong>Fall</strong> 2007 <strong>Fall</strong> 2008 <strong>Fall</strong> 2009 <strong>Fall</strong> 2010All UniversityGNED General Education 0.0 0.0 0.0 0.0 23.5 0.0 0.0SP Special Major 0.0 0.0 27.6 35.8 34.3 91.4 118.7Special Programs 19.0 20.1 0.0 0.0 0.0 0.0 0.0All University Total 19.0 20.1 27.6 35.8 29.8 91.4 118.7College of Arts, Humanities & Social SciencesAH Arts & Humanities 0.0 0.0 0.0 0.0 0.0 0.0 0.0AHSS Arts, Humanities & Social Sciences 0.0 0.0 0.0 0.0 0.0 0.0 0.0ANTH Anthropology 36.0 32.3 35.3 60.1 53.2 58.3 65.5ART Art 23.2 20.1 20.8 23.1 22.8 23.0 26.8BSS Behavioral & Social Sciences 0.0 0.0 0.0 0.0 0.0 0.0 0.0CHIN Chinese Studies 0.0 0.0 0.0 28.1 20.9 19.3 13.1COMM Communication 22.1 20.7 22.5 21.5 26.1 26.8 28.3ENGL English 18.3 18.2 19.5 20.6 19.8 21.8 22.0ES Ethnic Studies 37.5 37.6 29.6 41.8 37.3 30.6 32.1FREN French 23.0 30.1 29.0 36.7 26.9 22.8 30.6GEOG Geography 56.5 65.2 53.6 51.8 61.4 43.9 77.3GERM German 24.6 37.6 27.5 26.9 30.5 22.3 30.1HIST History 52.6 37.4 34.7 31.6 39.0 49.0 49.8INTL International Studies 0.0 0.0 0.0 0.0 0.0 0.0 27.2JMC Journalism 23.4 23.7 20.3 18.9 24.5 27.9 22.2LING Linguistics 0.0 0.0 0.0 0.0 0.0 0.0 0.0MUS Music 21.2 16.3 19.5 17.6 19.7 22.1 17.6NAS Native American Studies 35.0 41.7 40.6 34.8 39.1 41.2 39.8PHIL Philosophy 26.3 29.4 27.4 31.0 31.8 29.5 35.2PSCI Political Science 42.7 34.9 35.4 39.4 53.9 50.0 50.4RS Religious Studies 69.8 61.3 66.8 56.2 89.9 110.1 118.5SOC Sociology 34.0 37.2 37.6 40.3 47.5 49.5 53.4SPAN Spanish 25.6 28.6 28.2 27.4 27.0 26.7 28.3TFD Theatre, Film and Dance 24.5 17.9 21.7 41.9 29.7 32.6 41.0WLC World, Language & Cultures 12.4 19.5 26.4 32.1 19.5 21.8 18.2WS Women's Studies 29.8 38.5 36.9 34.9 40.3 36.3 42.8College of Arts, Humanities & Social Sciences Total 26.0 24.4 25.3 26.9 28.5 29.6 31.1NewFTE_BOOK.xlsx 1 or 3 2/23/2011
TotalUpper <strong>Division</strong><strong>Fall</strong> <strong>Lower</strong> <strong>Division</strong> <strong>SFR*</strong> <strong>by</strong> <strong>Subject</strong> <strong>Area</strong>Graduate Level<strong>Subject</strong> <strong>Area</strong> <strong>Fall</strong> 2004 <strong>Fall</strong> 2005 <strong>Fall</strong> 2006 <strong>Fall</strong> 2007 <strong>Fall</strong> 2008 <strong>Fall</strong> 2009 <strong>Fall</strong> 2010College of Natural Resources & SciencesBIOL Biology 24.9 27.9 20.3 20.9 25.9 31.1 26.7BIOM Biometrics 29.2 30.6 25.7 46.2 29.7 44.0 38.8BOT Botany 17.2 17.8 19.4 18.3 31.2 32.9 32.0CHEM Chemistry 25.2 24.6 22.0 27.8 23.8 28.9 28.3CIS Computer Information Systems 18.7 13.5 15.0 18.6 15.6 26.1 42.0CS Computer Science 16.3 19.1 17.4 18.0 22.8 22.2 17.0ENGR Engineering 16.2 13.8 17.2 19.9 18.8 17.9 22.0Environmental Resrc Engr 0.0 0.0 0.0 0.0 0.0 0.0 0.0ENVS Environmental Science 56.9 0.0 0.0 0.0 13.4 41.1 71.9FISH Fisheries 21.3 19.9 19.5 18.8 16.7 37.1 40.3FOR Forestry 24.0 18.0 14.4 19.8 19.3 23.5 25.3GEOL Geology 41.1 34.4 44.2 45.7 38.3 37.3 28.1MATH Mathematics 26.5 25.8 29.0 32.8 34.6 32.4 33.3NR Natural Resources 0.0 0.0 0.0 0.0 0.0 0.0 0.0NRPI NR Planning & Interpretation 52.7 38.2 42.2 35.2 47.4 35.5 48.4OCN Oceanography 23.8 20.3 23.8 31.9 24.3 28.7 26.7PHYX Physics 19.1 14.0 14.1 20.8 20.9 20.3 21.2RRS Rangeland Resource Science 0.0 0.0 0.0 9.0 0.0 0.0 0.0SCI Science 0.0 0.0 0.0 0.0 0.0 0.0 0.0SOIL Soils 20.4 22.2 19.5 27.6 22.9 23.8 25.0STAT Statistics 18.0 21.5 20.8 37.2 34.6 32.0 29.6WLDF Wildlife 30.8 73.9 35.1 46.4 32.4 43.8 50.5WSHD Watershed Management 0.0 0.0 0.0 0.0 0.0 0.0 0.0ZOOL Zoology 14.8 16.2 20.8 19.3 22.9 23.5 25.3College of Natural Resources & Sciences Total 23.9 22.5 23.1 27.5 27.2 29.5 29.7NewFTE_BOOK.xlsx 2 or 3 2/23/2011
TotalUpper <strong>Division</strong><strong>Fall</strong> <strong>Lower</strong> <strong>Division</strong> <strong>SFR*</strong> <strong>by</strong> <strong>Subject</strong> <strong>Area</strong>Graduate Level<strong>Subject</strong> <strong>Area</strong> <strong>Fall</strong> 2004 <strong>Fall</strong> 2005 <strong>Fall</strong> 2006 <strong>Fall</strong> 2007 <strong>Fall</strong> 2008 <strong>Fall</strong> 2009 <strong>Fall</strong> 2010College of Professional StudiesAIE American Indian Education 0.0 0.0 0.0 0.0 0.0 0.0 0.0AS Administrative Services 0.0 0.0 0.0 0.0 0.0 0.0 0.0BA Business 32.0 39.7 35.5 49.4 40.5 42.6 37.3CD Child Development 20.1 17.8 17.5 29.2 28.9 29.3 26.7ECON Economics 33.2 35.8 32.0 48.9 49.2 55.5 41.4EDUC Education 18.9 12.6 19.8 73.3 14.0 38.3 54.9EED Elementary Education 2.6 9.5 352.9 78.8 45.2 0.0 37.2HED Health Education 19.5 18.9 36.3 34.4 33.6 25.8 44.8IT Industrial Technology 17.4 20.1 17.8 22.6 23.4 26.1 18.9KINS Kinesiology 17.7 21.8 17.2 20.4 30.7 107.9 48.5LEAD Leadership Studies 10.9 15.4 216.9 131.7 0.0 0.0 0.0LSEE Liberal Studies - Elementary Education 0.0 0.0 0.0 0.0 0.0 0.0 0.0NURS Nursing 12.8 11.3 12.0 15.4 8.6 8.7 8.0PE Physical Education 31.4 30.0 39.7 50.6 50.5 55.5 55.3PS Health Safety Education 0.0 0.0 0.0 0.0 0.0 0.0 0.0PSYC Psychology 47.8 46.8 40.6 50.1 54.7 27.4 73.9REC Recreation 20.4 18.4 23.4 48.6 26.9 48.1 42.3SED Secondary Education 16.1 19.6 8.0 13.5 10.4 7.3 6.9SPED Special Education 0.0 0.0 0.0 0.0 0.0 0.0 0.0SW Social Work 17.7 14.4 16.8 37.3 57.3 18.5 51.5College of Professional Studies Total 24.8 25.1 28.0 40.0 35.7 34.1 41.0Grand Total 24.9 23.8 24.9 28.8 29.0 30.3 31.9*Note:These Student/Faculty ratios are based on census FTES and FTEF. The FTEF source (CDPS Course Section Report) reflects where facultytaught rather than where they were appointed. Thus, these ratios indicate the actual instructional experience in each subject area. See thefootnote on the FTEF summary for more information.NewFTE_BOOK.xlsx 3 or 3 2/23/2011