Fall Lower Division SFR* by Subject Area
Fall Lower Division SFR* by Subject Area
Fall Lower Division SFR* by Subject Area

Create successful ePaper yourself
Turn your PDF publications into a flip-book with our unique Google optimized e-Paper software.
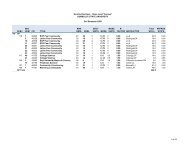
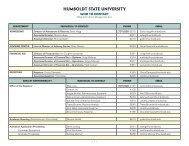
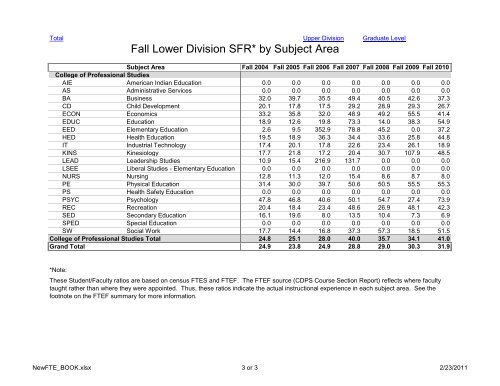
TotalUpper <strong>Division</strong><strong>Fall</strong> <strong>Lower</strong> <strong>Division</strong> <strong>SFR*</strong> <strong>by</strong> <strong>Subject</strong> <strong>Area</strong>Graduate Level<strong>Subject</strong> <strong>Area</strong> <strong>Fall</strong> 2004 <strong>Fall</strong> 2005 <strong>Fall</strong> 2006 <strong>Fall</strong> 2007 <strong>Fall</strong> 2008 <strong>Fall</strong> 2009 <strong>Fall</strong> 2010College of Professional StudiesAIE American Indian Education 0.0 0.0 0.0 0.0 0.0 0.0 0.0AS Administrative Services 0.0 0.0 0.0 0.0 0.0 0.0 0.0BA Business 32.0 39.7 35.5 49.4 40.5 42.6 37.3CD Child Development 20.1 17.8 17.5 29.2 28.9 29.3 26.7ECON Economics 33.2 35.8 32.0 48.9 49.2 55.5 41.4EDUC Education 18.9 12.6 19.8 73.3 14.0 38.3 54.9EED Elementary Education 2.6 9.5 352.9 78.8 45.2 0.0 37.2HED Health Education 19.5 18.9 36.3 34.4 33.6 25.8 44.8IT Industrial Technology 17.4 20.1 17.8 22.6 23.4 26.1 18.9KINS Kinesiology 17.7 21.8 17.2 20.4 30.7 107.9 48.5LEAD Leadership Studies 10.9 15.4 216.9 131.7 0.0 0.0 0.0LSEE Liberal Studies - Elementary Education 0.0 0.0 0.0 0.0 0.0 0.0 0.0NURS Nursing 12.8 11.3 12.0 15.4 8.6 8.7 8.0PE Physical Education 31.4 30.0 39.7 50.6 50.5 55.5 55.3PS Health Safety Education 0.0 0.0 0.0 0.0 0.0 0.0 0.0PSYC Psychology 47.8 46.8 40.6 50.1 54.7 27.4 73.9REC Recreation 20.4 18.4 23.4 48.6 26.9 48.1 42.3SED Secondary Education 16.1 19.6 8.0 13.5 10.4 7.3 6.9SPED Special Education 0.0 0.0 0.0 0.0 0.0 0.0 0.0SW Social Work 17.7 14.4 16.8 37.3 57.3 18.5 51.5College of Professional Studies Total 24.8 25.1 28.0 40.0 35.7 34.1 41.0Grand Total 24.9 23.8 24.9 28.8 29.0 30.3 31.9*Note:These Student/Faculty ratios are based on census FTES and FTEF. The FTEF source (CDPS Course Section Report) reflects where facultytaught rather than where they were appointed. Thus, these ratios indicate the actual instructional experience in each subject area. See thefootnote on the FTEF summary for more information.NewFTE_BOOK.xlsx 3 or 3 2/23/2011