Download Open More Business report - Coca-Cola Enterprises Ltd
Download Open More Business report - Coca-Cola Enterprises Ltd
Download Open More Business report - Coca-Cola Enterprises Ltd

Create successful ePaper yourself
Turn your PDF publications into a flip-book with our unique Google optimized e-Paper software.
open more<br />
business<br />
making more from soft drinks by applying new ‘category vision’
contents<br />
introduction<br />
introduction by Simon Baldry 6<br />
overview of the Soft Drinks Category 9<br />
superstore foodhall<br />
overview 17<br />
opportunities and challenges 18<br />
navigating the foodhall 21<br />
at home consumption 22<br />
Soft Drinks with food 23<br />
neighbourhood<br />
overview 29<br />
the facts 30<br />
the opportunities 31<br />
Soft Drinks with food 32<br />
energy 33<br />
fuel<br />
overview 39<br />
ensuring availability 41<br />
energy 43<br />
Soft Drinks with food 44<br />
bars, pubs and clubs<br />
overview and opportunities 51<br />
the facts 52<br />
Soft Drinks with food 53<br />
other drivers 54<br />
canteen<br />
overview 61<br />
the facts 61<br />
availability and visibility 62<br />
other drivers 63<br />
other environments<br />
overview of other environments 69
6 introduction introduction 7<br />
passionate about<br />
soft drinks<br />
Simon Baldry<br />
0 Based Upon total ‘Off-Premise’ Soft Drinks sales of<br />
£6.2 Billion (Nielsen Total Coverage, Latest 52 Weeks<br />
to w.e. 13.02.10), total ‘On-Premise’ Soft Drinks sales<br />
of £3.9 Billion (Nielsen, Total On-Premise, Latest 52<br />
Weeks to November 2009) and a CCE internal estimate<br />
You’d expect <strong>Coca</strong>-<strong>Cola</strong> <strong>Enterprises</strong><br />
<strong>Ltd</strong> (‘CCE’) to be focused on<br />
growing Soft Drink sales. And we<br />
are... We’re passionate about it.<br />
But the scale of our ambition<br />
might surprise you. The breadth of<br />
opportunities we’ve identified might<br />
surprise you. And the completeness<br />
of the evidence we’ve collected to<br />
support our goals might surprise you.<br />
We’ve brought these three<br />
together in this <strong>report</strong>: evidence,<br />
opportunity and ambition. We see<br />
an exciting future for Soft Drinks<br />
in GB and we want to share that<br />
vision with you in this publication.<br />
<strong>More</strong> than that, our approach is<br />
to partner with our customers to<br />
capitalise on that future together.<br />
We’ve called the <strong>report</strong> ‘open more<br />
business’ because that’s exactly<br />
what we think taking the right<br />
approach to selling Soft Drinks can<br />
achieve for all our customers.<br />
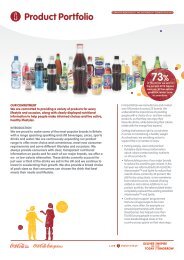
We’re committed to providing our<br />
customers and their shoppers with<br />
a complete choice of Soft Drinks for<br />
every occasion. We’re proud of our<br />
of Cold Channel / ‘Other’ channel sales of £1.3 Billion.<br />
1 Based Upon total ‘Off-Premise’ Soft Drinks sales of<br />
£6.2 Billion (Nielsen Total Coverage, Latest 52 Weeks<br />
to w.e. 13.02.10), total ‘On-Premise’ Soft Drinks sales<br />
of £3.9 Billion (Nielsen, Total On-Premise, Latest 52<br />
brand portfolio of Soft Drinks. We’re<br />
committed to increasing advertising<br />
investment significantly across this<br />
portfolio, via both traditional and<br />
new media.<br />
But this <strong>report</strong> does not focus<br />
on the CCE portfolio. ‘<strong>Open</strong><br />
more business’ captures the<br />
key to unlocking the potential<br />
we’ve identified within the Soft<br />
Drinks Category: understanding<br />
the shopper, their needs and<br />
preferences and the environments<br />
in which they shop.<br />
We are dealing with opportunities of<br />
significant scale. As a Category, in<br />
GB Soft Drinks is already worth an<br />
estimated £11.4 billion in 2009. 0<br />
To put that in perspective across<br />
the total market, Soft Drinks<br />
is much larger than both<br />
Confectionery and Biscuits in<br />
terms of total expenditure. 1<br />
And an increasing population will<br />
grow the Soft Drinks Category<br />
all by itself. The GB population is<br />
predicted to grow by more than<br />
four million between now and<br />
2018. 2<br />
Weeks to November 2009) and a CCE internal estimate<br />
of Cold Channel / ‘Other’ channel sales of £1.3 Billion,<br />
and using Kantar Worlpanel, Context <strong>report</strong> 52 Weeks<br />
to w.e. 24.01.10.<br />
2 ONS, 2008<br />
Over time more people will mean<br />
more sales. But when we measure<br />
per capita consumption rates, we<br />
see that GB is behind countries like<br />
Ireland and Belgium 3 who have<br />
similar weather patterns. We see<br />
this as a clear indication of further<br />
growth potential in GB.<br />
Consider this... if we can succeed<br />
with our customers in persuading<br />
every existing Soft Drinks<br />
consumer to buy just one more<br />
Soft Drink every fortnight, then<br />
within five years the Soft Drinks<br />
Category could be worth an extra<br />
£1.4 billion. 4<br />
‘<strong>Open</strong> more business’ is designed<br />
to provide you with the insight<br />
that can make that theoretical<br />
possibility into a commercial reality.<br />
We know that shoppers are<br />
changing. What influences<br />
them is changing. Their habits<br />
are changing. Communication<br />
technology has meant that<br />
shoppers today are better informed<br />
than ever before.<br />
3 INforM Global Industry estimate 2008<br />
4 CCE internal estimate based upon Category Vision<br />
research<br />
total off-trade soft drinks proportionate sales<br />
total soft drinks sales by sector<br />
value % change YA<br />
10.0%<br />
8.0%<br />
6.0%<br />
4.0%<br />
2.0%<br />
0.0%<br />
-2.0%<br />
-4.0%<br />
7.3%<br />
9.1%<br />
9.1%<br />
soft drinks<br />
9.1%<br />
27.7%<br />
cola<br />
flavours<br />
21.9%<br />
lemonade<br />
9.1%<br />
mixers<br />
adult<br />
pure juice<br />
fig: 1 Nielsen, Total Coverage value sales, 52 Weeks<br />
w.e. 06.02.10<br />
fig: 2 Nielsen, Total Coverage value sales, 52 Weeks<br />
w.e. 06.02.10<br />
• colas<br />
£1,357m<br />
• flavours<br />
£564m<br />
• lemonade<br />
£138m<br />
• mixers<br />
£115m<br />
• adult<br />
£279m<br />
juice drinks<br />
sports<br />
energy<br />
•<br />
•<br />
squash<br />
fruit juice<br />
£1,721m<br />
sports &<br />
energy<br />
£566m<br />
• squash<br />
£480m<br />
• water<br />
£566m<br />
• other<br />
£566m<br />
water<br />
other<br />
fig: 1<br />
fig: 2
8 introduction introduction 9<br />
We’ve tracked those changes as they happened<br />
and invested more than £2 million in a series of<br />
commissioned research studies over the past three<br />
years. We’ve also invested resource and time to assess<br />
and analyse the findings and translate them into<br />
meaningful and simple action plans to use with our<br />
customers.<br />
‘ our goal is to work<br />
with our customers<br />
to simplify the<br />
shopping experience’<br />
Our goal is to work with our customers to simplify<br />
the shopping experience and make it more engaging<br />
for shoppers and more successful for our customer<br />
partnerships.<br />
And we’ve replicated this approach right across the<br />
range of different types of customers that we work<br />
with. We’ve articulated our insights across the full<br />
range of shopping experiences, from Superstore<br />
Foodhall to Neighbourhood Convenience store,<br />
from Restaurant to Fuel Station. In total, we’ve<br />
developed action plans across 16 different shopping<br />
environments.<br />
Analysis on that scale could get complicated – we’ve<br />
worked hard to keep it simple. We’ve identified that<br />
five of the 16 environments can deliver 69% of the<br />
£1.4 billion. And to complete the proposition, CCE<br />
delivers a large and motivated sales force in GB to work<br />
with all our customers to make it easy to implement<br />
the simple step changes that we’ve identified.<br />
This is the first time CCE has published such a<br />
comprehensive forward looking assessment of the<br />
Soft Drinks Category in GB. We’ve identified a major<br />
£1.4 billion prize to go after.<br />
But we won’t achieve this on our own. It’s only<br />
through working with our customers that we can<br />
achieve our goals and successfully ‘open more business’<br />
for us and for them.<br />
Simon Baldry, Managing Director<br />
understanding the<br />
opportunity<br />
an overview of the soft drinks<br />
category<br />
16 environments in total – focusing on five here<br />
four key factors:<br />
• Merchandising<br />
• Range and space<br />
• Communications<br />
• Promotions<br />
three main drinking occasions:<br />
• Buy now, drink later – Future Consumption sales,<br />
both take-home and online<br />
• Buy and ‘fly’ – the on-the-go consumption market<br />
• Buy now, drink now – On-Premise consumption<br />
£2 million investment in research<br />
Focused on 4 key areas including: consumer/shopper<br />
understanding, shopper missions, environment<br />
identification and the exploration of the role of Soft<br />
Drinks within those environments.<br />
5 CCE Category Vision research<br />
6 FCRS Research 2009<br />
future vision in simple terms:<br />
• An increase of £1.4 billion5 is achievable. Reaching<br />
this potential simply depends on applying Best<br />
Practice in each different environment<br />
• Through the application of basic Merchandising<br />
and Category principles related to Soft Drinks,<br />
our research has shown that Retailers can expect<br />
measurable benefits:<br />
– Sales increases of up to 8% 6<br />
– The simplification of both their merchandising<br />
and stock management processes 7<br />
• The next five years also offer outstanding sportsrelated<br />
opportunities – most immediately, the<br />
Football World Cup in 2010 and the London Olympics<br />
in 2012<br />
• No other global sponsor has either a better or a<br />
longer track record than <strong>Coca</strong>-<strong>Cola</strong>. Coke can trace<br />
its track record right back to the 1928 Olympics<br />
in Amsterdam, all the way through to the Beijing<br />
Olympics in 2008 and onward to the London<br />
Olympics in 2012<br />
‘ an increase of £1.4<br />
billion is achievable’<br />
7 FCRS Research 2009
10 introduction introduction 11<br />
Today’s shoppers have changed and are continuing to<br />
change considerably. They are more complex and more<br />
demanding than their counterparts in years gone by.<br />
Within the next decade, the UK population, which<br />
currently stands at 61.4 million, is expected to increase<br />
by a further 4.3 million by 2018. 8<br />
The Office of National Statistics recorded the biggest<br />
new increase in births in almost 50 years – with<br />
791,000 live births in 2008. 9<br />
In this market, virtually everybody can enjoy Soft<br />
Drinks, in different situations, at every age and every<br />
stage of their lives.<br />
Another significant fact is that life expectancy<br />
continues to increase, little by little, year on year.<br />
In the UK, average life expectancy at birth now stands<br />
at just over 79 years. 10 With virtually every household<br />
regularly buying some Soft Drinks, we can safely<br />
predict a massive market opportunity across a variety<br />
of occasions throughout the foreseeable future. 11<br />
population estimates<br />
uk population grows to 61.1 million<br />
100<br />
males<br />
90<br />
80<br />
70<br />
60<br />
50<br />
40<br />
30<br />
20<br />
10<br />
females<br />
500 250<br />
0<br />
250 500<br />
population (thousands) population (thousands)<br />
8 ONS, 2008<br />
9 ONS, 2008<br />
10 ONS, 2008<br />
age<br />
population by gender and age, mid-2008<br />
fig: 3<br />
population estimates<br />
uk population to exceed 65 million by 2018<br />
100<br />
2033<br />
90<br />
80<br />
70<br />
60<br />
2033<br />
males<br />
50<br />
40<br />
30<br />
females<br />
2008 20<br />
10<br />
2008<br />
500 250<br />
0<br />
250 500<br />
population (thousands) population (thousands)<br />
11 ONS, 2008<br />
fig: 3 ONS, 2008<br />
age<br />
estimated and projected UK population<br />
mid-2008 and mid-2033<br />
‘ in retailing, as in<br />
any specialist area,<br />
knowledge is power’<br />
Communication technology has meant that shoppers<br />
today are better informed than ever before. Mobile<br />
phones and social media mean that all news now<br />
travels incredibly fast, good or bad, big or small.<br />
We’ve tracked those changes as they’ve happened and<br />
recently invested in four major pieces of independent<br />
research. This investment in both time and money,<br />
has given us a fresh, in-depth understanding of both<br />
the behaviour and the motivations of consumers,<br />
in different situations and different shopping modes.<br />
In retailing, as in any specialist area, knowledge<br />
is power.<br />
fig: 4<br />
ageing<br />
fastest increase in the ‘oldest old’<br />
percentages<br />
100<br />
80<br />
60<br />
40<br />
20<br />
0<br />
1983<br />
• under 16 • 16 – 64<br />
•<br />
fig: 4 ONS, 2008<br />
fig: 5 ONS, 2008<br />
2008 2033<br />
65 – 84<br />
85 and over<br />
•<br />
fig: 5<br />
a diversity of stateof-the-art<br />
research<br />
techniques<br />
These included face-to-face<br />
‘conversations’ with shoppers<br />
selected to provide a true reflection<br />
of changing consumer attitudes<br />
and behaviour, plus desk research,<br />
as follows :<br />
• Shopper focus groups<br />
• Decision trees and<br />
substitutability analysis<br />
• Consumer trends analysis<br />
• NPD and future trends analysis<br />
the commercial objective of<br />
these enquiries was prioritised<br />
as follows:<br />
• To refresh our knowledge<br />
in order to reinvigorate the<br />
Category<br />
• To simplify the shopping<br />
experience and make it more<br />
engaging<br />
• To make it easier and more<br />
convenient for Retailers to<br />
implement<br />
• To explore ways to broaden<br />
consumers’ repertoire across the<br />
Category<br />
• And finally, of course, to increase<br />
the consumer’s spend on Soft<br />
Drinks<br />
The research identified no fewer<br />
than 16 relevant shopping<br />
environments.<br />
however, these can be divided<br />
into three main groups:<br />
1. Future Consumption. The<br />
point of purchase could be a<br />
supermarket Foodhall or it could<br />
occur in the virtual world, online<br />
through a Grocery Retailer.<br />
The differentiating factor is the<br />
transaction’s ‘buy now, drink<br />
later’ aspect.<br />
2. ‘On the go’ This covers the<br />
customer on the move, probably<br />
in a bit of a hurry at a petrol<br />
station, in a canteen or in a<br />
Neighbourhood store. It’s the<br />
‘buy and fly’ opportunity.<br />
3. On-Premise consumption. This<br />
is the familiar ‘buy now, drink<br />
now’ scenario. Typically, it’s<br />
happening right now in a bar<br />
or a café or in the Canteen.<br />
the key strategic soft drinks<br />
category drivers which we<br />
identified are these:<br />
• How to improve Category<br />
availability?<br />
• How to stimulate greater<br />
frequency of ‘on-the-go’<br />
purchases?<br />
• How to encourage more<br />
consumption with food?<br />
• How to engage with teenagers?<br />
• To fully realise Energy Sector<br />
growth, through highlighting<br />
more ‘revive me’ and ‘stimulate<br />
me’ sales opportunities to a<br />
broader base of Soft Drinks<br />
consumers.<br />
• Soft Drinks that are relevant for<br />
all social occasions<br />
• Never running out at home<br />
• Soft Drinks that kids love and<br />
mums love to buy<br />
• Wellness made simple<br />
• Better quality of serve on tap<br />
the key commercial variables<br />
can be listed and addressed as<br />
follows:<br />
• How many people visit the<br />
outlet?<br />
• What mission are they on?<br />
• How many actually purchase<br />
a Soft Drink?<br />
• How many units do they buy?<br />
• How much do they spend?<br />
• And most important of all, why?<br />
Let’s take a closer look at five<br />
examples of different outlets,<br />
starting with the largest…
superstore<br />
foodhall<br />
FUEL<br />
CAFE/COFFEE SHOP<br />
RESTAURANT<br />
GENERAL STORE<br />
FAST FOOD<br />
FOOD TO GO<br />
VENDING<br />
NEIGHBOURHOOD CONVENIENCE<br />
STORE<br />
PUBS, BARS AND CLUBS CANTEEN<br />
CONCESSIONS<br />
SUPERSTORES<br />
FRONT OF STORE<br />
SUPERSTORES<br />
FOOD HALL<br />
ONLINE<br />
BULK BUYING<br />
foodhall<br />
superstore
superstore foodhall,<br />
all under one roof<br />
For our purposes, a Grocery Superstore Foodhall is<br />
defined as the area past the Front of Store where<br />
the main food aisles of the supermarket are located.<br />
Typically this is where most shoppers will conduct their<br />
main weekly household shop.<br />
However, a major supermarket operator can typically<br />
offer a number of different environments, all under<br />
the one roof:<br />
• The supermarket Front of Store (FOS) which has a<br />
focus on Convenience, offering shoppers purchases<br />
for immediate consumption<br />
• The second environment is online. Online sales<br />
are expected to double to £7.2 billion by 2014. 12<br />
Purchases are made via the Internet, with no need<br />
to visit the supermarket itself and goods ordered are<br />
delivered later, straight to the customer’s door<br />
• The third and the largest of the three environments<br />
is the Superstore Foodhall. This is still the most<br />
popular environment for the main weekly shop,<br />
where products are purchased here for consumption<br />
later, back home<br />
12 UK Grocery Outlook, IGD 2009<br />
13 CCE Shopper Missions Research 2009,<br />
Kantar Worldpanel<br />
superstore foodhall 17<br />
let’s focus first on the superstore<br />
foodhall<br />
Today there are over 5,500 of these larger outlets,<br />
currently accounting for 12% of all shopping trips for<br />
food and drink. 13 Superstore Foodhalls are expected to<br />
represent £122 billion worth of sales by 2013. 14<br />
Soft Drinks are the sixth biggest Category within<br />
Superstore Foodhall, worth £2.8 billion. 15 Those bought<br />
for Future Consumption – Take Home drinks – make<br />
up the majority of this figure at £2.6 billion. Drinks<br />
bought for immediate consumption constitute the<br />
balance, at £200 million. 16<br />
‘ online sales are<br />
expected to double<br />
to £7.2 billion by<br />
2014’<br />
14 IGD Research 2009<br />
15 Kantar Worldpanel, 52 w/e 09 Aug. 2009<br />
16 Kantar Worldpanel, 52 w/e 09 Aug. 2009
18 superstore foodhall superstore foodhall 19<br />
four key routes to increased<br />
growth:<br />
1. Increase the frequency of purchase.<br />
2. Increase the number of occasions on which<br />
Soft Drinks are bought.<br />
3. Increase the volume bought per trip.<br />
4. Increase the ability of consumers to shop the<br />
fixture quickly.<br />
opportunities and challenges<br />
• The current economic climate has increased the<br />
consumer’s focus on price and promotion. However,<br />
this makes it harder for Retailers to achieve longterm<br />
sustainable growth. What good is there in<br />
increasing the volume purchased and trip frequency,<br />
if you’re not making any profit on those sales? How<br />
can we work together to ensure continued Category<br />
growth and increased profitability?<br />
• As always, outstanding sales success depends on<br />
better shopper understanding. The more we know,<br />
the more we can hope to grow!<br />
– What occasions/needs are driving Soft Drinks<br />
purchases and are there any barriers to purchase?<br />
fig: 6 nVision/Experian forecast, August 2009-based<br />
projection (based on Q1 2009 data)<br />
real household expenditure – annual % change<br />
nVision/Experian forecast, August 2009-based projection<br />
(based on Q1 2009 data)<br />
5.0%<br />
4.0%<br />
3.0%<br />
2.0%<br />
1.0%<br />
0.0%<br />
-1.0%<br />
-2.0%<br />
-3.0%<br />
-4.0%<br />
-5.0%<br />
2001<br />
2002<br />
2003<br />
2004<br />
2005<br />
2006<br />
– What other categories are most often bought with<br />
Soft Drinks and therefore what are the best types<br />
of promotion to reflect those different occasions?<br />
– How is the shopper profile changing over time and<br />
how can we best satisfy the shopper’s changing<br />
requirements?<br />
2007<br />
2008<br />
2009<br />
2010<br />
2011<br />
soft drinks segmentation<br />
grouping products by consumer need<br />
• sports<br />
• hydration<br />
• wellness<br />
fig: 6 fig: 7<br />
let’s look at these opportunities in<br />
more detail:<br />
the changing demographics<br />
• The UK is witnessing enormous demographic<br />
changes. The population is ageing and household<br />
sizes are shrinking. 17 There are now more people<br />
over the age of 65 than under the age of 16 for the<br />
first time in UK history. Women are delaying the<br />
17 ONS, 2009 / Kantar Worldpanel 2009<br />
• stills<br />
• energy<br />
refreshment • adult socialising<br />
•<br />
birth of their first child or choosing not to start<br />
a family. Marriage is in decline. Divorce is on the<br />
increase. Everyone can expect to live longer and<br />
more people are living alone. These changes are<br />
directly affecting consumer behaviour in relation to<br />
both the purchase and consumption of Soft Drinks.<br />
Consequently suppliers and Retailers alike need to<br />
ensure that their sales activities are sensitive to<br />
these changes<br />
Broadly this can be done in a number of ways:<br />
• Specific pack formats for specific occasions. Stock<br />
larger Future Consumption packs for at home<br />
entertaining or family meal solutions, and smaller<br />
packs for lunches and Out of home consumption<br />
occasions<br />
• Have a broad set of cross Category promotions<br />
(promoting Soft Drinks alongside complementary<br />
categories, e.g. Snacks) that will appeal to different<br />
shoppers. Your stay at home mum will be attracted<br />
to something that appeals to her family while the<br />
time pressured single young professional may like<br />
something for her/himself right there, right now<br />
‘ what occasions are<br />
driving soft drinks<br />
purchases?’
20 superstore foodhall superstore foodhall 21<br />
out of stock situations should be<br />
avoided at all costs<br />
• Out of stocks are one of the biggest barriers to<br />
purchase in any environment and a constant focus<br />
point. Today’s consumers have high expectations,<br />
sometimes unrealistically high, and yet still ‘punish’<br />
Retailers who disappoint them<br />
• Faced with an out of stock situation, 37% of<br />
shoppers say they will go elsewhere. This results in a<br />
lost sale and potentially a lost customer. Shelves fully<br />
stocked with the right type and amount of products<br />
are therefore the golden key to Category growth and<br />
shopper satisfaction 18<br />
‘ the correct range,<br />
space and layout<br />
all contribute to a<br />
quick and easy sale’<br />
18 IGD Availability UK Perspective Blue Book (2004)<br />
19 IGD Availability UK Perspective Blue Book (2004)<br />
the 80/20 range rule<br />
roughly 20% of the SKUs deliver 80% of the value<br />
% value contribution<br />
100%<br />
80%<br />
60%<br />
40%<br />
20%<br />
0%<br />
0<br />
20<br />
40<br />
• The 80/20 rule really does apply across Retailers, so<br />
by ensuring you have the optimal range to give you<br />
the widest market coverage and the shortest ‘tail’ of<br />
non-performing products will help you give space to<br />
faster moving SKUs<br />
• In Soft Drinks, it’s serious money talking – out of<br />
stocks in Grocery add up to £200 million worth of<br />
lost sales every year! 19<br />
60<br />
% of SKUs<br />
fig: 8 Total FC Soft Drinks excl. chilled pure juice/juice drinks; ACN 52 weeks to w/e 21.03.09<br />
80<br />
100<br />
retailer A<br />
retailer B<br />
retailer C<br />
fig: 8<br />
clear category communication<br />
the implications for each driver on communication<br />
clearly communicating how the category fulfils shoppers’ needs will attract people<br />
into the aisle, improve ease of shop and motivate them to buy more<br />
navigating the<br />
foodhall<br />
The pace of life has increased out of<br />
all recognition in the last 50 years.<br />
As the New Yorker Woody Allen<br />
once put it: “Instant gratification<br />
isn’t fast enough for me!”<br />
fig: 9<br />
• Shoppers want to find what they<br />
want quickly. So, on the main Soft<br />
Drinks fixture, the correct range,<br />
space and layout all contribute to<br />
a quick and easy sale<br />
• Ideally, the fixture should be<br />
segmented to reflect a shopper’s<br />
understanding of the Category:<br />
for example, Soft Drinks are<br />
drunk by people for refreshment,<br />
energy and hydration etc. This is<br />
how people nowadays naturally<br />
find their way around the aisle<br />
• Good signage will help guide<br />
them to the products and<br />
formats they are looking for as<br />
fast and as clearly as possible<br />
• Ideally, everything should be<br />
directly linked to satisfying your<br />
customer’s needs as quickly and<br />
efficiently as possible
22 superstore foodhall superstore foodhall 23<br />
leisure expenditure, in and out of home<br />
in billions, at constant 2003 prices<br />
£160<br />
£140<br />
£120<br />
£100<br />
£80<br />
£60<br />
£40<br />
£20<br />
£0<br />
out of home leisure in home leisure<br />
1980<br />
1981<br />
1982<br />
1983<br />
1984<br />
1985<br />
1986<br />
1987<br />
1988<br />
1989<br />
1990<br />
1991<br />
1992<br />
1993<br />
1994<br />
1995<br />
1996<br />
1997<br />
1998<br />
1999<br />
2000<br />
2001<br />
2002<br />
2003<br />
2004<br />
2005<br />
2006<br />
2007<br />
2008<br />
2009<br />
2010<br />
2011<br />
2012<br />
2013<br />
2014<br />
‘ in home leisure expenditure<br />
is projected to match out of<br />
home levels by 2014’<br />
20 nVision/Experian forecast, April 2009-based projection<br />
(based on Q4 2008 data)<br />
21 Kantar Usage Panel 2008<br />
fig: 10<br />
22 Kantar Usage Panel 2008<br />
fig: 10 nVision/Experian forecast, April 2009-based projection<br />
(based on Q4 2008 data)<br />
at home consumption<br />
MTV identifies two phases in their<br />
audiences’ attitudes and behaviour:<br />
• Growing up<br />
• Settling down<br />
At-home entertaining is involved in<br />
both phases and is increasing!<br />
In fact, In-home leisure expenditure<br />
is projected to match Out-of-home<br />
levels by 2014 (£120 billion in the<br />
UK). 20<br />
Popular TV programmes like “Come<br />
Dine with Me” – combined with<br />
the economic climate – have made<br />
home entertaining a desirable<br />
option, where Soft Drinks have an<br />
important supporting role to play.<br />
• 75% of all Soft Drinks are<br />
consumed at home. 21 In many<br />
social situations, Soft Drinks<br />
are often perceived as a more<br />
appropriate alternative to alcohol<br />
than any hot drink. 22 This all<br />
adds up to a massive opportunity<br />
within Foodhall to target the<br />
In-home shopper<br />
• Family households can often run out of Soft Drinks<br />
– perhaps going up to four days without any form of<br />
Soft Drink in the cupboard or fridge 23<br />
• Why does this happen? Reasons commonly given<br />
include the ‘Sheer Weight Of Product’ – the SWOP<br />
factor – which can make Take Home journeys a<br />
struggle, particularly on public transport<br />
• This is also reflected in the often health conscious<br />
and sometimes cash-strapped mums’ pragmatic<br />
attitude: “When it’s gone, it’s gone!”<br />
• The key to resolving these problems lies in<br />
recognising the issues that shoppers face on<br />
different shopping missions and getting the right<br />
combination of Soft Drinks type, pack format and<br />
promotional offering to try and overcome them<br />
‘ drinks in some<br />
form are present<br />
at 74% of all uk<br />
evening meals’<br />
23 Source: Greyhound Research 2004<br />
24 Kantar Usage Panel to May 2009<br />
the with food occasion<br />
It probably comes as no surprise that Soft Drinks are<br />
normally consumed with food. In practice, drinks<br />
in some form are present at 74% of all UK evening<br />
meals. 24<br />
Given the strong correlation between Soft Drinks and<br />
food, secondary sitings and promotional bundle deals<br />
should be used wherever possible.<br />
Simple solutions like ‘Meal for tonight’ can also serve<br />
to remind shoppers to purchase a Soft Drink, if they<br />
missed it as part of the main shop.<br />
The demands of modern life continue to place<br />
pressures on families. Suppliers and Retailers have an<br />
increasingly important role to play in helping to ease<br />
those pressures and in unlocking new added value for<br />
the shopper.<br />
With that in mind, let us look at an environment<br />
closer to home…
neighbourhood<br />
CAFE/COFFEE SHOP<br />
FUEL<br />
RESTAURANT<br />
GENERAL STORE<br />
FAST FOOD<br />
FOOD TO GO<br />
VENDING<br />
neighbourhood<br />
NEIGHBOURHOOD CONVENIE<br />
STORE<br />
PUBS, BARS AND CLUBS CANTEEN<br />
CO<br />
SUP<br />
FRON
your local<br />
neighbourhood retailer<br />
Numerically, this is a large environment. It adds up to<br />
almost half of all grocery outlets and includes all of the<br />
following:<br />
• Confectionery, Tobacco and Newspaper outlets – CTNs<br />
• C-Stores and Off Licences. These are either<br />
independently owned or operated as part of a symbol/<br />
fascia group<br />
• They include 14,630 symbol outlets and close<br />
to 22,000 Independent outlets 25<br />
uk convenience market,<br />
number of stores 2000-2009<br />
number of stores<br />
60,000<br />
50,000<br />
40,000<br />
30,000<br />
20,000<br />
10,000<br />
0<br />
55,798<br />
2000<br />
54,482<br />
2001<br />
54,780<br />
2002<br />
53,862<br />
2003<br />
25 Estimates based upon IGD Research 2009<br />
fig: 11 IGD Research, 2009<br />
53,653<br />
2004<br />
52,085<br />
2005<br />
51,526<br />
2006<br />
50,734<br />
2007<br />
49,530<br />
2008<br />
48,751<br />
2009<br />
fig: 11<br />
neighbourhood 29<br />
• Typically, these outlets tend to be under 3,000 sq. ft.<br />
in size<br />
• Though the retail propositions may differ, the<br />
drivers we’ve identified within this environment<br />
apply to all – in varying degrees<br />
NB: This environment does not include Grocery<br />
Multiple Convenience stores like Tesco Express,<br />
Sainsbury’s Locals and Co-ops. It also omits Petrol<br />
Forecourt Convenience stores.<br />
uk convenience market,<br />
turnover (£m) 2000-2009<br />
turnover (£m)<br />
30,000<br />
25,000<br />
20,000<br />
15,000<br />
10,000<br />
5,000<br />
0<br />
19,181<br />
2000<br />
fig: 12 IGD Research, 2009<br />
19,574<br />
2001<br />
20,606<br />
2002<br />
21,456<br />
2003<br />
23,023<br />
2004<br />
23,893<br />
2005<br />
24,854<br />
2006<br />
26,081<br />
2007<br />
27,423<br />
2008<br />
29,084<br />
2009<br />
fig: 12
30 neighbourhood neighbourhood 31<br />
26 IGD The Evolution of Convenience Retailing, 2009<br />
27 IGD The Evolution of Convenience Retailing, 2009<br />
28 HIM CTP, 2009<br />
‘ out of stocks remain your<br />
biggest enemy – they cost<br />
you money and in some<br />
cases, customers’<br />
Neighbourhood stores represent<br />
almost 50% of all grocery outlets<br />
and ring up 20.5% of the value.<br />
They are recognised for the<br />
service that they provide to local<br />
communities and in most channels<br />
(excluding Independents) continue<br />
to grow in numbers. 26<br />
• Soft Drinks account for around<br />
6 – 8% of all Neighbourhood<br />
sales 27<br />
• Alongside Bread, Soft Drinks are<br />
the sixth most common purchase<br />
in your customers’ baskets<br />
behind Confectionery, Tobacco,<br />
Milk and Newspapers 28<br />
our research revealed<br />
some interesting<br />
facts…<br />
did you know, for example?<br />
• At over 69% by value, ‘Drink<br />
Now’ Soft Drinks represent<br />
the largest single segment<br />
of the total Category in<br />
Neighbourhood 29<br />
29 Nielsen, Independents + Symbols,<br />
latest 52 weeks to 16.01.2010<br />
30 Project Walkabout, Kantar Worldpanel 2009<br />
31 HIM CTP, 2009<br />
• To purchase something to Eat/<br />
Drink now is the number one<br />
reason to visit, followed by Topup<br />
shopping 30<br />
• Availability remains the<br />
shopper’s key concern. Shoppers<br />
say that 51% of failed purchases<br />
are due to out of stocks, with<br />
62% of those shoppers saying<br />
they would either go without or<br />
buy the item elsewhere 31<br />
• 74% of Soft Drinks purchases are<br />
drunk within two hours<br />
• 18% of Soft Drinks shoppers buy<br />
something on impulse 32<br />
• 42% of visits are unplanned 33<br />
• In this environment, Soft Drinks<br />
shoppers tend to be younger. For<br />
example, they are more likely to<br />
be students than housewives 34<br />
• Energy is now the second largest<br />
Soft Drinks sector and is also the<br />
fastest growing 35<br />
32 HIM CTP, 2009<br />
33 Project Mind, Touchstone / CCE research 2006<br />
34 HIM CTP, 2009<br />
35 Nielsen, Independents + Symbols, 52 w/e 16.01.2010<br />
what does this mean?<br />
availability<br />
• Out of stocks remain your<br />
biggest enemy – they cost you<br />
money and in some cases,<br />
customers<br />
• The best advice is to “stick with<br />
the winners” and always avoid<br />
stocking too many products<br />
• Make sure your Soft Drinks<br />
Category is clearly visible and<br />
well signposted<br />
• Remember, shoppers who can’t<br />
find products might easily<br />
assume you don’t stock them<br />
on-the-go frequency<br />
As the name suggests, this driver is<br />
all about providing shoppers with a<br />
quick and easy Soft Drinks solution<br />
whilst they’re on the move<br />
• Most shoppers are buying<br />
Soft Drinks to consume either<br />
immediately or within a couple<br />
of hours 36<br />
• Therefore it is crucial you keep<br />
your Soft Drinks cold!<br />
• 18% of Soft Drinks shoppers<br />
in this environment buy on<br />
impulse. So where possible locate<br />
your chiller near to the front of<br />
the store. This makes it visible<br />
from the street and will attract<br />
those impulse shoppers<br />
• To make the most of this impulse<br />
opportunity, place secondary<br />
chillers in high traffic areas<br />
of your store, as something to<br />
consider while queuing or at the<br />
till point<br />
‘ energy is now the second<br />
largest soft drinks sector<br />
and is also the fastest<br />
growing’<br />
36 HIM CTP, 2009<br />
37 Hijack Research, Face 2009<br />
cross category links<br />
driving take home<br />
chilled, always available<br />
shelf trays – ease of shop<br />
core chilled<br />
soft drinks offering<br />
Tune into the needs of younger<br />
shoppers. They’re keen to try new<br />
things, and are key to driving new<br />
trends. <strong>More</strong> and more are going<br />
into further education at college<br />
or university. They form a key part<br />
of the Soft Drinks consumer and,<br />
always on the move, are a frequent<br />
customer in this environment<br />
• Teenagers and students make up<br />
a large part of the customer base<br />
in Neighbourhood Convenience<br />
• They can be hard to appeal to<br />
as they are typically both priceconscious<br />
and promotionally<br />
savvy 37<br />
fig:14<br />
• That’s why the single can appeals<br />
most to teenagers<br />
• It has both a lower price point<br />
than other formats and fits their<br />
self-image better
32 neighbourhood neighbourhood 33<br />
• It’s cooler, both literally and<br />
figuratively. Teenage shoppers<br />
see cans as being both colder and<br />
fizzier than other pack formats 38<br />
• That’s why having a good range<br />
of brands in this format is<br />
essential to appealing to these<br />
shoppers 39<br />
• Promotions also need to be<br />
simple, bold and provide instant<br />
gratification<br />
• Teenagers are often hungry<br />
as well as thirsty, so you can<br />
increase your chances of gaining<br />
incremental purchases from<br />
these shoppers by clearly linking<br />
Soft Drinks with snacks<br />
This leads us onto a key element<br />
of profitable growth…<br />
‘ eat/drink now’ is the<br />
number one reason for<br />
shoppers to visit your store’<br />
38 Hijack Research, Face 2009<br />
39 Hijack Research, Face 2009<br />
40 Kantar Worldpanel w/e 12 May 2009<br />
41 HIM CTP 2009<br />
drinks with food.<br />
It really can be ‘food and drink’ to<br />
you!<br />
• ‘Eat/Drink now’ is the number<br />
one reason for shoppers to visit<br />
your store – so why not provide<br />
them with the opportunity to<br />
do both?<br />
• There are over four billion<br />
Out-of-home snacking occasions<br />
in Great Britain each year,<br />
excluding lunches. 40 By providing<br />
simple snack and meal deal<br />
options, you can take advantage<br />
of these occasions and drive<br />
incremental spend to your till<br />
• The Category that is most often<br />
purchased with Soft Drinks is<br />
Confectionery, closely followed<br />
by Crisps 41<br />
• There are therefore no better<br />
places to start when looking<br />
at snack deals!<br />
• Try to locate complementary<br />
categories close to the Soft<br />
Drinks main chiller or use<br />
cross Category display units to<br />
highlight appropriate offers<br />
• Even better, use secondary<br />
sitings of Soft Drinks next<br />
to these types of categories<br />
‘43% of stimulation drinks shoppers are<br />
less than 24 years of age’<br />
cross merchandising unit<br />
energise your sales!<br />
• Energy Drinks are the fastest<br />
growing Sector 42<br />
• 43% of stimulation drinks<br />
shoppers are less than 24 years<br />
of age. 43 That means they<br />
represent a significant share<br />
of your Soft Drinks business<br />
• Predictably, impulse purchasing<br />
of Energy Drinks is highest first<br />
thing in the morning 44<br />
42 Nielsen, Multiple Forecourts, Latest 52 Weeks<br />
to w.e. 13.02.10<br />
fig: 15<br />
• Ensure you have a reasonable<br />
range of the big selling brands in<br />
stock and in the chiller when you<br />
first open<br />
• Create more opportunities for<br />
impulse purchase through<br />
‘on-the-go’ Energy solutions<br />
like Energy Shots<br />
• Be sure to range these at key<br />
impulse points like the main<br />
walkway from the store entrance<br />
to the till, or even better at the<br />
till point itself<br />
Our increasingly hectic lifestyles<br />
are leading us to search for ever<br />
more convenient ways of getting<br />
the food, drink and energy<br />
requirements we need to see us<br />
through the day.<br />
Meeting those requirements in an<br />
easy-to-shop manner is the path to<br />
success for these outlets.<br />
43 HIM CTP 2009<br />
44 HIM CTP 2009
fuel<br />
FUEL<br />
CAFE/COFFEE SHOP<br />
RESTAURANT<br />
GENERAL<br />
fuel<br />
FAST<br />
P
soft drinks in fuel<br />
Today, Petrol Forecourt Convenience<br />
stores (PFCS) represent the fourth<br />
largest channel in the Convenience<br />
sector with a 14.1% share of the<br />
estimated £29.1 billion Convenience<br />
Market. 45<br />
They have rapidly grown in<br />
sophistication and diversity, despite<br />
overall site numbers being in<br />
decline until recently.<br />
This growing diversity has led to the<br />
emergence of three slightly differing<br />
Forecourt Convenience formats:<br />
• Traditional<br />
• Developed<br />
• Grocery<br />
45 UK Convenience Research, IGD May 2009<br />
forecourt convenience formats<br />
‘ petrol<br />
traditional<br />
forecourt<br />
convenience<br />
stores<br />
represent<br />
developed<br />
the fourth<br />
largest<br />
channel<br />
in the<br />
grocery<br />
convenience<br />
sector’<br />
fig: 16<br />
fuel 39
40 fuel fuel 41<br />
‘ soft drinks<br />
represent over<br />
10% of sales in an<br />
average PFCS – the<br />
third highest<br />
by value’<br />
While there are differences due to slightly wider<br />
product and service offerings, for simplicity, we will<br />
paint a picture of them in a single broad-brush style.<br />
Soft Drinks represent over 10% of sales in an average<br />
PFCS – the third highest by value behind Tobacco and<br />
non-food. They have the largest share of sales here<br />
when compared with any other Convenience channel. 46<br />
average sales contribution by category (%)<br />
forecourt convenience stores (2008)<br />
6.4%<br />
6.5%<br />
8.8%<br />
7.5%<br />
10.3%<br />
30.6%<br />
12.5%<br />
• tobacco<br />
30.6%<br />
• non-food<br />
12.5%<br />
•<br />
soft drinks<br />
10.3%<br />
• confectionery<br />
•<br />
8.8%<br />
sandwiches<br />
6.5%<br />
• news<br />
6.4%<br />
46 The Evolution of Convenience Retailing, IGD May 2009<br />
47 HIM CTP 2009.<br />
48 HIM CTP 2009<br />
•<br />
chilled foods<br />
4.6%<br />
• grocery<br />
3.4%<br />
• alcohol<br />
3.3%<br />
• snacks<br />
3.3%<br />
• bakery<br />
2.8%<br />
• other<br />
7.5%<br />
fig: 17<br />
So it goes without saying that Soft Drinks is a Category<br />
at the core of any successful PFCS business.<br />
So how can you extract the best return from the<br />
Category in this environment?<br />
A good place to start, as always, is in looking at who the<br />
shopper is and how they behave.<br />
Shoppers in PFCS tend to be slightly more middle<br />
market, C1/C2 in socio-economic shorthand. They<br />
tend to be blue collar, e.g. trades people or factory<br />
workers, and mothers with children. The majority tend<br />
to be aged between 25 – 44 and these characteristics<br />
are even more strongly pronounced when you look<br />
specifically at Soft Drinks shoppers. 47<br />
In general, the bias is very slightly towards men.<br />
However, when looking specifically at Soft Drinks,<br />
there are slightly more Female shoppers. Overall the<br />
ratio is 52%:48% Female to Male, although this does<br />
differ across the three formats in PFCS. 48<br />
Looking at their behaviour when shopping in this<br />
environment:<br />
• 43% just buy Fuel<br />
• 27% just buy from the shop<br />
• 30% buy both 49<br />
The key figure here is the opportunity that those 43%<br />
of ‘Fuel only’ shoppers represent. Nearly all of these<br />
shoppers will have to enter the forecourt store to pay<br />
for their Fuel. So our objective is to try and influence<br />
that shopper at key points of interruption all the way<br />
along the path to purchase – from when they first drive<br />
onto the forecourt to when they go to pay at the till.<br />
For Soft Drinks, there are a number of ways to do this<br />
and it starts with letting them know you actually sell<br />
Soft Drinks!<br />
49 HIM CTP 2009<br />
fig: 17 IGD Research, 2009<br />
using the highbeam –<br />
availability<br />
By using advertising at the<br />
roadside, at the pump and outside<br />
the store, you can inform shoppers<br />
of the products you offer and any<br />
promotions you have for them.<br />
Once they’re in the store, it’s<br />
critical to have the Soft Drinks<br />
Category clearly labelled and visible.<br />
Once again, availability is the single<br />
most important issue for shoppers<br />
when they’re in this environment:<br />
• 40% claimed that their failed<br />
purchase was due to an out of<br />
stock situation 50<br />
key points of communication on the forecourt<br />
50 HIM CTP 2009<br />
51 HIM CTP 2009<br />
1<br />
2<br />
‘ soft drinks is a category at<br />
the core of any successful<br />
PFCS business’<br />
• 22% said they couldn’t find what<br />
they were looking for 51<br />
• An estimated £26.8m 52 is lost<br />
each year in Fuel by simply not<br />
having the right stock on shelf<br />
and letting your Soft Drinks<br />
shoppers know it’s there!<br />
The busiest periods for Soft Drinks<br />
are during lunch (12pm–2pm) and<br />
after work (5pm–7pm) 53 so make<br />
3<br />
52 HIM CTP 2009<br />
53 HIM CTP 2009<br />
5<br />
4<br />
sure you have your shelves<br />
re-stocked in preparation for these<br />
peak periods.<br />
Sectors like Energy, Sport, and<br />
Water perform above average in<br />
this environment compared with<br />
other Convenience channels so<br />
those are the ones that will perform<br />
best when allowed the most space<br />
on the shelf. 54<br />
1 on the pump<br />
2 at the pump<br />
3 outside the<br />
shop<br />
4 as you enter<br />
the shop<br />
5 at the shelf<br />
54 Nielsen, Multiple Forecourts, 52 w/e 16.01.2010<br />
fig: 18
42 fuel fuel 43<br />
on-the-go frequency<br />
The on-the-go shopper is a rapidly<br />
moving target. This is especially<br />
true within the Fuel Environment,<br />
where people are frequently in<br />
transit and wanting to get to where<br />
they’re going as quickly as possible.<br />
To achieve the speed of service you<br />
need to deliver, try placing your<br />
Soft Drinks chiller in a visible and<br />
handy position, along the main<br />
walkway from the store to the till.<br />
soft drinks sector share of value, forecourts vs total impulse<br />
value % share<br />
40<br />
30<br />
20<br />
10<br />
0<br />
27.5<br />
24.2<br />
12.3<br />
6.3<br />
total impulse<br />
multiple forecourts<br />
cola flavours lemonade adult<br />
mixers<br />
sectors where forecourts over-index in share<br />
2.0 0.5 1.1 0.1 0.9 1.0<br />
adult<br />
special<br />
7.0<br />
2.5<br />
pure<br />
juice<br />
9.6 9.3<br />
juice<br />
drinks<br />
18.3<br />
30.9<br />
fast lane chiller<br />
energy sports non-fruit<br />
RTD<br />
squash water<br />
fig: 20 Nielsen, Multiple Forecourts, 52 w/e 16.01.2010 55 HIM CTP 2009<br />
56 HIM CTP 2009<br />
4.7 6.7<br />
3.9 2.8 3.3<br />
0.4<br />
9.5<br />
15.2<br />
fig: 19<br />
fig: 20<br />
‘ the number one mission,<br />
after the purchase of fuel,<br />
is to buy something to eat<br />
or drink’<br />
If this is not possible, think about<br />
locating a secondary impulse chiller<br />
along the fast-lane or near the<br />
till-point.<br />
This makes sense as the number<br />
one mission, after the purchase of<br />
Fuel, is to buy something to eat or<br />
drink immediately:<br />
• An enormous 89% of those<br />
purchases are destined to be<br />
consumed immediately or within<br />
the first two hours 55<br />
• three out of four Shoppers<br />
(74%) say it’s “extremely<br />
important” to get in and out<br />
of the shop quickly 56<br />
In combination with impulse<br />
chillers, use signage that flag up<br />
specific shopper needs.<br />
You can help stimulate impulse<br />
purchases with something as<br />
simple as a sign saying “thirsty?”<br />
And another offering an attractive<br />
and immediate solution: “ice cold!<br />
refreshing!”<br />
57 Nielsen, Multiple Forecourts, 52 w/e 16.01.2010<br />
58 HIM CTP 2009<br />
driving the driver –<br />
the energy opportunity<br />
Refreshing a thirsty motorist and<br />
providing fresh energy for a tired<br />
long-distance driver – the first is<br />
what Soft Drinks have always done,<br />
the second is what Energy Drinks<br />
can now do better than ever before.<br />
So it’s no wonder that Energy<br />
Drinks make up nearly a quarter<br />
of all Soft Drinks purchased in Fuel<br />
and is the second largest Category<br />
behind <strong>Cola</strong>s. 57<br />
The Energy shopper is definitely<br />
younger – 39% of stimulation drink<br />
shoppers here are under 24 years<br />
old. 58 Also, more than two out of<br />
three are men, with 71% of total<br />
Energy shoppers in Fuel being Male. 59<br />
59 HIM CTP 2009
44 fuel fuel 45<br />
Energy Drinks tend to be purchased either first thing<br />
in the morning or at lunchtime in Fuel. 60 That’s why to<br />
maximise your sales, it’s vital to have a good range of<br />
key brands and popular formats stocked in the chiller<br />
ready and waiting for those predictably busy periods.<br />
It’s also well worth considering link deals with<br />
complementary categories. Newspapers, for example,<br />
are a common item to be bought alongside Energy<br />
Drinks. 61 That makes them a logical choice to provide<br />
a simple and effective way of increasing shopper spend<br />
and facilitating a well-timed pit stop.<br />
Experience proves the power of merchandising impulse<br />
Categories like Energy Drinks and /or Shots near the<br />
point of purchase, either at the till or along the queue<br />
lane or both!<br />
fuel for the road –<br />
food and soft drinks<br />
In Fuel, there is a very high incidence of snacks being<br />
purchased with Soft Drinks.<br />
Over one third (36%) of all Soft Drinks baskets contain<br />
an item of Confectionery:<br />
• 21% have crisps and 11% have sandwiches 62<br />
• 30% of UK workers who purchase a food or drink<br />
item to go, do so at a Petrol Forecourt 63<br />
• It all adds up to a huge opportunity to up-weight<br />
purchases and increase sales<br />
• PFCS Food-to-go offerings are improving and gaining<br />
in popularity<br />
‘ 30% of uk workers who purchase<br />
a food or drink item to go, do so at<br />
a petrol forecourt’<br />
60 HIM CTP 2009<br />
61 HIM CTP 2009<br />
62 HIM CTP 2009<br />
63 Food To Go Research, IGD 2009<br />
In many cases they provide round-the-clock solutions<br />
for people on the move – starting with breakfast ‘on<br />
the hoof’:<br />
• 18% of people leave the house without having<br />
breakfast and buy it on the move 64<br />
• Simple breakfast meal deal options are an ideal way<br />
to target these shoppers<br />
• Soft Drinks categories like Juice Drinks, Energy<br />
Drinks or Waters would be the logical choice in any<br />
breakfast offer<br />
Come lunch time, Sectors like Juice Drinks, <strong>Cola</strong>s and<br />
Flavours deserve prominence:<br />
• Use your Soft Drinks options intelligently to exploit<br />
these different meal opportunities<br />
• Try merchandising them together in the chiller with<br />
sandwiches or rolls<br />
• Make it easy for shoppers to find what they want,<br />
when they want it<br />
64 HIM CTP 2009<br />
65 HIM CTP 2009<br />
‘ 18% of people leave<br />
the house without<br />
having breakfast<br />
and buy it on the<br />
move’<br />
Cater for Top-up shoppers.<br />
• The journey home from work is a popular time for<br />
most Top-up shopping missions 65<br />
• This is where Future Consumption packs like multipack<br />
cans and two litre bottles come into their own<br />
• Satisfying the needs of Top-up shoppers is always<br />
good for business!
ars, pubs<br />
and clubs<br />
FUEL<br />
CAFE/COFFEE SHOP<br />
RESTAURANT<br />
GENERAL STORE<br />
FAST FOOD<br />
FOOD TO GO<br />
VENDING<br />
NEIGHBOURHOOD CONV<br />
ST<br />
bars, pubs and<br />
clubs<br />
PUBS, BARS AND CLUBS CANTEEN<br />
F
the changing opportunity<br />
for licensed outlets<br />
There are some 76,000 Licensed<br />
Bars, Pubs and Clubs 66 in this<br />
country. These outlets generate<br />
over £20 billion 67 from all food and<br />
beverages consumed on site.<br />
Despite not always being the<br />
‘destination Category’, it is<br />
significant that Soft Drinks account<br />
for over 10% of this turnover. 68<br />
In the first half of 2009, around<br />
52 pubs went out of business, on<br />
average, every week, 69 as a range<br />
of social, economic and legislative<br />
pressures took their toll.<br />
However, all is not doom and<br />
gloom. The challenge for licensed<br />
outlets is to adjust to the changing<br />
needs of their customers.<br />
This environment is now smokefree,<br />
more family friendly and more<br />
health-conscious.<br />
soft drinks are ideally placed<br />
to capitalise on these changes<br />
– their role is more important<br />
than ever!<br />
<strong>More</strong> often than not the perception<br />
of Soft Drinks in Pubs is that<br />
‘ bars, pubs and clubs<br />
generate over £20 billion<br />
from all food and beverages<br />
consumed on site’<br />
66 Nielsen Total On Premise 2009<br />
67 Mintel Eating Out Review 2009<br />
68 Nielsen Total On Premise 2009<br />
69 CGA / British Beer & Pub Association Research, 2010<br />
bars, pubs and clubs 51<br />
they’re the most sensible choice,<br />
for drivers and of course, the<br />
most popular choice for children.<br />
However, their role in Pubs goes<br />
way beyond this. Soft Drinks, for<br />
many are the preferred choice, with<br />
around one in four people entering<br />
a bar just wanting a Soft Drink. 70<br />
The last 20 years have also seen<br />
the spectacular rise in popularity<br />
of ‘eating out’, with a rise in a new<br />
breed of ‘Gastro Pubs’. Here the<br />
quality and value of the food are<br />
attracting the patrons as much as<br />
the range and quality of the beers<br />
and ales available.<br />
Witness the fact that food sales now<br />
make up over a third of some Pubs’<br />
turnover. 71<br />
This trend has created increased<br />
demand for Soft Drinks either as<br />
an aperitif, or as a refreshingly<br />
acceptable accompaniment to food.<br />
70 HIM Ontrack, 2009<br />
71 Horizons Foodservice 2008
52 bars, pubs and clubs bars, pubs and clubs 53<br />
what are the key facts?<br />
• Around one in four people enters<br />
a bar just wanting a Soft Drink 72<br />
and it is one of the highest<br />
penetration Categories. 73 Whether<br />
it be groups of friends with some<br />
driving, or families with young<br />
children, consumers’ experience<br />
can often be disappointing, as<br />
there are often very few Soft<br />
Drinks on display, limited choice<br />
and poor quality of serve<br />
‘ around one in four people enters<br />
a bar just wanting a soft drink’<br />
on-trade sector values<br />
total liquor<br />
total wine<br />
total beer<br />
total cider<br />
total spirits<br />
total soft drinks<br />
72 Distillery Research 2008<br />
73 HIM Ontrack 2009<br />
74 HIM Ontrack 2009<br />
value sales by sector £m % value change – MAT % value change – YTD<br />
1421<br />
1265<br />
1067<br />
970<br />
2418<br />
2134<br />
2369<br />
2132<br />
9490<br />
8535<br />
MAT TY YTD TY<br />
14392<br />
12900<br />
-5<br />
-3<br />
0<br />
1<br />
3<br />
4<br />
75 Kantar Worldpanel Research 2008<br />
76 HIM Ontrack 2009<br />
fig: 21 Nielsen, Total Brewer to November 2009<br />
-5<br />
-3<br />
0<br />
1<br />
3<br />
4<br />
fig: 21<br />
• Consumers rate choice of<br />
drinks as the No. 1 aspect they<br />
want their Pubs to provide. 74<br />
This means having a choice of<br />
the most popular Soft Drinks,<br />
especially in the big Sectors like<br />
<strong>Cola</strong>s<br />
• Perhaps not unexpectedly, two<br />
thirds of visits to licensed outlets<br />
are for social occasions 75 with the<br />
core consumers ABC1 (slightly<br />
more up-market) and aged 25 –<br />
44. These customers are willing<br />
to pay premium prices for quality<br />
Soft Drinks that deliver health,<br />
refreshment or functional<br />
benefits. Naturally, they expect<br />
their Soft Drinks to be served<br />
in a way that enhances their<br />
drinking experience too<br />
• Some 13% of consumers rate<br />
service in Pubs as poor. No other<br />
retail channel could get away<br />
with disappointing such a large<br />
number of consumers, so why<br />
should Pubs? 76<br />
• Almost half (49%) of food bought<br />
in Pubs is consumed with Soft<br />
Drinks. 77 This is already a much<br />
higher ratio compared with any<br />
alcoholic drink including wine<br />
and beer. 78 What’s more, the<br />
trend is growing<br />
77 NPD/CREST 2009<br />
78 NPD/CREST 2009<br />
beverage incidence with food<br />
total pub sector<br />
total beverages<br />
total alcoholic beverages<br />
beer<br />
cocktails/mixed drinks<br />
wine/champagne total<br />
total hot beverages<br />
total soft drinks<br />
colas<br />
cola – regular<br />
cola – diet<br />
other fizzy flavours<br />
juice<br />
bottled water<br />
tap water<br />
2.4<br />
4.3<br />
4.6<br />
2.8<br />
% incidence<br />
13.7<br />
44.2<br />
• Further research reveals that there is a consumer<br />
need for Energy in this environment, especially in<br />
young person’s venues or Style Bars 79<br />
• Too often this need is not met, resulting in<br />
disappointment among prospective customers,<br />
not to mention lost opportunities for profit<br />
There are good profits to be made in this<br />
important Category simply by doing a few basic<br />
things much better.<br />
9.6<br />
15.8<br />
11.9<br />
12.2<br />
So what do we mean: how can you sell more<br />
Soft Drinks?<br />
27<br />
27.3<br />
49.7<br />
79 Kantar Worldpanel, Walkabout Research 2008<br />
80 NPD Group / Crest Research, 52 Weeks to December 2009<br />
97.2<br />
fig: 22<br />
food for thought<br />
There is an obvious opportunity to drive Soft Drink<br />
penetration/frequency with food even further. On<br />
average, for example, over half of all food occasions<br />
(51%) do not feature a Soft Drink. 80<br />
Food drives footfall and boosts overall outlet-spend,<br />
while Soft Drinks link more readily with food than any<br />
other Category. How can you make much, much more<br />
of this natural synergy?<br />
• Dedicate sufficient space in the chiller for Soft<br />
Drinks to adequately reflect their value share to<br />
your business<br />
• Give Soft Drinks the physical visibility they deserve<br />
both inside and outside the premises<br />
• Make the link between Soft Drinks and food much<br />
more obvious<br />
• Your Soft Drinks range should be included on the<br />
menu, preferably with the brand logo alongside<br />
• Present meal deals including Soft Drinks<br />
• Feature both adult and child-friendly options<br />
• Link promotional activity and visibility to time of<br />
day and meal occasion. Orange Juice with breakfast,<br />
adult and child options with lunch, <strong>Cola</strong>s and Energy<br />
Drinks for evening<br />
fig: 22 Crest, Latest 52 Weeks to November 2009
54 bars, pubs and clubs bars, pubs and clubs 55<br />
81 Mintel On Trade Soft Drinks Report Jan 2010<br />
fig: 23 Nielsen, Total Brewer Latest 52 Weeks to November<br />
quality, visibility<br />
and choice mean<br />
profitability<br />
Consumers won’t buy what they<br />
can’t see on a shelf, see on a poster<br />
or read in a menu. They won’t<br />
buy if their favourite brand is not<br />
available, and if it’s served poorly<br />
they won’t come back for more!<br />
Driving people towards Soft Drinks<br />
is a mixture of art and science.<br />
• Tailor your chosen range to<br />
match the taste and profile<br />
of your customers<br />
comparative value of soft drinks<br />
on-trade<br />
off-trade<br />
7.5% •<br />
16.1%<br />
41.5%<br />
6.7%<br />
18.5%<br />
6.7%<br />
colas<br />
£982,128,000<br />
• flavours<br />
£163,726,000<br />
• lemonade<br />
£437,316,000<br />
• mixers<br />
£159,531,000<br />
7.3%<br />
9.1%<br />
9.1%<br />
9.1%<br />
27.7%<br />
21.9%<br />
9.1%<br />
• colas<br />
£1,357m<br />
• flavours<br />
£564m<br />
• lemonade<br />
£138m<br />
• mixers<br />
£115m<br />
• adult<br />
£279m<br />
•<br />
fruit juice<br />
£381,363,000<br />
• squash<br />
£178,444,000<br />
• water<br />
£66,641,000<br />
•<br />
•<br />
fruit juice<br />
£1,721m<br />
sports &<br />
energy<br />
£566m<br />
• squash<br />
£480m<br />
• water<br />
£566m<br />
• other<br />
£566m<br />
fig: 23<br />
• Enhance the Soft Drinks<br />
experience for your customers<br />
through serving the product<br />
chilled and using branded<br />
glassware where available, over<br />
ice with a slice of lemon or lime<br />
• Make sure the space you assign<br />
to Soft Drinks realistically<br />
reflects their value to your<br />
business<br />
And the rewards?<br />
As a licensee, you enjoy a<br />
significant advantage over High<br />
Street Retailers, as Soft Drinks sold<br />
for immediate consumption are<br />
three times more profitable than<br />
their Take Home equivalents.<br />
But remember:<br />
• 63% of consumers resent the<br />
prices they pay 81 for Soft Drinks<br />
in the on-trade<br />
• Always offer them value for<br />
money by training your staff to<br />
serve Soft Drinks correctly<br />
• Make them well aware of all the<br />
brands and formats available<br />
to them, both packaged and<br />
post-mix<br />
• This will bring customers back<br />
into Category and the outlet –<br />
and leave them feeling good<br />
about the experience!<br />
maximise those social occasions for<br />
adults and children<br />
You can encourage consumers to buy more Soft Drinks<br />
more often and in greater volume simply by having the<br />
right products clearly visible in all the right places.<br />
The correct presentation and marketing will answer<br />
and appeal to the different needs of consumer groups.<br />
Remember to capitalise on day-parts:<br />
• Females and families are your prime prospects<br />
before 3pm 82<br />
• Ensure a range of healthy and family-friendly<br />
Soft Drinks are on offer<br />
• Feature Soft Drinks descriptors, visuals and logos<br />
on menus<br />
After 3pm you need to cater more for diverse groups<br />
and a more traditional customer mix. 83<br />
But, remember, they are willing to pay more for<br />
healthy Soft Drinks, 84 or premium mixed drinks.<br />
Once again, perceived price and quality issues are<br />
two major barriers to purchase of premium spirit<br />
mixed drinks. You can overcome this by ensuring that<br />
the ‘finished drink’ pricing is clearly visible to the<br />
consumer for spirits and mixers, ensuring all drinks<br />
are given the quality serve that your customers expect<br />
and deserve and that you stock a range of mixer pack<br />
sizes and formats to cover all consumer tastes and<br />
price expectations.<br />
82 HIM on track 2009<br />
83 HIM on track 2009<br />
energise the outlet<br />
Younger adults, aged 18 – 30, who are going out on the<br />
town or clubbing, are a force to be reckoned with!<br />
They require renewed energy.<br />
This is the fastest growing sector in the total Soft<br />
Drinks market – with further scope for growth.<br />
How can you drive more profitable penetration into<br />
this Category?<br />
• By making these drinks more visible<br />
• And offering the top choice<br />
• By always remembering that these younger<br />
customers also appreciate the quality of serve –<br />
in a branded glass, with ice and a slice of lemon<br />
or lime<br />
‘ soft drinks sold<br />
for immediate<br />
consumption are<br />
three times more<br />
profitable than<br />
their take home<br />
equivalents’<br />
84 Mintel On Trade Soft Drinks Report Jan 2010
canteen<br />
FUEL<br />
CAFE/COFFEE SHOP<br />
RESTAURANT<br />
GENERAL STORE<br />
FAST FOOD<br />
FOOD TO GO<br />
VENDING<br />
NEIGHBOURHOOD CONVENIENCE<br />
STORE<br />
PUBS, BARS AND CLUBS CANTEEN<br />
CONCESSIONS<br />
SUPERSTORES<br />
FRONT OF STORE<br />
SUPERSTORE<br />
FOOD HALL<br />
ONLINE<br />
canteen<br />
BULK BUYING
it’s all about the canteen<br />
Let’s look now at the Canteen<br />
environment.<br />
Through sheer weight of numbers<br />
and typical ‘dwell-time’ there are<br />
outstanding opportunities here to<br />
influence more consumers to buy<br />
more Soft Drinks more often. This<br />
is not the long business lunch to<br />
seal a deal – it is a lunch pause<br />
before getting back to work.<br />
The <strong>Business</strong> & Industry (B&I)<br />
Catering market is worth £1.79<br />
billion, serving some 666 million<br />
‘routine’ meals. 85 B&I Catering<br />
outlets represent just under half<br />
of total Canteen Catering outlets<br />
in the market, ahead of education,<br />
healthcare and defence outlets.<br />
There are 28.9 million people<br />
currently working in the UK. 86<br />
Each one, on average, passes some<br />
46 different outlets on their way<br />
to work. 87 That means that the<br />
Canteen competes with the High<br />
Street for custom and needs to<br />
consumer’s exposure to food /drink outlets during a typical day<br />
HOME<br />
85 Mintel B&I Catering 2009<br />
86 ONS Summer 2009<br />
87 Mintel Research 2008<br />
Wilkinson<br />
Subway<br />
Esso<br />
Red Lion Inn<br />
Waitrose<br />
Tesco Express<br />
Underground<br />
Co-op<br />
Boots<br />
Somerfield<br />
Budgens<br />
Sainsbury<br />
Marks & Spencer<br />
on average a consumer will pass 46 food and/or drink outlets on the way to work<br />
Lidl<br />
Spar<br />
88 CCE estimates based on NPD/CREST 2009<br />
89 NPD Group / Crest Research, 52 Weeks to<br />
December 2009<br />
WORK<br />
Greggs<br />
fig: 24<br />
workplace 61<br />
work hard to attract consumers<br />
and make them spend their money<br />
with them on Soft Drinks.<br />
Recent economic and social trends<br />
have put pressure on B&I Catering,<br />
but according to our calculations,<br />
the great news is this: increasing<br />
Soft Drink incidence by just 1%<br />
equates to a £2.5K annual increase<br />
in sales, per outlet. 88<br />
what are the key facts?<br />
• There is a potential loss of 1.6<br />
billion visits to other Foodservice<br />
outlets on the High Street that<br />
could have used a workplace<br />
Canteen 89<br />
• Lunch accounts for 44% of all<br />
Canteen meal occasions and Soft<br />
Drinks ‘over index’ on these<br />
occasions – yet over 70% of food<br />
occasions outside of meals do NOT<br />
involve a Soft Drink purchase 90<br />
• 16% of workplace purchases<br />
are consumed out of area and<br />
‘Grab and go’ is the second most<br />
important shopper mission 91<br />
90 NPD Group / Crest Research, 52 Weeks to<br />
December 2009<br />
91 Kantar Worldpanel 2008<br />
fig: 24 Mintel October 2008
62 workplace workplace 63<br />
We have identified an opportunity<br />
to reverse the decline and unlock<br />
new levels of opportunity.<br />
make sure the product<br />
is available and visible<br />
The pattern of peak demand is well<br />
established and easily predictable:<br />
market size and trends in canteens<br />
£m<br />
2000<br />
1800<br />
1600<br />
1400<br />
1200<br />
1000<br />
800<br />
600<br />
400<br />
200<br />
0<br />
92 HIM CTP 2009<br />
fig: 25 Mintel October 2008<br />
1673<br />
1444<br />
1694<br />
1502<br />
1734<br />
1584<br />
• Lunch<br />
• Mid-morning<br />
• Evening<br />
Nearly two thirds of consumers say<br />
this in an impulse environment. 92<br />
If they cannot find the Soft Drink<br />
products they want when they want<br />
them, they will simply go without<br />
or go elsewhere.<br />
1774<br />
1664 1656 1640<br />
2003 2004 2005 2006 2007 2008 2009<br />
£m<br />
1656 1640<br />
1638<br />
1587<br />
£m at 2009 prices<br />
In order to increase penetration and<br />
frequency of sales, it is essential to<br />
ensure the right products are visible<br />
in the right place, at the right time,<br />
at the right price.<br />
This combination is what delivers<br />
immediate satisfaction and builds<br />
customer loyalty.<br />
1663<br />
1559<br />
1702<br />
1750<br />
1796<br />
1548 1557 1558<br />
2010 2011 2012 2013<br />
fig: 25<br />
Installing the correct equipment,<br />
following the proven planogram and<br />
ensuring that staff are trained and<br />
incentivised to re-stock Soft Drinks<br />
at these key times, will ensure that<br />
no sales are lost unnecessarily.<br />
And more than that – it ensures<br />
that appealing Soft Drinks can<br />
catch the consumer’s eye in order<br />
that more purchases may be<br />
stimulated on impulse.<br />
profits on the go<br />
All employees in the workplace are<br />
‘prospects’ for the Canteen, where<br />
many are looking to ‘Grab and go’.<br />
The key to increasing Soft Drinks<br />
frequency in the workplace is to:<br />
• Drive consumers to the<br />
Canteen by highlighting it as<br />
the ‘convenient choice’. This<br />
is particularly important at a<br />
time when the lunch break is<br />
in decline<br />
• Use internal media, emails and<br />
promotions<br />
• Make the products visible<br />
wherever possible using a broad<br />
range of materials – Point of<br />
Sale, Media, Chillers, Vending<br />
Machines<br />
• Offer a range of pack formats<br />
that address the need for<br />
portability and convenience – for<br />
example, bottles as well as cans<br />
All of these triggers will expose<br />
prospects to the tempting choice<br />
available to them and ultimately<br />
mean consumers are more likely<br />
to buy more units, more often.<br />
soft drinks make more<br />
of a meal<br />
Most missions to the Canteen are<br />
for lunch time meals. This is also<br />
when Soft Drinks are most popular.<br />
This suggests that Canteen<br />
customers would buy more Soft<br />
Drinks more often if they were<br />
reminded of the value they add to<br />
food and the drinks were clearly<br />
linked to the meal occasion.<br />
Experience in other On-Premise<br />
environments suggests that Soft<br />
Drink incidence with food is very<br />
high and that there are powerful<br />
opportunities to increase the Soft<br />
Drink/food linkage in the Canteen.<br />
The main ways to do this are:<br />
• Ensuring physical proximity of<br />
Soft Drinks to fresh sandwiches,<br />
crisps and snacks<br />
• Activating meal deals and other<br />
appropriately linked promotions,<br />
utilising the day-parts –<br />
breakfast, lunch, snacking –<br />
using ‘best practice’ from the<br />
High Street as a guide
other<br />
environments<br />
FUEL<br />
CAFE/COFFEE SHOP<br />
GENERAL STORE<br />
FAST FOOD<br />
FOOD TO GO<br />
VENDING<br />
NEIGHBOURHOOD CONVENIENCE<br />
STORE<br />
CONCESSIONS<br />
SUPERSTORES<br />
FRONT OF STORE<br />
SUPERSTORES<br />
FOOD HALL<br />
ONLINE<br />
other
all other environments<br />
Soft Drinks can be enjoyed by<br />
anyone, on any occasion. Their<br />
popularity and versatility means<br />
they can be bought and consumed<br />
across numerous environments<br />
throughout the day. Here we take<br />
a brief look at the eleven other<br />
environments.<br />
grocery convenience<br />
Grocery Convenience includes<br />
smaller sized Grocery formats<br />
including Tesco Express,<br />
Sainsbury’s Locals, Co-op stores,<br />
Marks & Spencer and sophisticated<br />
Symbol chains. These outlets are<br />
geared towards a ‘Top-up’ shopping<br />
mission and generally are more<br />
skewed towards more affluent and<br />
Female shoppers. 93<br />
93 Walkabout Research, Kantar Worldpanel, 2009<br />
supermarket front<br />
of store<br />
Usually located as you enter a large<br />
supermarket, these outlets are<br />
designed to provide a Convenience<br />
offering that complements the<br />
main household shopping mission<br />
of the Foodhall. Here you can find<br />
Tobacco, Lottery, Soft Drinks and<br />
sandwich chillers, Newspapers and<br />
Confectionery – all items shoppers<br />
want to pick up quickly. Soft Drinks<br />
are often purchased for on-the-go<br />
refreshment, and are often bundled<br />
into ‘meal deals’ at lunchtime.<br />
online<br />
other environments 69<br />
<strong>More</strong> and more shoppers are using<br />
the Internet for their Grocery shop.<br />
This virtual shopping environment<br />
allows shoppers to browse for<br />
products and save a ‘personal’<br />
basket for repeat purchase at<br />
a later date.<br />
The ease of shopping from the<br />
comfort of their own home is made<br />
even more appealing as the goods<br />
are delivered to their door at a later<br />
date, usually for a fee.
70 other environments other environments 71<br />
food-to-go<br />
Outlets in this environment are typically specialist<br />
sandwich retailers or independent bakeries and chains<br />
focused on providing food and drink to people on the<br />
move. They include Boots, Prêt a Manger, Subway,<br />
Greggs, etc.<br />
These outlets are busiest primarily at lunchtimes<br />
but also in the morning, 94 catering for time-pressed<br />
workers on their way to work or enjoying a break from<br />
the office during lunch. Soft Drinks can be purchased<br />
on their own or, as is more often the case, as part of a<br />
‘meal deal’.<br />
fast food<br />
Serving food and drink to order from a pre-set menu<br />
is the hallmark of these outlets. The environment<br />
ranges from the big Fast Food chains operating eat-in<br />
restaurants to small Independent ‘Take-away’ outlets<br />
on almost every local High Street.<br />
With at least 20% of the population enjoying Fast Food<br />
at least once a fortnight, 95 it is a key environment in<br />
offering convenient meal solutions. Soft Drinks are<br />
almost always offered as part of a meal deal package.<br />
94 NPD Group / Crest Research, 52 Weeks to<br />
December 2009<br />
95 Walkabout Research, Kantar Worldpanel, 2009<br />
restaurants<br />
This environment encapsulates a wide variety of<br />
outlets ranging from fine dining venues to some pubs<br />
if greater than 50% of their sales comes from food.<br />
The defining characteristic is that food and drink is<br />
bought for immediate consumption on the premises.<br />
Customers are normally served at the table, and<br />
pay after having their meal. Soft Drinks are usually<br />
consumed alongside the main meal – 51% of food<br />
orders contain a Soft Drink of some description. 96<br />
bulk buying (route to market)<br />
Bulk Buying covers two distinct shopper and outlet<br />
propositions. The first being Club wholesalers like<br />
Costco. Shoppers usually pay an annual membership<br />
fee to purchase personal household supplies at<br />
discounted rates through the depot.<br />
The second is the Cash and Carry where a Retailer<br />
or Caterer purchases items for on-sale to an end<br />
consumer. Soft Drinks are a key Category within<br />
Cash and Carry. They are the most common Category<br />
in shopper’s baskets as well as the most common<br />
Category bought on impulse. 97<br />
96 NPD Group/Crest Research, 52 Weeks to June 2009<br />
97 HIM, Cash and Carry Programme 2009<br />
concessions<br />
Concessions include a variety of<br />
formats falling under the ‘Out of<br />
home entertainment’ umbrella.<br />
These primarily include Cinemas,<br />
Theme Parks and Resorts and are<br />
normally directed to providing a<br />
fun, social occasion for the whole<br />
family. Soft Drinks are normally<br />
served as part of set menus but<br />
can also play a role in offering<br />
‘refreshment on the go.’<br />
café /coffee shop<br />
The café, coffee shop or tea house<br />
is an environment that focuses on<br />
beverage service – primarily coffee<br />
and other hot drinks. It will also<br />
usually have a basic food and drink<br />
offering. They vary in size from the<br />
basic kiosk, serving coffee to people<br />
on the move, to full-sized coffee<br />
shops with tables where people can<br />
relax and eat and drink in.<br />
general store<br />
General Store consists mainly of<br />
outlets that are either general<br />
merchandise stores, including the<br />
likes of Wilkinsons and Poundland<br />
or specialist Retailers like Butchers,<br />
Garden Centres etc. Places where<br />
the Soft Drinks offering will be very<br />
basic – if on offer at all.<br />
vending<br />
As the name suggests vending<br />
is all about Vending Machines.<br />
These machines can be located<br />
in numerous locations, usually<br />
where people will easily see them<br />
and allow Soft Drinks to be<br />
purchased in locations where they<br />
may not otherwise be available,<br />
e.g. Workplaces, Sports Centres,<br />
Shopping Malls...<br />
If you need further information<br />
on any of these environments,<br />
please contact your local <strong>Coca</strong>-<strong>Cola</strong><br />
<strong>Enterprises</strong> representative.