Download Presentation slides PDF - Tullow Oil plc
Download Presentation slides PDF - Tullow Oil plc
Download Presentation slides PDF - Tullow Oil plc

You also want an ePaper? Increase the reach of your titles
YUMPU automatically turns print PDFs into web optimized ePapers that Google loves.
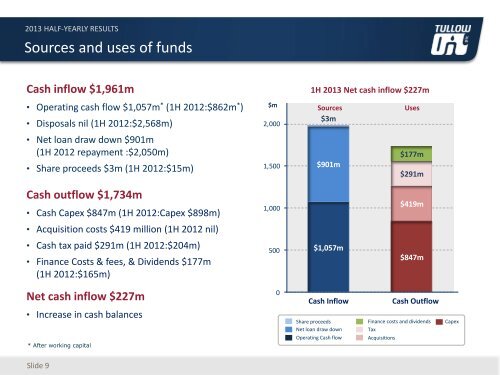
2013 HALF-YEARLY RESULTSSources and uses of fundsCash inflow $1,961m• Operating cash flow $1,057m * (1H 2012:$862m * )• Disposals nil (1H 2012:$2,568m)• Net loan draw down $901m(1H 2012 repayment :$2,050m)• Share proceeds $3m (1H 2012:$15m)$m2,0001,5001H 2013 Net cash inflow $227mSourcesUses$3m$177m$901m$291mCash outflow $1,734m• Cash Capex $847m (1H 2012:Capex $898m)1,000$419m• Acquisition costs $419 million (1H 2012 nil)• Cash tax paid $291m (1H 2012:$204m)• Finance Costs & fees, & Dividends $177m(1H 2012:$165m)500$1,057m$847mNet cash inflow $227m• Increase in cash balances* After working capital0Cash InflowShare proceedsNet loan draw downOperating Cash flowCash OutflowFinance costs and dividendsTaxAcquisitionsCapexSlide 9