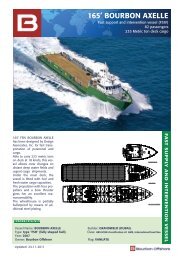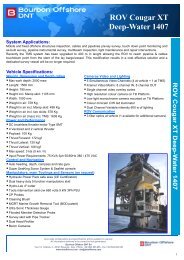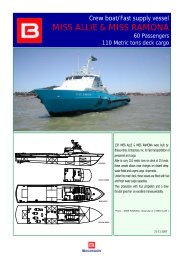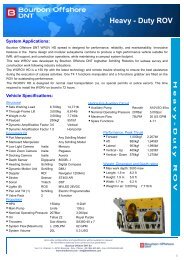
Download the complete presentation - Bourbon
Download the complete presentation - Bourbon
Download the complete presentation - Bourbon
- No tags were found...

You also want an ePaper? Increase the reach of your titles
YUMPU automatically turns print PDFs into web optimized ePapers that Google loves.
www.bourbon-online.com2010 ResultsInformation MeetingMarch 16, 2011BINNOVATIVEB u i l d i n g t o g e t h e r a s e a o f t r u s t
IntroductionJacques de ChateauvieuxChairman of <strong>the</strong> Board of Directors2
BOURBON offshore activity will deliver growthBOURBON 2015Leadership Strategy€m1000+ 28% per year+ 4%+ 17% per yearLogarithmic scale10010 Fleet growth Improvement in <strong>the</strong>utilization rates anddayrates Improvement infleet availability02002 2009 2010 20153
BOURBON 2015Leadership StrategyFinancing well under control 2011-2015Cashoperations+ disposalsCAPEXNew debtDebtreimbursementDividends(incl minorityinterests)SurpluscashHorizon2012PlanBOURBON2015PlanOrderedComingBOURBON2015ComingExistingDecided4
BOURBON 2015Leadership StrategyFinancing well under control 2011-2015Cashoperations+ disposalsCAPEXHorizon2012PlanNew debtDebtreimbursementDividends(incl minorityinterests)SurpluscashBOURBONPlan2015OrderedBOURBON2015 Non engaged investment Cash generated by Debt for <strong>the</strong> financing of ComingDecidedExisting5
BOURBON 2015Leadership StrategyKey factors for successInnovative vessels– - Operational efficiency– - Investment strategyBreakdown of revenues by segmentand average age in 2010ObjectiveGrowth of <strong>the</strong> fleetBy segment5,6 years4,1 years4 years6,6 yearsTowards 0 accidentCrew competencyEffective management offuel consumption95% availability rateReduced operating costsExploration/DevelopmentProduction/MaintenanceEnd 2007-End 2015 (8 years)Shallow Offshore Deepwater offshoreX 7X 2X 3IMR Deep Continental CrewboatsCrewboatsX 26
BOURBON 2015Leadership StrategyA growth strategy creating valueInvestments create a favorable momentumBOURBONMarket capitalisationNet assets1,61,41,210,80,60,40,2Source: Energyfiles/Douglas Westwood, 2011012/31/2005 12/31/2007 12/31/2009 20157
Financial resultsLaurent RENARDExecutive Vice President and Chief Financial Officer9
BOURBONContextOil barrelprice($/j)100908070605061791201008060Fluctuations in oil pricesat constant rate in 20101970-2010403040201002009 20102001970 1975 1980 1985 1990 1995 2000 2005 2010Current $ courant $ of du <strong>the</strong> jour day $2010€/$ rate1,61,51,41,31.391.331,81,61,41,210,8Fluctuations 1970-20101,21,11,02009 20100,60,40,201970 1975 1980 1985 1990 1995 2000 2005 2010Tx $/€10
BOURBONIncome statementIn millions of euros 2010 2009Change%2010/2009Number of owned vessels (end of period) 408 358 +14%Revenues 849.9 812.8 +4.6%Gross operating income excluding capital gains 240.1 297.5 -19.3%% of revenues28.2%36.6%Capital gains0.91.2Gross operating income (EBITDA) 240.9 298.7 -19.3%Operating income (EBIT) 53.5 176.5 -69.7%Capital employedEBITDA / average capital employed excl. installments3 25210,5%3 258*16,8%**Gross capital expenditures** 659 743* of which discontinued operations = 407 €m** including discontinued operations11
BOURBONIncome statementIn millions of euros 2010 2009Change%2010/2009Operating income (EBIT) 53.5 176.5 -69.7%Financial incomeCost of net debtO<strong>the</strong>r financial expenses and income(32.4)(54.5)22.1(34.3)(32.7)(1.5)Operations held for sale 31.6 38.0 -16.8%O<strong>the</strong>rs (taxes, minority interests) (14.9) (8.7)Net income 37.8 171.6 -78%Minority interests (1.4) 16.2Net income, Group Share 39.2 155.4 -74.8%Net earnings per share in € 0.67 2.6512
BOURBONIncome statement EBITDA:Favorable market conditions for Marine Services in a context of fastgrowing fleet EBIT:o Depreciation for new vesselso Non-recurring provisions (Brazil, Nigeria) Financial income:o Net indebteness’ cost increasingo Unrealized gain on financial instruments Net income:Decline in line with <strong>the</strong> operational result13
BOURBONKey dataRevenues + 4,6 % / + 3.5 % at constant exchange ratesIn millions of euros+22- 40+55- 9813 850 841o Fleet growtho Difficult marketo Sharp decline in <strong>the</strong> use of charteredvesselsMarineServicesSubseaServicesO<strong>the</strong>r∆ changePro forma2009revenues2010revenues2010 revenuesat constantexchange rates14
BOURBONKey dataIn millions of eurosRevenuesSUBSEA SERVICESMARINE SERVICES605 +9%660+17,5%127 1502009 20102009 201016%10%2009 201018%5%74%77%Marine Services Subsea Services O<strong>the</strong>r (including chartered vessels, cement carrier)15
BOURBONKey dataEBITDA –- 19%In millions of euros298,7-58,3Marine services : Growth fleet Decline in utilization rates Unfavorable market+4,0240,9- XX244Pro formaEBITDA2009MarineServicesSubseaServicesO<strong>the</strong>rNet capitalgains2010EBITDA∆ Change2010EBITDAat constantexchange rate16
BOURBONKey dataEBIT 2010In millions of euros240,9-58,3-120,5-13-34-34- XX-11-8,953,52010EBITDADepreciation offleet in operationas of January 1,2009Increase ofdrydocks onexisting fleet as ofJanuary 1, 2009Depreciationnew vesselsNon-recurringprovisions(Nigeria,Brazil)O<strong>the</strong>r2010EBIT17
Number of owned vessels (end of period)Utilization rate2010 200939034379.5% 83.0%TitreMarine ServicesIncome statement Sous-titreChange%2010/2009+13.7%-3.5 pts§In millions of eurosRevenues 660.3 604.9 +9.2%EBITDA excluding capital gains 182.1 240.4 -24.3%Capital gains 0.9 1.7Gross operating income (EBITDA)182.9242.1-24.4%% of revenues27.7%40.0%EBITDA/average capital employed excl. installments 9.8% 16.2%► 58 new vessels, including 26 <strong>Bourbon</strong> Liberty vessels► Unfavorable market: utilization rates and dayrates18
Marine ServicesDeepwater offshore vessels2010MarineServicesDeepOffshoreNewNumber of owned vessels (end of period)39069Utilization rate79.5%90.3%►High utilization rate thanks§In millions of eurosto <strong>the</strong> highRevenues 660.3 308.7Direct costs (406.6) (166.5)Gross operating margin 253.7 142.2contractualization rate andlimited growth of <strong>the</strong> fleet(+2 vessels)►Dayrates downGeneral and administrative costs (71.7) (33.5)EBITDA (excl. Capital gains)% of revenues182.127.6%108.635.2%19
Marine ServicesShallow water offshore vessels2010MarineServicesShallowOffshoreNewNumber of owned vessels (end of period)Utilization rate§In millions of euros39079.5%7873.2%►Strong growth of <strong>the</strong> fleet+ 26 <strong>Bourbon</strong> LibertyvesselsRevenues 660.3 151.7Direct costs (406.6) (107.7)Gross operating margin 253.7 44.0General and administrative costs (71.7) (16.5)EBITDA (excl. Capital gains)182.127.5% of revenues 27.6%18.1%►►58 <strong>Bourbon</strong> Libertyvessels in operation atend of DecemberUtilization rate greaterthan <strong>the</strong> competition, butaffected by <strong>the</strong>introduction of newvessels and Brazil20
Marine ServicesCrewboats vessels2010MarineServicesCrewboatsNewNumber of owned vessels (end of period)Utilization rate39079.5%24378.2% 30 new vessles§In millions of eurosRevenues 660.3 199.9Direct costs (406.6) (132.3) Impact of Brazil on <strong>the</strong>utilization rateGross operating margin 253.7 67.6General and administrative costs (71.7) (21.7) Steady dayratesEBITDA (excl. Capital gains)% of revenues182.127.6%45.923.0%21
Subsea ServicesVessels + IMR ROV2010NewNumber of owned vessels (end of period)Utilization rate1788.5%§In millions of euros High utilization rateRevenues 149.6 Steady dayratesDirect costs (80.6)Gross operating margin 69.0General and administrative costs (16.2)EBITDA (excl. Capital gains)% of revenues52.835.3%23
BOURBONKey dataMarine ServicesSubseaServicesDeep Shallow Crewboats IMRNumber of vesselsUilization rate697890.3% 73.2%• 7824317• 73.278.2% %88.5%Revenues (€m)308.7151.7199.9149.6EBITDA exc capital gains (€m)108.627.545.952.8EBITDA exc c.gains / Revenues35.2%18.1%23.0%35.3%24
Steady capital employed thanks to disposalsBalance sheetDecember 31, 2010In millions of eurosYear-end2010Year-end2009Offshore Activity 3,005 2,615Incl offshore fleet in operation 2,310 1,860Incl offshore fleet under construction 695 755Bulk Activity 50 400O<strong>the</strong>r 40 120WCR 160 125CAPITAL EMPLOYED 3,255 3,260Shareholders’ equity* 1,490 1,510Net debt 1,765 1,750CAPITAL EMPLOYED 3,255 3,260* inc provisions25
BOURBONBalance sheet Investments of $2 billion planned for B2015 – 25% firmly committed as ofDecember 31, 2010 Payments largely staggered upon delivery:− To be paid for Horizon 2012− Already paid for BOURBON 2015€ 280 m$ 100 m At <strong>the</strong> end of March 2011, payment will have been received for <strong>the</strong> disposalsplanned for BOURBON 2015:− Bulk activity€ 423 m− Vietnam sugar € 34 m− O<strong>the</strong>r € 48 m26
Net debtDecember 31, 2010Net debt nearly steady thanks to disposalsIn millions of euros1,750- 536+ 659+ 871, 765-248+ 53Net debtyear-end2009DisposalsCashgenerated byoperationsDividendsInvestmentsO<strong>the</strong>rNet debtyear-end201027
Balance sheetDecember 31, 2010Unrealized capital gains from <strong>the</strong> fleetIn millions of euros+ 800Unrealized CG fleetBook value fleet 2,3101,468 Shipbrokers’value 3,1102,268Unrealized CG 800Shareholders’equity as of12/31/2010Adjustedshareholders’equityGearing 1,2Adjusted gearing 0,8Market CapShareholders’equity 1,5 Market Cap0,9Adjusted SE28
Net debtDecember 31, 2010In millions of euros1,4681,765 60700Installments onvessels underconstruction1,005Shareholders’ equityas of December 31,2010Net debt as ofDecember 31, 2010Net operatingdebt29
Debt profilsDecember 31, 2010Reimbursement of existing long-term debt = €1.698mAverage maturity= 7 yearsIn milions of euros8006004002002011 2012 2013 2014 2015 andbeyond0Remainder to be drawn on existing loans €440m (incl China Eximbank)30
Cash flow statement–2010In millions of eurosNet cash as of December 31, 2009 (68.9)Net cash flow from operating activities 247.6Net cash flow from investing activities (131.5)of which property, plant and equipment (633.5)Net cash flow from financing activities (inc. Foreign exchange impact) (108.3)of which dividends paid to BOURBON shareholders (52.9)Net cash as of December 31, 2010 (61.1)Change in net cash 7.831
BOURBONOption basse = Dividende proposé auNext shareholders’ meeting Proposal to distribute a dividend of € 0.90 Proposition to distribute 1 bonus share for every 10 shares held61,532,545 shares as of December 2010Around 40,000 shareholders (TPI of January 2011)Public57.4%Shareholder breakdownJaccar24.7%Geographic breakdownMach-Invest andMach-InvestInternational7.7%Monnoyeur5.3%Treasury stockEmployees 4%0,9%France Benelux EnglandSwitzerland US O<strong>the</strong>r32
ConclusionUnder unfavorable market conditionsBOURBON is pursuing its stong growth, securing <strong>the</strong>financing of its invesments and proving Resilient financial performance Uniquely positioned strategy High potential with expected market upturn33
ACTIVITIESGaël BODENESExecutive Vice-President and Chief Operating Officer34
Key factors 2010Safety performanceSafety is every ones’priority2.212.282.00 Objective 2011LTIR 0.00TRIR 0.701.141.121.000.750.260.220.650,640.640.07 0.052006 2007 2008 2009 2010TRIR Objective by yearTRIR: total recordable incidents per one million hours worked, based on 24 hours/dayLTIR: total recordable accidents with work stoppage per one million hours worked, based on 24 hours/day35
Key factors 2010Change in workforce 8,350 persons as of 12/31/2010 1,550 new employees incorporated in 201070 nationalitiesEurope36%Asie + Océanie14%Afrique34%Amérique16%Breakdown by activity86%Crewboats 34%Shallow water Offshore30% 81 % seagoing personnel 19% onshore personnelDeep water Offshore36% 11%3%Marine Services Subsea Services Divers36
Key factors 2010Change in portfolioOTHERS40,5%MARINENATIONALE3,8%3,8%4,2%5,0%SAIPEMSHELLPETROBRASSurinameBrazilTanzaniaIndonesia5,0%5,3%8,1%CHEVRONBPSouthAfricaAustralia24,3%EXXONTOTALNew operating subsidiariesNew Subsea Services operating regionsNew Marine Services operating regions37
Key factors 2010Change in <strong>the</strong> fleetDelivery of 61 vessels in 2010<strong>Bourbon</strong> Gulf Star in Qatar2010 deliveriesIn number ofvesselsDeep water Offshore 2Shallow water offshore 26Crewboats 30Total Marine services 58Total Subsea Services 3Surfer 18000 for pour Congo le Congo Low exposure in deepwater offshore Strong growth in Shallow offshore38
Key factors 2010Position of <strong>the</strong> fleet as of Dec 31, 2010North Sea: 8 vesselsFrance : 8 vesselsAmerican continent53 vessels MediterraneanMiddle East- India23 vesselsWest Africa290 vesselsSouth East Asia25 vessels39
Key factors 2010Fleet as of December 31, 2010OperatingvesselsAverage ageVessels onorderTOTALTotal Marine Services 390 5,4 78 468Deepwater offshorevesselsShallow water offshorevessels69 6,6 7 7678 4,1 48 126Crewboats vessels 243 5,6 23 266Total Subsea Services 17 4 10 27TOTAL Fleet 407 5,4 88 495ROV 13 3,5 1 1440
ActivityCommercial development Examples of new Marine Services contracts :Abeille <strong>Bourbon</strong>- Egypt : 2 PSV on middle-term (Hess)- Malaysia : 2 PSV on long-term (BHP)- Gabon : 2 <strong>Bourbon</strong> Liberty on long-term (Perenco)- Angola : 2 PSV on long-term (Total)- Turkey : 3 PSV on long-term (Exxon)- Assistance and salvage: 8 assistance operations conducted Examples of new Subsea Services contracts :- Australia (Asia area) : <strong>Bourbon</strong> Oceanteam 104 on long-term (TS Marine)- Saudi Arabia: <strong>Bourbon</strong> Supporter on long-term (Argas)- North Sea: <strong>Bourbon</strong> Enterprise on long-term (Fluor)<strong>Bourbon</strong> Oceanteam 10441
ActivityKey data 2010ArtabazeMarine ServicesDeep waterOffshoreShallow wateroffshoreCrewboatsSubseaServicesNumber of vessels 69 78 243 17Utilization rate 90.3% 73.2% 78.2% 88.5%Average dayrates $ 19,370 $ 12,397 $ 4,073 $ 32,589Availability rate 96.5% 93.6% 91.5% 91.9%42
A good utilization rate in a competitive marketDeepwater offshore segmentUtilization rates and average dayratesUtilization ratein %1009080706050403020100Utilization rateAverage dayrates (in $)2009 2010Q1 Q2 Q3 Q4 Q1 Q2 Q3 Q4Average dayratesin $220002000018000160001400012000 2 vessels delivered in 2010: low exposure Repositioning of 7 vessels in H2 2010 A segment characterized by oversupply capacity(mainly for AHTS), <strong>the</strong> strategy is to maximizeutilization rate while optimizing ratesH1 2010 H2 2010Utilization rate 90.7% 89.5%Average dayrates $ 19,725 $ 18,93543
Shallow water offshore segmentUtilization rates and average dayratesA stabilized utilization rate in a challenging marketUtilization ratein %100806040200Utilization rateAverage dayrates (in $)2009 2010Q1 Q2 Q3 Q4 Q1 Q2 Q3 Q4Average dayratesin $140001350013000125001200011500110001050010000 26 vessels delivered in 2010: 50% of <strong>the</strong> growth of<strong>the</strong> shallow water fleet Utilization rate has been affected by vesselsmobilization In a replacement market, <strong>the</strong> approach is to givepriority to < 1 year contracts until rates improveH1 2010 H2 2010Utilization rate 74.0% 72.7%Average dayrates $ 12,488 $ 12,33244
Activity improvement during <strong>the</strong> 4th quarter 2010Crewboats segmentUtilization rates and average dayratesUtilization ratein %1009080706050403020100Utilization rateAverage dayrates (in $)2009 2010Q1 Q2 Q3 Q4 Q1 Q2 Q3 Q4Average dayratesin $60005000400030002000 BOURBON: 30 crewboats delivered in 2010 The target is to improve utilization rates whilemaintaining ratesH1 2010 H2 2010Utilization rate 77.3% 79.1%Average dayrates $ 4,079 $4,07045
Good performance of <strong>the</strong> activitySubsea Services segmentUtilization rates and average dayratesUtilization ratein %1009080706050403020100Utilization rateAverage dayrates (in $)2009 2010Q1 Q2 Q3 Q4 Q1 Q2 Q3 Q4Average dayratesin $40000350003000025000200001500010000 3 vessels delivered in 2010 The objective is to prioritize utilization rates andintegrated services by developing new geographicalareasH1 2010 H2 2010Utilization rate 85.4% 91.3%Average dayrates $ 33,328 $ 31,96146
BOURBON ActivityOperational strategy Low exposure in <strong>the</strong> deepwater offshore segment: 2 vessels delivered in acompetitive market Shallow water offshore market demand for newer vessels contributed to <strong>the</strong>success of <strong>the</strong> Liberty vessels Subsea activity development: new geographical areas and reinforcement ofsupport activity for contractors The high quality services provided to customers ensure good crewboat segmentdevelopment in competition with helicopters Today's objective is to focus on and manage contract duration in order to befully prepared for when day-rates improve again.47
Key developmentsMarket, 2 nd Half ,2010 and trendsAfricaNorth SeaSlight slowdown in <strong>the</strong> deepwater market but bid tenders activity picks up substantially atyear endShallow water activity driven by <strong>the</strong> demand from contractors (maintenance andinstallation of new fields)Vessels overcapacity persists in 2010. Activity should recovered during 2011 Spring.MediterraneanMiddle-East/IndiaMed: Steady activity. Drilling activity starts in <strong>the</strong> Black Sea, and deepwater offshoreactivity in <strong>the</strong> Red SeaIndia: Steady activity with a recovery of construction / maintenance activityMiddle East: activity picks upAmericanContinentUS GOM: activity decreased dramatically after Macondo field salvageBrazil: good activity allows US GOM and North Sea to keep balanceMexico: Start-up of deepwater offshoreAsiaGrowth in deepwater offshore, particularly in Australia, Indonesia and MalaysiaAcceleration in <strong>the</strong> replacement rate of old shallow water vessels48
Deepwater Offshore demandContracted rigs increase in exploration / developmentDriversDeepwater drilling rigs30020092010 2011250In number of rigs200150100500Q1 Q2 Q3 Q4 Q1 Q2 Q3 Q4 Q1 Q2 Q3 Q4Drilling rigs 12/31/2010Existing 253Under contract 221Under construction 57*Average quarterly growth of platforms under contract in%Source: ODS PetrodataUtilization rate Q4 2010 83%49
Steady growth in production activitiesDeepwater offshore demandDriversFloating units in operation (FPSO)600500Number of units40030020010002009 2010 2011 2012 2013 2014 2015Surface units 12/31/2010Existing 332Source : Infield / BOURBON January 2011Under construction 14050
Growth recovers in exploration / developmentShallow water offshore demandDriversShallow water drilling rigs under contract5002009 2010 2011400Number of rigs3002001000Drilling rigs12/31/2010Existing 471Under contract 331Under construction 47*Average quarterly growth of platforms under contracts in %Source: ODS PetrodataUtilization rate in Q4 2010 64%51
Subsea demandDriversSustained growth for Subsea activitySubsea well headsInstallationsSubsea well headsMaintenance50060004005000Well heads > 10 years300200400030002000100100000Well heads:- under service in 2010: 4002- to install by 2015: 1814Source : Infield, February201145% growth by 2015of well heads over 10 years oldSource : Infield, February201152
Deepwater offshore OfferBOURBON investment strategy in line with <strong>the</strong> marketGlobal FleetNumber of vess els delivered180160140120100806040200Future deliveries2008 2009 2010 2011 2012 2013+Of which11% > 25years oldGlobal fleet:1,403 vessels263 onorderCurrent fleet1,140BOURBON deliveriesPSV > 2 000 DWTAHTS > 10 000 BHPSource : ODS Petrodata / BOURBON March 2011 Growing market 263 vessels on order including 60 PSV ordered in 2010 Strong delivery until 2012 Beginning 2011, BOURBON orders12 deepwater PSV: first one to be delivered by 201353
Shallow water offshore offerInvestment strategy confirmed in replacement vesselsGlobal FleetNumber of vessels delivered18016014012010080604020Future deliveriesGlobal fleet:1,774 vesselsOf which 43%> 25 yearsold168on orderCurrent fleet1,606 vessels02008 2009 2010 2011 2012 2013BOURBON deliveriesPSV < 2 000 DWTAHTS < 10 000 BHPSource : ODS Petrodata / BOURBON March 2011 The demand for more reliable high-performance vessels is growing, driving <strong>the</strong> trendtowards replacing old vessels 43% of <strong>the</strong> existing fleet is more than 25 years old Few vessels on order Mid-2010 BOURBON orders: 20 Liberty AHTS 300 – 10 Liberty PSV 100 L54
OUTLOOK The investment announced by Oil companies is creating a favorablemomentum:- Deepwater offshore: growth in investments of more than 11 % in 2011- Shallow water offshore: growing trends towards replacement- Subsea: deepwater offshore production increase and ageing of existingsubsea equipment BOURBON focus on offshore oil and gas services is now a realitythrough:- an active operational management per segment- a managed investment strategy per segment and timely55
Organised to deliverChristian LEFÈVREChief Executive Officer56
Validated strategy In 2010, our utilization rates withstood a stress case: a troublesomemarket burdened with an overcapacity of vessels. This validatesBOURBON’s strategy:– Clients have become are more demanding,showing a preference for modern and highperformancevessels. This means a fasterreplacement rate.– The unique specifications of <strong>the</strong> <strong>Bourbon</strong>Liberty vessels (diesel electric– DP2) arenow in demand.– BOURBON has little exposure to <strong>the</strong> largeAHTS market.Modern vesselOld vessel57
BOURBON 2015 Leadership Strategy By 2015, a full range of 600 innovative and high-performancevessels for exacting clients worldwide 17% growth in Offshore from 2011 to 2015, by additional capitalinvestment of $2 billion in new vessels Increase from 8,500 to 12,000 employees, all determined toensure optimal safety of operations Improve profitability by 2015:− A fleet availability rate rising to 95 %− A target operating cost reduction of 4% at constant rates (excludinginflation)58
The chain of client satisfactionA structure comprising 7 profit centersNORTH SEAGULF OFMEXICOMEDITERRANEANMIDDLE EAST INDIASOUTHEAST ASIA 6 regions Subsea ActivityBRAZILWEST AFRICA59
The chain of client satisfactionLocal: ship centricLOGISTICMANAGERDirect client-vessel relationshipProvides localservices to vesselCONTRACTMANAGERManages <strong>the</strong>contractSinglecontact pointCLIENTOPERATIONMANAGERPriorityManages <strong>the</strong>vessel 34 Contract Managers each managing an average of 6 vessels 20 Operations Managers each managing an average of 9 vessels60
<strong>Bourbon</strong> 2015Operational StrategyOperational safetyAligning our operational procedures with <strong>the</strong> newvessel/crew/shipowner assessment system put in place byclientsOCIMF (Offshore Companies International Marine Forum):81 members to dateQualification ofcrewsRigorous management of crew competencesIndividualized training programsRegional inventories of full equipmentsAvailability of vesselsStreng<strong>the</strong>n onshore support teamsInnovative maintenance by « plug and play »Cost reductionMake <strong>the</strong> benefits of standardisation systematic:- Training & MaintenanceAction plan to reduce fuel consumption, in partnership with ourclients61
Operational SafetySafety of client personnel:– 2,065,119 persons transported in 2010– 1 accident with work stoppage (LTI) during transfervessel/plaftorm Safety of BOURBON personnel– Supply vessel – IMR: a mature activity• 18 780 000 hours worked in 2010• 0 accidents with work stoppage (LTI)– Crewboat: a highly exposed activity, small vesselsoperated on <strong>the</strong> open sea, substantial vessel motion• 10 512 000 hours worked in 2010• 2 accidents with work stoppage (LTI)Safety Campaign in progress: objective 0 accidents62
BOURBON AHTS and PSV simulators in Marseille and Singapore (sinceJune 2008)Crew competenceIndividualized training program: SupplyPositionsBOURBONemployeesEmployeestrainedHave receivedtrainingCaptain 380 18047%Chief Officer390 24362%Deck Officer308 17456% In 2010, 76 Officers were qualified in DP (Dynamic Positioning) 137 Engine Officers underwent a training session with our propulsion equipmentsuppliers63
Crew competenceIndividualized training program: Crewboats 8 BOURBON simulators deployed in 2010 (Angola, Brazil, Cameroon,Congo, France, Gabon, Indonesia, Nigeria)PositionBOURBONemployeesPilots trained180 709Crewboats Pilots 29842% of Crewboat Pilots have beentrained on a simulatorCrewboat simulator au CongoCrewboat simulator au Nigeria64
Crew competenceTechnical training of Crewboat EngineersPositionBOURBONemployeesCrewboats180 323EngineersEmployeestrained13742% of Crewboat Engineers havebeen trained in our « BOURBONtraining centers»Technical training center in NigeriaElectricity module↑Air conditioningmodule→Motorization module65
Availability of vessels 2010 availability rateH1 2010: 91.9%2010: 92.8% ⇒ Objective 2015: 95%H2 2010: 93.8% 50% of capital expenditures earmarked for spare propulsion equipment hasbeen invested and deployed to operating regions Technical response teams – 70% <strong>complete</strong> Frame agreements with strategic suppliers <strong>complete</strong>d (propulsion engines,thrusters, cranes, winches, DP)66
Availability of vessels<strong>Bourbon</strong> Liberty 225Replacing <strong>the</strong> thruster↓ →<strong>Bourbon</strong> HermèsMaintenance: « plug and play »← ↓67
Cost reductionStandardization of <strong>the</strong> fleet ⇒ 4 big series of supply vesselsSeriesNumber Deep offshore PSVDiesel-electricDPII18 + 12 =30GPA 670SPP 35 Shallow offshore AHTS 54 + 20 =74Diesel-electricDPII<strong>Bourbon</strong> Liberty 200<strong>Bourbon</strong> Liberty 300 Shallow offshore PSVDiesel-electricDPII22 +10 =32<strong>Bourbon</strong> Liberty 100<strong>Bourbon</strong> Liberty 100L Maxi UtilityDiesel-electricDPII20<strong>Bourbon</strong> Liberty 01068
Cost reductionRegional crews = Competitive service BOURBON invests in <strong>the</strong> training of regional crews.External and internal training programs (Reference Captains, Supervisors, ChiefEngineers)– 33 % crewboats 100% operated by regional crews– 39 % Supply vessels (AHTS & PSV) 100% operated by regional crewsIndonesian crew of <strong>the</strong> Surfer 1845Nigerian crew of <strong>the</strong><strong>Bourbon</strong> LedaNorwegian crew of <strong>the</strong> <strong>Bourbon</strong> Surf69
Cost reductionRegional crews = Competitive serviceInternational crew of <strong>the</strong><strong>Bourbon</strong> Trieste – IMR supplyInternational crew of <strong>the</strong> AHTS LuzoloAnchor operation in AngolaThai crew of <strong>the</strong> <strong>Bourbon</strong> MorrakotAHTS from <strong>the</strong> serie <strong>Bourbon</strong> LibertyFrench crew of <strong>the</strong> Argonauteantipollution vessel70
Cost reductioncoûtsObjective 2010-2015: lower operating costs by 4% at constant ratesCrewsAttestation of <strong>the</strong> results by <strong>the</strong> Statutory Auditors, calculatedon <strong>the</strong> following basis: Vessel fleet on a like-for-like basis Direct operating costs (index base 100 in 2010)Maintenance Adjusted by weighted inflationO<strong>the</strong>r71
Global consumption of oil and gas will increase, driven by China and India The decline in output from existing fields is realOutlook for 2011Favorable momentum in <strong>the</strong> oil and gasactivity Drilling new wells is <strong>the</strong> only economical solution for replacing offshorereserves The oil companies have announced <strong>the</strong>y are stepping up explorationprograms starting in 2011 Offshore drilling is done at greater depths, and <strong>the</strong> wells <strong>the</strong>mselves aredeeper, which is beneficial for <strong>the</strong> marine services sector More and more subsea fields are being developed, generating needs forinspection, maintenance and repair72
Outlook for 2011BOURBON has <strong>the</strong> right structure to deliverOperational Safety Our operational strategy is clear and isvalidated by our clientsQualification ofcrewsVessel availability The organization and <strong>the</strong> processes neededto improve performance are in place Progress is already evidentCost reduction73
Outlook for 2011In 2011, BOURBON, which now focuses on offshore oil and gasservices, will be favorably affected by: The growth of <strong>the</strong> fleet: 451 vessels at year-end 2011 The increase in utilization rates (already evident in January andFebruary 2011) The gradual increase in charter rates in <strong>the</strong> second half of 2011(anticipating <strong>the</strong> market)74
Appendices75
Simplified balance sheetDecember 31, 2010In millions of eurosDec 31,2010Dec. 31,2009Dec 31,2010Dec 31,2009ASSETSLIABILITIESShareholders’s equity 1.468 1.487Net property, plant and equipment 3.077 3.096 Financial debt > 1 year 1.504 1.450O<strong>the</strong>r non-current assets 81 78 O<strong>the</strong>r non-current liabilities 96 63TOTAL NON-CURRENT ASSETS 3.158 3.174TOTAL NON-CURRENTLIABILITIES1.600 1.513O<strong>the</strong>r current assets 423 435 Financial debt < 1 year 472 453Cash and cash equivalents 210 153 O<strong>the</strong>r current liabilities 266 309TOTAL CURRENT ASSETS 633 588 TOTAL CURRENT LIABILITIES 738 762Non-current assets held for sale 15 - Liabilities on non-current assetsheld for sale- -TOTAL ASSETS 3.806 3.7 62 TOTAL LIABILITIES 3.806 3.762Net debt* 1.765Capital employed 3.252*incl companies treated under IFRS576
Expected deliveriesNumber of vesselsValue €m (excl.financial expense)DeliveriesH1 2011DeliveriesH2 2011Deliveries2012Deliveries2013 2015TOTALDeep wateroffshorevessels2€ 47m2€ 66m2€ 48m1€ 14m7€ 175mShallow wateroffshorevessels10€ 112m8€ 89m24€ 342m6€ 83m48€ 626mCrew boatsvessels15€ 37m5€10m3€ 6m--23€ 53m114410IMR vessels€ 46m€ 46m€ 184m€ 184m€ 460m2816331188€ 242m€ 211m€ 580m€ 281m€ 1 314m77
<strong>Bourbon</strong>Contractualisation as of 12/31/2010ContractualisationrateAverage residualterm of firmcontractsAverage residualterm includingoptionsDeepwater offshore fleet 78.3% 16.7 months 28.9 monthsShallow water offshore fleet 61.5% 11.9 months 16.6 monthsCrewboats fleet 72.4% Na NaSubsea fleet 76.5% 15.2 months 24.7 months78
ActivityKey data 2010ArtabazeDeepwaterOffshoreMarine ServicesShallow waterOffshorePer Half YearCrewboatsSubseaServicesPer Half YearH2 H1 H2 H1 H2 H1 H2 H1Number of vessels 69 64 78 67 243 237 17 15Utilization rate 89.5% 90.7% 72.7% 74.0% 79.1% 77.3% 91.3% 85.4%Average dayrates $ 18,935 $ 19,725 $ 12,332 $ 12,488 $ 4,070 $ 4,079 $ 31,961 $ 33,328Availability rate 97.1% 95.9% 93.4% 93.9% 92.6% 90.4% 94.9% 88.6%79
DisclaimerThis document may contain information o<strong>the</strong>r than historical information,which constitutes estimated, provisional data concerning <strong>the</strong> financialposition, results and strategy of BOURBON. These projections are basedon assumptions that may prove to be incorrect and depend on risk factorsincluding, but not limited to: foreign exchange fluctuations, fluctuations inoil and natural gas prices, changes in oil companies investment policiesin <strong>the</strong> exploration and production sector, <strong>the</strong> growth in competing fleets,which saturates <strong>the</strong> market, <strong>the</strong> impossibility of predicting specific clientdemands, political instability in certain activity zones, ecologicalconsiderations and general economic conditions.BOURBON assumes no liability for updating <strong>the</strong> provisional informationbased on new information in light of future events or any o<strong>the</strong>r reason.80