
You also want an ePaper? Increase the reach of your titles
YUMPU automatically turns print PDFs into web optimized ePapers that Google loves.
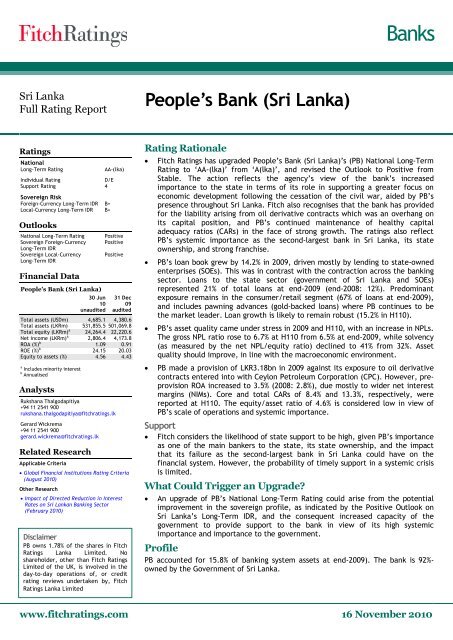
<strong>Bank</strong>sSri LankaFull <strong>Rating</strong> ReportPeople’s <strong>Bank</strong> (Sri Lanka)<strong>Rating</strong>sNationalLong‐Term <strong>Rating</strong>AA‐(lka)Individual <strong>Rating</strong>D/ESupport <strong>Rating</strong> 4Sovereign RiskForeign‐Currency Long‐Term IDR B+Local‐Currency Long‐Term IDR B+OutlooksNational Long‐Term <strong>Rating</strong>Sovereign Foreign‐CurrencyLongTerm IDRSovereign Local‐CurrencyLongTerm IDRFinancial DataPeople’s <strong>Bank</strong> (Sri Lanka)30 Jun10unauditedPositivePositivePositive31 Dec09auditedTotal assets (USDm) 4,685.1 4,380.6Total assets (LKRm) 531,855.5 501,069.8Total equity (LKRm) a 24,264.4 22,220.6Net income (LKRm) a 2,806.4 4,173.8ROA (%) b 1.09 0.91ROE (%) b 24.15 20.03Equity to assets (%) 4.56 4.43aIncludes minority interestbAnnualisedAnalystsRukshana Thalgodapitiya+94 11 2541 900rukshana.thalgodapitiya@fitchratings.lkGerard Wickrema+94 11 2541 900gerard.wickrema@fitchratings.lkRelated ResearchApplicable Criteria· Global Financial Institutions <strong>Rating</strong> Criteria(August 2010)Other Research· Impact of Directed Reduction in InterestRates on Sri Lankan <strong>Bank</strong>ing Sector(February 2010)DisclaimerPB owns 1.78% of the shares in <strong>Fitch</strong><strong>Rating</strong>s Lanka Limited. Noshareholder, other than <strong>Fitch</strong> <strong>Rating</strong>sLimited of the UK, is involved in theday‐to‐day operations of, or creditrating reviews undertaken by, <strong>Fitch</strong><strong>Rating</strong>s Lanka Limited<strong>Rating</strong> Rationale· <strong>Fitch</strong> <strong>Rating</strong>s has upgraded People’s <strong>Bank</strong> (Sri Lanka)’s (PB) National Long‐Term<strong>Rating</strong> to ‘AA‐(lka)’ from ‘A(lka)’, and revised the Outlook to Positive fromStable. The action reflects the agency’s view of the bank’s increasedimportance to the state in terms of its role in supporting a greater focus oneconomic development following the cessation of the civil war, aided by PB’spresence throughout Sri Lanka. <strong>Fitch</strong> also recognises that the bank has providedfor the liability arising from oil derivative contracts which was an overhang onits capital position, and PB’s continued maintenance of healthy capitaladequacy ratios (CARs) in the face of strong growth. The ratings also reflectPB’s systemic importance as the second‐largest bank in Sri Lanka, its stateownership, and strong franchise.· PB’s loan book grew by 14.2% in 2009, driven mostly by lending to state‐ownedenterprises (SOEs). This was in contrast with the contraction across the bankingsector. Loans to the state sector (government of Sri Lanka and SOEs)represented 21% of total loans at end‐2009 (end‐2008: 12%). Predominantexposure remains in the consumer/retail segment (67% of loans at end‐2009),and includes pawning advances (gold‐backed loans) where PB continues to bethe market leader. Loan growth is likely to remain robust (15.2% in H110).· PB’s asset quality came under stress in 2009 and H110, with an increase in NPLs.The gross NPL ratio rose to 6.7% at H110 from 6.5% at end‐2009, while solvency(as measured by the net NPL/equity ratio) declined to 41% from 32%. Assetquality should improve, in line with the macroeconomic environment.· PB made a provision of LKR3.18bn in 2009 against its exposure to oil derivativecontracts entered into with Ceylon Petroleum Corporation (CPC). However, preprovisionROA increased to 3.5% (2008: 2.8%), due mostly to wider net interestmargins (NIMs). Core and total CARs of 8.4% and 13.3%, respectively, werereported at H110. The equity/asset ratio of 4.6% is considered low in view ofPB’s scale of operations and systemic importance.Support· <strong>Fitch</strong> considers the likelihood of state support to be high, given PB’s importanceas one of the main bankers to the state, its state ownership, and the impactthat its failure as the second‐largest bank in Sri Lanka could have on thefinancial system. However, the probability of timely support in a systemic crisisis limited.What Could Trigger an Upgrade?· An upgrade of PB’s National Long‐Term <strong>Rating</strong> could arise from the potentialimprovement in the sovereign profile, as indicated by the Positive Outlook onSri Lanka’s Long‐Term IDR, and the consequent increased capacity of thegovernment to provide support to the bank in view of its high systemicimportance and importance to the government.ProfilePB accounted for 15.8% of banking system assets at end‐2009). The bank is 92%‐owned by the Government of Sri Lanka.www.fitchratings.com 16 November 2010
<strong>Bank</strong>s· Sri Lanka’s second‐largestlicensed commercial bank· Market leader in pawningProfilePB was established under an Act of Parliament in 1961 to develop the co‐operativemovement of Sri Lanka and enhance rural banking. The bank is 92.27%‐state‐ownedand 7.73% by co‐operative societies. The board comprises nine non‐executivemembers appointed by the Minister of Finance as per the People’s <strong>Bank</strong> Act.PB accounted for 15.8% of Sri Lanka’s banking system assets at end‐2009. The bankhas a broad national footprint, with 329 branches and 341 outlets at end‐2009,which has fostered a stable deposit base.Table 1: Market Share(As of end‐2009) PB BOC CBLCB assets (%) 19 22 13LCB loans (%) 22 20 13LCB deposits (%) 21 22 13BOC – <strong>Bank</strong> of Ceylon, CB ‐ Commercial <strong>Bank</strong>of Ceylon PlcSource: PB, BOC, CB, Central <strong>Bank</strong> ofSri Lanka, <strong>Fitch</strong>Loans to the state sector comprised 14% of assets at end‐2009 (end‐2008: 8.3%). PBalso has exposure to government securities comprising 18.6% of assets, in the formof treasury bills and bonds (13.7%), US dollar‐denominated Sri Lanka developmentbonds (3.3%), and government restructuring bonds (1.6%).PB remains the market leader in pawning advances (gold‐backed loans), whichaccounted for 29% of loans at end‐2009. While private sector banks haveaggressively moved into pawning in recent years, PB still retains its dominantmarket share, accounting for 49% of banking sector pawning advances at end‐2009(end‐2008: 53%).Pawning advances usually carry a maturity of one year, are zero risk‐weighted incalculating capital adequacy, and afford relatively high yields. Pawning advancesgranted by PB are used mostly for working capital finance in sectors such asagriculture and fisheries.Share of Pawning AdvancesPawning AdvancesLarge privatesector LCBs22%Other largestate banks27%Other2%PB49%(LKRm)100,00075,00050,00025,00002005 2006 2007 2008 2009Source: <strong>Bank</strong>s, CBSL, <strong>Fitch</strong>Source: PBPB’s equity was severely depleted in 1999 as a result of a LKR6.7bn provisionagainst NPLs. The state as shareholder did not initially infuse fresh capital, butinstead provided a written undertaking in the form of a Letter of Comfort toprovide financial support to the extent that the bank meets the minimumregulatory CAR of 10%. Substantially improved operating results since then enabledPB to record a positive equity position in 2004.Table 2: Capital Infusionsand DividendsCapitalinfusionsDividends(special levy)2005 2,000 1502006 1,000 6002007 1,500 7002008 1,500 1,000Source: PB, <strong>Fitch</strong>A recapitalisation programme backed by a conditional credit line from the AsianDevelopment <strong>Bank</strong> (ADB, ‘AAA’/Stable) — which was to be implemented in fourstages by 2008 — brought in capital of LKR2.0bn in 2005. However, in 2006, thegovernment was compelled to fund the second tranche of LKR1.0bn on its own,since it did not meet the financial sector reforms and other conditions stipulated bythe ADB. Thereafter, the Ministry of Finance and Planning (MOF) committed itselfto an independent capital injection plan, and contributed two instalments ofLKR1.5bn each in 2007 and 2008 which helped the bank achieve the minimum CARsby end‐2008.The PB group includes two fully‐owned subsidiaries. One is People’s LeasingCompany Ltd (PLC, ‘A(lka)’/Stable), which is Sri Lanka’s second‐largest specialisedPeople’s <strong>Bank</strong> (Sri Lanka)November 20102
<strong>Bank</strong>sleasing company (SLC) and carries out most of the leasing business for the group. In2009, PLC acquired 97% of Seylan Merchant Leasing PLC (renamed as People’sLeasing Finance PLC (‘BBB‐(lka)’/Stable)), a registered finance company (RFC),which belonged to the distressed Ceylinco group of companies and incorporated awholly‐owned subsidiary engaged in the provision of general insurance. PLC wasalso appointed as the managing agent of another distressed RFC by the Central <strong>Bank</strong>of Sri Lanka.In the same year, PB’s 39%‐held associate, People’s Merchant <strong>Bank</strong> PLC (PMB,‘BB+(lka)’/Negative), a small SLC, acquired the business operations and selectedassets and liabilities of ABC Credit Card company Ltd, an unregulated company thatissued credit cards and accepted deposits (renamed as PMB Credit Card CompanyLtd), and a small RFC, Silvereen Finance Company Ltd (renamed as People’sMerchant Finance Company Limited). PB’s subsidiaries and associates represented8.7% of group assets at end‐2009.PB was exposed to a significant liability under oil derivative contracts entered intowith CPC following the ruling of the Supreme Court of Sri Lanka in November 2008suspending payments due from CPC to five banks (including PB). In 2009, the bankmade a provision of LKR3.18bn against its exposure under these contracts.· PB experienced strongloan growth comparedwith the sector· Pre‐provision ROAsupported by wide NIMsPerformanceMost Sri Lankan banks have experienced a contraction in loans on account ofdecreased credit demand reflected in negative private sector credit growth.However, PB’s loan book grew by 14.2% in 2009, driven predominantly by lending toSOEs. Consequently, loans accounted for about 65% of assets at end‐2009 comparedwith 56% for the sector. PB continued to maintain strong loan growth of 15.2% inH110, exceeding its target for 2010, although management indicates that the paceof loan growth will be managed within the constraints of capital adequacy.Historically, PB’s profitability has been constrained by high operating costs despitewide NIMs. Profitability in terms of ROA increased to 0.9% in 2009 from 0.8% in 2008due to a reduction in effective taxes (65% of pre‐tax profit in 2008; 62% in 2009).ROA at the pre‐provisioning level increased to 3.5% in 2009 from 2.8% in 2008,primarily due to wider NIMs. The contribution from the leasing segment to PB’sconsolidated net income remained substantial at 26% of net income in 2009 (2008:24%). ROA improved to 1.1% in H110 on account of lower operating and provisioningcosts. Profitability could improve should better operating efficiency continue — aswell as through expected reductions in credit costs.Net Interest RevenueNet interest income increased by 27% in 2009 to LKR27bn, supported by high loangrowth and wider NIMs of 6.6% in 2009 (5.9% in 2008). PB’s yields have historicallybeen higher than that of the sector, buoyed by high exposure to relatively highyieldingproducts.CreditCredit to private sectorCredit to government(LKRbn)1,5001,0005000Mar 09 Jul 09 Nov 09 Mar 10 Jul 10Source: CBSLIn October 2009, the government issued a directive instructing state banks toreduce interest rates offered on loans to certain specified sectors. While PB’s NIMscame down to 6.3% (annualised) in H110, this was cushioned to a large extent bythe reduction in the cost of funds through the downward revision of deposit rates.Continued high exposure to higher‐yielding products and segments is expected tomoderate the impact of increased competition on NIMs as the level of lending risesin the banking sector as a whole.Non‐Interest RevenueNon‐interest revenue increased by 21% in 2009, driven by increased income fromthe recoveries and provision reversals (20% of non‐interest income), capital gains onthe government securities portfolio (10%), and increased foreign exchange incomePeople’s <strong>Bank</strong> (Sri Lanka)November 20103
<strong>Bank</strong>sTable 3: Key Indicators for PB and PeersPBBOC(AA(lka)/Positive)CB(AA(lka)/Stable)HNB(AA‐(lka)/Stable)Sampath(AA‐(lka)/Positive)(LKRm) H110 2009 H110 2009 H110 2009 H110 2009 H110 2009Total assets 531,855 501,070 606,769 547,421 338,172 322,545 295,179 287,511 171,940 158,002Loans and advances 373,044 323,769 350,053 283,298 179,843 176,742 175,768 172,800 104,990 98,914Deposits 423,174 396,228 434,889 411,460 242,241 234,731 216,369 213,819 139,689 125,974Borrowings 54,734 58,139 124,855 87,849 51,648 44,848 22,931 20,651 11,865 12,352Equity 24,264 22,221 27,793 27,534 30,114 28,721 27,179 26,374 13,483 12,612Net income 2,806 4,174 2,410 3,300 2,313 4,192 1,870 4,483 1,344 2,072(%)Net interest margin 6.3 6.6 3.5 3.4 4.8 4.5 5.9 6.1 5.8 5.8Return on assets 1.1 0.9 0.9 0.6 1.4 1.4 1.3 1.7 1.6 1.4Cost/income 49.7 53.6 56.9 64.1 46.4 45.7 61.4 56.9 48.4 45.9Operating costs/average assets 3.4 4.0 3.0 3.3 2.8 3.0 4.6 4.4 3.7 3.7Tier 1 CAR 8.4 8.9 10.9 12.0 11.6 11.9 10.1 10.9 11.1 10.6Equity/assets 4.6 4.4 4.6 5.0 8.9 8.9 9.4 9.3 7.9 8.0Net NPL/equity 40.9 32.1 29.9 26.4 28.6 28.6 24.9 22.8 17.7 26.0Loan loss reserves/NPLs 53.4 60.7 47.4 52.1 27.6 28.5 37.4 40.6 65.1 54.8NPL/gross loans 6.7 6.5 5.0 5.7 7.0 6.9 6.6 6.2 6.9 7.8BOC – <strong>Bank</strong> of Ceylon, CB‐ Commercial <strong>Bank</strong> of Ceylon PLC, HNB ‐ Hatton National <strong>Bank</strong> PLC, Sampath ‐ Sampath <strong>Bank</strong> PLCSource: Published financials, <strong>Fitch</strong>(16%). However, the main source of non‐interest income has been fee andcommission income which accounted for 45% of non‐interest income in 2009. <strong>Fitch</strong>expects non‐interest income to increase with increased trade activity in animproving macro environment.Operating ExpensesPB’s cost structure remained high in 2009, reflected in a cost/income ratio of 53.6%(57.5% in 2008) and operating costs/average assets of 4% (3.8% in 2008). Operatingcosts (excluding provisions) increased by 17% in 2009, led by higher personnel costs— due largely to the revision of salaries in line with the three‐year collectiveagreement with employee unions.Personnel expenses are PB’s largest operational expense, and accounted for 69% oftotal operating expenses in 2009. The bank has a defined‐benefit pension schemefor permanent employees who joined before 1996; pensionable staff accounted for66% of total staff in the permanent cadre at end‐2009. The latest actuarialvaluation carried in January 2009 indicated a surplus of LKR3.7bn in the pensionfund on a discontinuance basis.PB’s contribution to the pension fund accounted for 14% of personnel costs and 10%of total costs in 2009. The bank also plans to initiate a new pension scheme forpermanent employees who joined the bank from 1996 — subject to the necessaryapprovals and the finalisation of other details pertaining to the administration ofthe fund.The reduction in the number of permanent staff through natural attrition (giventheir age profile together with the increased employment of contract andoutsourced staff) is expected to contribute to the reduction of operating costs. PB’scost/income ratio and operating costs/average assets improved to 49.7% and 3.4%,respectively, in H110.· Predominant exposureremains in theconsumer/retail segment,and includes significantexposure to pawning· Decline in asset qualityand solvencyRisk ManagementThe board is responsible for setting PB’s risk management policies. The banksegregated risk management as a function in 2007 and appointed a Senior DeputyGeneral Manager to head it.People’s <strong>Bank</strong> (Sri Lanka)November 20104
<strong>Bank</strong>sCredit RiskThe credit policy of PB is formulated and reviewed by the Board Executive CreditCommittee, and credit approval is structured according to hierarchical delegatedauthority limits. The bank has an independent credit controller to strengthenevaluation as well as monitoring. PB recently introduced a watch list for earlyidentification of potential delinquenciesLoan Book DevelopmentPB’s exposure remains predominantly to the consumer/retail segment, whichaccounted for about two thirds of the loan book at end‐2009. Pawning advancescomprised 43% of this exposure (and 29% of loans). Management indicates thepawning portfolio is highly granular, and that a general provision (of about 0.5%) ismaintained on the pawning portfolio.The majority of pawning advances are used for working capital, with a limitedproportion used for consumption. Leasing (vehicle finance) carried out largelythrough subsidiary PLC comprised 17% of the consumer/retail exposure (and 11% ofloans), and housing a further 11% (7% of loans).Loans to the state sector increased to 21% at end‐2009 from 12% at end‐2008,driven largely by growth in lending to SOEs. PB’s exposure to the corporate segmentaccounted for 12%.Credit concentrations remained high, reflecting exposure to state sector entitiesincluding a key SOE. <strong>Fitch</strong> takes comfort from the availability of Treasuryguarantees against some of these exposures, and minimal credit risk in theory.Sector concentration was in agriculture and fishing, which accounted for 26% atend‐2009 and which are identified as growth sectors in the post‐war economy.Indeed, the underlying purpose of the majority of pawning advances is foragriculture and fisheries. Construction accounted for a further 20%, although themajority of this exposure is for housing.Non‐Performing LoansA deterioration in asset quality was experienced by the banking sector in 2008 and2009. PB’s NPLs increased by 11.5% in 2009, although its gross NPL ratio decreasedto 6.5% from 6.7% at end‐2008, due to the increase in the loan base. Corporatesaccounted for a major share of total NPLs, and drove the deterioration in assetquality in 2009 with the gross NPL ratio on the non‐state lending increasing from7.5% at end‐2008 to 8.2%. PB’s gross NPL ratio increased to 6.7% at H110 as NPLscontinued to rise. However, asset quality is expected to improve in Q310 onaccount of an improving economic environment.People’s <strong>Bank</strong> (Sri Lanka)November 20105
<strong>Bank</strong>sTable 4: Classification ofNPLsEnd‐2008End‐2009 H110(%)Special15 18 19mentionSub‐standard 8 14 15Doubtful 4 5 5Loss 72 63 61Total 100 100 100Source: PB, <strong>Fitch</strong>Asset Quality and ProvisionsNPL (LHS) Specific provisions (LHS) Gross NPL ratio (RHS)(LKRm)30201002005 2006 2007 2008 2009 H110Source: PB, <strong>Fitch</strong>(%)151050The age profile of NPLs indicates an increase in the proportion of NPLs in thespecial mention 1 category, while a substantial proportion of NPLs remained in theloss category 2 . Loss category NPLs include hard‐core NPLs acquired prior to 2001,which in turn includes the largest NPL which accounted for 14% of total NPLs andhas been almost fully provided for. About 7% of total NPLs had been restructured atend‐2009.Specific provision coverage of NPLs decreased to 53.4% at H110 from 60.7% at end‐2009 and 66.4% at end‐2008, due to the availability of collateral and an increase inspecial mention NPLs which do not require provisioning. While collateral is available,largely in the form of property mortgages, realisation of collateral is usually atedious process. General provisions are expected to gradually reduce due to therevision in the Central <strong>Bank</strong> of Sri Lanka requirement from 1% of performing loansand special mention NPLs to 0.5% in 2012.PB’s solvency, as indicated by the net NPL/equity ratio, deteriorated to 41% atH110 from 32% at end‐2009 and 28% at end‐2008. While net NPL/equity is weakerthan that of the large ‘AA(lka)’‐rated LCB peers, the ratio is expected to improvewith an anticipated improvement in asset quality.Market RiskPB’s market risk exposure is managed by its treasury, based on the parameters setby the ALCO. PB is in the process of implementing a new treasury managementsystem, to enhance the management of market risk.Interest rate risk arising from structural maturity mismatches is mitigated to a largeextent as the majority of the loan book (with the exception of leases and pawning)is contracted at floating rates, while PB also reserves the right to reprice certainloans contracted at fixed rates. Rate‐sensitive assets covered 69% of rate‐sensitiveliabilities carrying a residual maturity of under one year at end‐2009. While 92% ofdeposits had a residual maturity of up to 12 months, the bank’s deposit base isrelatively stable and subject to a high rate of renewal. Government securities heldto maturity (HTM) accounted for 78% of the total government securities portfolio at1Credit facilities are defined as special mention when three installments or more, but less than sixinstallments of principal and/or interest, are due and unpaid (in the case of facilities repayablein monthly installments)2Credit facilities are defined as loss when 18 installments or more of principal and/or interest aredue and unpaid (in the case of facilities repayable in monthly installments)People’s <strong>Bank</strong> (Sri Lanka)November 2010 6
<strong>Bank</strong>sH110, while the weighted average duration of government securities held fortrading was 3.09 at H110.Foreign currency risk exposure is managed through internal limits and regulatorylimits on the aggregate foreign currency net open position. PB’s foreign currencydenominatedloans are matched by foreign currency deposits, with a foreigncurrency loans/deposits ratio of 41% at end‐2009.The bank is exposed to gold price fluctuations on account of its substantial pawningportfolio. To limit the risk of erosion in the value of collateral through a decline ingold prices, an LTV ratio of 77% on average is maintained on pawning advances.Furthermore, PB regularly monitors gold prices as well as the interest rates andLTVs of competitors.Operational RiskPB has put in place an operational risk management unit in 2008, which comesunder the purview of the Senior Deputy General Manager Risk and Compliance whohas focussed on strengthening processes and controls. The operational riskmanagement unit collects loss events reported by branches and other functionaldepartments on a monthly basis, which is maintained in a database and used toidentify trends.PB’s core banking system interconnects 216 of its 329 branches and 245 of its 341service centres. A target of March 2011 has been set to interconnect all branchesand service centres through the core banking system, thereby improving theavailability of information to support risk management.The bank’s internal audit department, which reports to the audit committee,carries out audits of branches at least once every two years.PB allocated capital for operational risk under the basic indicator approach of BaselII, although management states that the loss experience on account of operationalrisk is considerably lower.· Proportion of demand andsavings deposits hasdecreased· Capital adequacy ratiosremain above theminimumFunding, Liquidity and CapitalDeposits are the predominant source of funding for PB, accounting for 79% offunding at end‐2009. Deposit mobilisation has been supported by the bank’sresilient retail franchise and extensive branch network. PB recorded deposit growthof 6.8% in H110 and strong deposit growth of 22% in 2009 reflecting high depositorconfidence amidst liquidity stress faced by some deposit‐taking institutions.<strong>Fitch</strong> notes that the proportion of demand and savings deposits to total deposits hasbeen gradually declining, and constituted 53.4% of deposits at end‐2009 against 66.6%at end‐2006, but remained above 44% for the LCB sector. Deposits remaineddiversified — the 20 largest deposits accounted for 10% of total deposits at end‐2009.Table 5: Funding ProfileTotal funding (%) End‐2007 End‐2008 End‐2009 H110Deposits 75.8 77.5 79.1 79.6Demand 8.2 6.5 7.3 6.2Savings 36.9 36.2 34.9 34.9Time 29.9 34.4 36.3 37.7Other 0.8 0.4 0.5 0.7Borrowings 15.3 12.2 11.6 10.3Other 4.9 5.6 4.9 5.6Equity 4.0 4.7 4.4 4.6Total 100.0 100.0 100.0 100.0Source: PB, <strong>Fitch</strong>People’s <strong>Bank</strong> (Sri Lanka)November 20107
<strong>Bank</strong>sPB’s liquidity position in terms of the statutory liquidity ratios in both domestic andforeign currencies remained above the required minimum throughout 2009. Due toPB’s strong loan expansion, loans/deposits remained relatively high at 82% at end‐2009 compared with 77% for the sector.Capital Adequacy Ratios(%)<strong>Bank</strong> tier 1 <strong>Bank</strong> total Group tier 1 Group total15129630End‐2007 End‐2008 End‐2009 H110Source: PBSince achieving the minimum core CAR at the bank level at end‐2008, PB continuedto sustain core and total CARs at the bank and group level above the requiredregulatory minimum 5% and 10% throughout 2009. Reported core and total CARswere 8.4% and 13.3%, respectively, at June 2010 and 8.9% and 14% at end‐2009.Tier II capital was boosted by a further issuance of subordinated debentures ofLKR2.5bn in Q409 (the bank issued subordinated debentures of LKR2.5bn in Q408 aswell). The debentures issued in 2008 and 2009 have maturities of eight years, andhence the total amount issued would be considered as Tier II capital in computingCARs until the four years preceding the maturity of the debentures, during whichthe amount considered as Tier II capital would be subject to a progressive discountaccording to CBSL guidelines.The equity/assets ratio of 4.6% at H110 and 4.4% at end‐2009 (4.7% at end‐2008)remained below 7% for the large ‘AA(lka)‐rated LCB peers. <strong>Fitch</strong> considers this levelof absolute capitalisation to be low in view of the bank’s scale of operations andsystemic importance. Internal capital generation is expected to remain constrainedby dividends in the form of a special levy which was maintained at 29% of netincome in 2009.People’s <strong>Bank</strong> (Sri Lanka)November 20108
<strong>Bank</strong>sBalance Sheet AnalysisPeople's <strong>Bank</strong>30‐Jun‐1031‐Dec‐09 31‐Dec‐08 31‐Dec‐07Year End As % of Average Year End As % of Year End As % of Year End As % ofUSDm LKRm Assets LKRm LKRm Assets LKRm Assets LKRm AssetsA. LOANS1. Customer Loans 3291.85 373,689.73 70.26 343,609.65 313,529.58 62.57 273,172.24 65.56 258,520.00 65.202. Other Loans 0.00 0.00 0.00 5,480.34 10,960.68 2.19 11,033.24 2.65 11,145.69 2.813. (Loan Loss Reserves) 153.18 17,389.49 3.27 16,983.16 16,576.83 3.31 15,838.59 3.80 15,301.81 3.864. (Interest in Suspense) 5.69 645.72 0.12 683.31 720.89 0.14 648.84 0.16 520.71 0.13TOTAL A 3132.98 355,654.51 66.87 331,423.52 307,192.54 61.31 267,718.05 64.25 253,843.17 64.02B. OTHER EARNING ASSETS 0.00 0.00 0.00 0.001. Deposits with <strong>Bank</strong>s 182.74 20,744.62 3.90 30,570.22 40,395.83 8.06 6,344.05 1.52 16,294.43 4.112. Treasury Bills 787.38 89,382.73 16.81 91,382.55 93,382.36 18.64 80,821.27 19.40 63,987.00 16.143. Other Securities 13.50 1,532.72 0.29 766.36 0.00 0.00 0.00 0.00 500.00 0.134. Equity Investments 5.02 569.96 0.11 722.37 874.78 0.17 596.80 0.14 703.32 0.18TOTAL B 988.64 112,230.02 21.10 123,441.49 134,652.97 26.87 87,762.12 21.06 81,484.75 20.55C. TOTAL EARNING ASSETS (A+B) 4121.62 467,884.53 87.97 454,865.02 441,845.51 88.18 355,480.17 85.31 335,327.93 84.57D. FIXED ASSETS 77.56 8,804.22 1.66 8,487.28 8,170.34 1.63 8,192.85 1.97 7,864.93 1.98E. NON‐EARNING ASSETS 0.00 0.00 0.00 0.001. Cash and Due from <strong>Bank</strong>s 88.14 10,006.04 1.88 10,499.24 10,992.43 2.19 12,099.99 2.90 12,496.57 3.152. Statutory Deposit with Central <strong>Bank</strong> 227.38 25,811.92 4.85 24,264.48 22,717.03 4.53 18,905.80 4.54 23,606.12 5.953. Other 170.44 19,348.75 3.64 18,346.63 17,344.50 3.46 21,994.94 5.28 17,222.78 4.34TOTAL E 485.97 55,166.71 10.37 53,110.34 51,053.97 10.19 53,000.73 12.72 53,325.47 13.45F. TOTAL ASSETS 4685.14 531,855.46 100.00 516,462.64 501,069.82 100.00 416,673.75 100.00 396,518.33 100.00G. CUSTOMER AND SHORT TERM FUNDING 0.00 0.00 0.00 0.001. Demand Deposits 292.59 33,215.21 6.25 34,977.83 36,740.45 7.33 27,019.74 6.48 32,370.15 8.162. Savings Deposits 1633.82 185,470.53 34.87 180,167.35 174,864.16 34.90 150,871.18 36.21 146,414.43 36.933. Time Deposits 1767.48 200,643.99 37.73 191,261.58 181,879.17 36.30 143,324.52 34.40 118,662.30 29.934. Other 33.86 3,843.97 0.72 3,293.99 2,744.01 0.55 1,818.91 0.44 3,136.63 0.79TOTAL G 3727.76 423,173.70 79.57 409,700.75 396,227.80 79.08 323,034.35 77.53 300,583.50 75.81H. OTHER FUNDING 0.00 0.00 0.00 0.001. Borrowings 430.44 48,863.94 9.19 50,878.53 52,893.12 10.56 48,194.84 11.57 60,636.12 15.292. Subordinated Debt 51.71 5,870.53 1.10 5,558.03 5,245.53 1.05 2,815.00 0.68 110.00 0.033. Hybrid Capital 0.00 0.00 0.00 ‐ 0.00 0.00 0.00 0.00 0.00 0.00TOTAL H 482.16 54,734.47 10.29 56,436.56 58,138.65 11.60 51,009.84 12.24 60,746.12 15.32I. OTHER (Non‐int. bearing) 261.48 29,682.88 5.58 27,082.82 24,482.76 4.89 23,169.50 5.56 19,436.43 4.90J. TOTAL LIABILITIES 4471.39 507,591.05 95.44 493,220.12 478,849.20 95.57 397,213.68 95.33 380,766.05 96.03K. EQUITY 213.69 24,257.81 4.56 23,236.11 22,214.41 4.43 19,459.88 4.67 15,752.11 3.97L. MINORITY INTEREST 0.06 6.60 0.00 6.41 6.22 0.00 0.19 0.00 0.17 0.00M. TOTAL LIABILITIES & EQUITY 4685.14 531,855.46 100.00 516,462.64 501,069.82 100.00 416,673.75 100.00 396,518.33 100.00USD1 = LKR 113.5197 USD1 = LKR 114.384 USD1 = LKR 113.520 USD1 = LKR 108.72People’s <strong>Bank</strong> (Sri Lanka)November 20109
<strong>Bank</strong>sIncome Statement AnalysisPeople's <strong>Bank</strong>30‐Jun‐10 31‐Dec‐09 31‐Dec‐08 31‐Dec‐07Income As % of Income As % of Income As % of Income As % ofExpenses Total AV Expenses Total AV Expenses Total AV Expenses Total AVLKRm Earning Assets LKRm Earning AssetsLKRm Earning AssetsLKRm Earning Assets1. Interest Income 31,327.64 13.77 68,859.58 17.27 58,855.06 17.04 46,904.71 14.742. Interest Expense 16,468.45 7.24 41,710.95 10.46 37,459.78 10.85 28,541.88 8.973. NET INTEREST REVENUE 14,859.19 6.53 27,148.62 6.81 21,395.28 6.19 18,362.83 5.774. Forex Income 683.62 0.30 1,120.82 0.28 818.40 0.24 648.99 0.205. Other Operating Income 1,937.43 0.85 5,799.63 1.45 4,890.98 1.42 4,798.22 1.516. TOTAL INCOME 17,480.25 7.69 34,069.08 8.55 27,104.65 7.85 23,810.04 7.487. Provision for Loan Losses 1,418.01 0.62 2,049.05 0.51 1,723.99 0.50 1,157.35 0.368. Provision Others 147.85 0.07 2,747.45 0.69 13.41 0.00 (18.01) (0.01)9. Personnel Expenses 5,171.52 2.27 12,567.34 3.15 10,932.30 3.17 10,259.93 3.2210. Other Non Int. Expenses 3,518.39 1.55 5,687.61 1.43 4,645.97 1.35 3,955.42 1.2411. TOTAL EXPENSES 10,255.77 4.51 23,051.45 5.78 17,315.66 5.01 15,354.69 4.8212.OPERATING PROFIT 7,224.48 3.18 11,017.63 2.76 9,789.00 2.83 8,455.35 2.6613.Associate Co 1.49 0.00 (1.52) (0.00) 17.98 0.01 17.20 0.0114. PRE‐TAX PROFIT 7,225.97 3.18 11,016.10 2.76 9,806.98 2.84 8,472.55 2.6615. Taxes 4,419.54 1.94 6,842.30 1.72 6,379.48 1.85 4,966.75 1.5616. Minority Interest 0.39 0.00 (0.41) (0.00) 0.04 0.00 0.05 0.0017. NET PROFIT 2,806.05 1.23 4,174.22 1.05 3,427.46 0.99 3,505.75 1.10People’s <strong>Bank</strong> (Sri Lanka)November 201010
<strong>Bank</strong>sRatio AnalysisPeople's <strong>Bank</strong>30‐Jun‐10 30‐Dec‐09 31‐Dec‐08 31‐Dec‐07I. PROFITABILITY LEVEL1. Net Interest Margin 6.31 6.56 5.94 5.512. Pre‐tax Profit/Total Assets (av.) 2.80 2.40 2.41 2.263. Net Income/Equity (av.) 24.15 20.03 19.47 25.274. Net Income/Total Assets (av.) 1.09 0.91 0.84 0.945. Total Non‐Int. Expense (excl.prov.)/ 49.71 53.58 57.47 59.70Net Int. Rev.+ Other Operating Income6. Net Int. Inc. / Opp. Income 85.01 79.69 78.94 77.127. Non Int. Inc./ Opp. Income 14.99 20.31 21.06 22.888. Net Interest Rev./Total Assets (av.) 5.75 5.92 5.26 4.90II. CAPITAL ADEQUACY (year end)1. Equity/Total Assets 4.56 4.43 4.67 3.972. Equity/Loans 6.50 6.86 6.86 5.853. Capital/Risks ‐ Tier 1 8.40 8.90 7.90 6.604. Capital/Risks ‐ Total 13.30 13.90 11.90 8.945. Net NPLs/Equity 40.59 32.12 28.13 18.25III. LIQUIDITY (year end)1. Liquid Assets/Customer & Short Term Funding 27.13 33.12 27.00 26.292. Loans/Customer & Short Term Funding 84.36 78.19 83.14 82.92IV. ASSET QUALITY1. Loan Loss Provisions/Loans (av.) 0.81 0.67 0.62 0.462. Loan Loss Reserves/Loans 4.66 5.12 5.59 5.693. Specific Loan Loss Reserves/NPLs 53.59 60.66 66.44 78.664. Loan Loss Reserves/NPLs 70.10 78.24 83.34 96.395. Non Performing Loans/Gross Loans 6.65 6.54 6.70 5.90People’s <strong>Bank</strong> (Sri Lanka)November 201011
<strong>Bank</strong>sALL FITCH CREDIT RATINGS ARE SUBJECT TO CERTAIN LIMITATIONS AND DISCLAIMERS. PLEASE READTHESE LIMITATIONS AND DISCLAIMERS BY FOLLOWING THIS LINK:HTTP://FITCHRATINGS.COM/UNDERSTANDINGCREDITRATINGS . IN ADDITION, RATING DEFINITIONS ANDTHE TERMS OF USE OF SUCH RATINGS ARE AVAILABLE ON THE AGENCY'S PUBLIC WEB SITE ATWWW.FITCHRATINGS.COM. PUBLISHED RATINGS, CRITERIA, AND METHODOLOGIES ARE AVAILABLE FROMTHIS SITE AT ALL TIMES. FITCH'S CODE OF CONDUCT, CONFIDENTIALITY, CONFLICTS OF INTEREST,AFFILIATE FIREWALL, COMPLIANCE, AND OTHER RELEVANT POLICIES AND PROCEDURES ARE ALSOAVAILABLE FROM THE CODE OF CONDUCT SECTION OF THIS SITE.Copyright © 2010 by <strong>Fitch</strong>, Inc., <strong>Fitch</strong> <strong>Rating</strong>s Ltd. and its subsidiaries. One State Street Plaza, NY, NY 10004.Telephone: 1‐800‐753‐4824,(212) 908‐0500. Fax: (212) 480‐4435. Reproduction or retransmission in whole or in part is prohibited except by permission. All rightsreserved. In issuing and maintaining its ratings, <strong>Fitch</strong> relies on factual information it receives from issuers and underwriters and from othersources <strong>Fitch</strong> believes to be credible. <strong>Fitch</strong> conducts a reasonable investigation of the factual information relied upon by it in accordancewith its ratings methodology, and obtains reasonable verification of that information from independent sources, to the extent such sourcesare available for a given security or in a given jurisdiction. The manner of <strong>Fitch</strong>'s factual investigation and the scope of the third‐partyverification it obtains will vary depending on the nature of the rated security and its issuer, the requirements and practices in thejurisdiction in which the rated security is offered and sold and/or the issuer is located, the availability and nature of relevant publicinformation, access to the management of the issuer and its advisers, the availability of pre‐existing third‐party verifications such as auditreports, agreed‐upon procedures letters, appraisals, actuarial reports, engineering reports, legal opinions and other reports provided bythird parties, the availability of independent and competent third‐party verification sources with respect to the particular security or inthe particular jurisdiction of the issuer, and a variety of other factors. Users of <strong>Fitch</strong>'s ratings should understand that neither an enhancedfactual investigation nor any third‐party verification can ensure that all of the information <strong>Fitch</strong> relies on in connection with a rating willbe accurate and complete. Ultimately, the issuer and its advisers are responsible for the accuracy of the information they provide to <strong>Fitch</strong>and to the market in offering documents and other reports. In issuing its ratings <strong>Fitch</strong> must rely on the work of experts, includingindependent auditors with respect to financial statements and attorneys with respect to legal and tax matters. Further, ratings areinherently forward‐looking and embody assumptions and predictions about future events that by their nature cannot be verified as facts.As a result, despite any verification of current facts, ratings can be affected by future events or conditions that were not anticipated atthe time a rating was issued or affirmed.The information in this report is provided "as is" without any representation or warranty of any kind. A <strong>Fitch</strong> rating is an opinion as to thecreditworthiness of a security. This opinion is based on established criteria and methodologies that <strong>Fitch</strong> is continuously evaluating andupdating. Therefore, ratings are the collective work product of <strong>Fitch</strong> and no individual, or group of individuals, is solely responsible for arating. The rating does not address the risk of loss due to risks other than credit risk, unless such risk is specifically mentioned. <strong>Fitch</strong> isnot engaged in the offer or sale of any security. All <strong>Fitch</strong> reports have shared authorship. Individuals identified in a <strong>Fitch</strong> report wereinvolved in, but are not solely responsible for, the opinions stated therein. The individuals are named for contact purposes only. A reportproviding a <strong>Fitch</strong> rating is neither a prospectus nor a substitute for the information assembled, verified and presented to investors by theissuer and its agents in connection with the sale of the securities. <strong>Rating</strong>s may be changed or withdrawn at anytime for any reason in thesole discretion of <strong>Fitch</strong>. <strong>Fitch</strong> does not provide investment advice of any sort. <strong>Rating</strong>s are not a recommendation to buy, sell, or hold anysecurity. <strong>Rating</strong>s do not comment on the adequacy of market price, the suitability of any security for a particular investor, or the taxexemptnature or taxability of payments made in respect to any security. <strong>Fitch</strong> receives fees from issuers, insurers, guarantors, otherobligors, and underwriters for rating securities. Such fees generally vary from US$1,000 to US$750,000 (or the applicable currencyequivalent) per issue. In certain cases, <strong>Fitch</strong> will rate all or a number of issues issued by a particular issuer, or insured or guaranteed by aparticular insurer or guarantor, for a single annual fee. Such fees are expected to vary from US$10,000 to US$1,500,000 (or the applicablecurrency equivalent). The assignment, publication, or dissemination of a rating by <strong>Fitch</strong> shall not constitute a consent by <strong>Fitch</strong> to use itsname as an expert in connection with any registration statement filed under the United States securities laws, the Financial Services andMarkets Act of 2000 of Great Britain, or the securities laws of any particular jurisdiction. Due to the relative efficiency of electronicpublishing and distribution, <strong>Fitch</strong> research may be available to electronic subscribers up to three days earlier than to print subscribers.People’s <strong>Bank</strong> (Sri Lanka)November 201012