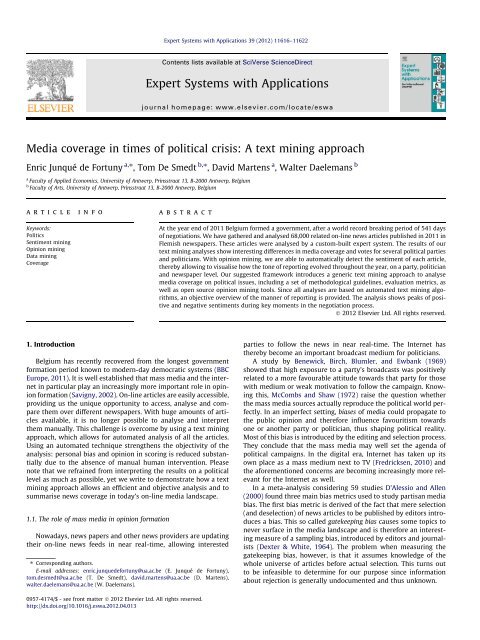
Media coverage in times of political crisis: A text mining ... - CLiPS
Media coverage in times of political crisis: A text mining ... - CLiPS
Media coverage in times of political crisis: A text mining ... - CLiPS

You also want an ePaper? Increase the reach of your titles
YUMPU automatically turns print PDFs into web optimized ePapers that Google loves.
11618 E. Junqué de Fortuny et al. / Expert Systems with Applications 39 (2012) 11616–11622Fig. 1. Process<strong>in</strong>g steps used to build and analyse the corpus.2.3. Data M<strong>in</strong><strong>in</strong>g: sentiment analysisTable 2News sources used for the analysis <strong>in</strong>clud<strong>in</strong>g their respective number <strong>of</strong> articles andreaders as well as bias metric values for the hamm<strong>in</strong>g distance from consensus (d H,c ),the hamm<strong>in</strong>g distance from votes (d H,v) and the deviation from election outcomes(bias). The bold values denote the bias (column 7) for the news source with the largesthamm<strong>in</strong>g distance <strong>in</strong> terms <strong>of</strong> the consensus (column 5) and the amount <strong>of</strong> votes(column 6).Source Regional # Articles # Readers a d H,c d H,v BiasDe Redactie No 5767 146,250 0 2 16.16%De Morgen No 11,303 256,800 0 2 21.53%GVA Yes 9154 395,700 6 4 27.30%HBVL Yes 3511 423,700 3 5 37.43%Nieuwsblad No 7320 1,002,200 2 4 20.24%De Standaard No 9154 314,000 2 4 23.32%De Tijd No 10,061 123,300 3 4 22.71%HLN No 11,380 1,125,600 3 4 21.62%aCounted by the amount <strong>of</strong> readers <strong>of</strong> the pr<strong>in</strong>ted version except for ‘‘DeRedactie’’ which does not exist <strong>in</strong> a pr<strong>in</strong>ted format. Instead, we used the number <strong>of</strong>unique visitors per day <strong>in</strong> 2009 as an estimation. Source: belga/odbs.2.1. Data acquisition and selectionThe corpus used <strong>in</strong> this study comprises <strong>of</strong> all articles published<strong>in</strong> on-l<strong>in</strong>e versions <strong>of</strong> all major Flemish newspapers <strong>in</strong> 2011 untilthe end <strong>of</strong> the <strong>political</strong> <strong>crisis</strong>. The corpus conta<strong>in</strong>s over 68,000 articles,spann<strong>in</strong>g a ten month period (from January 1, 2011 to October31, 2011). An overview <strong>of</strong> the eight covered newspapers is displayed<strong>in</strong> Table 2.All articles were gathered us<strong>in</strong>g a custom built web-crawler.The crawler extracts articles from the sources’ websites us<strong>in</strong>g theirbuilt-<strong>in</strong> search functionalities. The crawl<strong>in</strong>g process is the equivalent<strong>of</strong> a typical database selection process <strong>in</strong> which relevant dataare selected us<strong>in</strong>g the given query criteria. The query keywordsare all major Flemish party names and lead<strong>in</strong>g figures <strong>of</strong> <strong>political</strong>parties (see Table 1). The criterion for be<strong>in</strong>g a party <strong>of</strong> <strong>in</strong>terest isbased on the votes for that party <strong>in</strong> the 2010 Chamber Elections,we only <strong>in</strong>cluded major parties who were allowed <strong>in</strong> the Chamber(i.e. parties with at least one chair). A lead<strong>in</strong>g figure is a politicianwith a top ten rank<strong>in</strong>g amount <strong>of</strong> preference votes <strong>in</strong> the 2010 Senateelections (cf. Section 1.2). An overview <strong>of</strong> all <strong>political</strong> entities<strong>in</strong>cluded <strong>in</strong> this study is displayed <strong>in</strong> Table 1.For sentiment analysis, we used the previously created Patternm<strong>in</strong><strong>in</strong>g module for Python. 1 The module conta<strong>in</strong>s a subjectivity lexicon<strong>of</strong> over 3000 Dutch adjectives that occur frequently <strong>in</strong> productreviews, manually annotated with scores for polarity (positive ornegative between +1.0 and 1.0) and subjectivity (objective or subjectivebetween +0.0 and +1.0). For example: ‘‘boeiend’’ (fasc<strong>in</strong>at<strong>in</strong>g)has a positive polarity <strong>of</strong> +0.9 and ‘‘belabberd’’ (lousy) has a negativepolarity <strong>of</strong> 0.6. A similar approach with one axis for polarity andone for subjectivity is used by Esuli and Sebastiani (2006) for Englishwords.In previous research, the lexicon was tested with a set <strong>of</strong> 2000Dutch book reviews. Each review also has a user-given star rat<strong>in</strong>g.The set was evenly distributed over negative op<strong>in</strong>ion (star rat<strong>in</strong>g 1and 2) and positive op<strong>in</strong>ion (star rat<strong>in</strong>g 4 and 5). The average score<strong>of</strong> adjectives <strong>in</strong> each review was then compared to the orig<strong>in</strong>al starrat<strong>in</strong>g, with a precision <strong>of</strong> 72% and a recall <strong>of</strong> 82% (De Smedt &Daelemans, 2012).In our approach, we look for occurrences <strong>of</strong> Flemish <strong>political</strong>parties (see Table 1) <strong>in</strong> each newspaper article. We then calculatethe polarity <strong>of</strong> each adjective that occurs <strong>in</strong> a w<strong>in</strong>dow <strong>of</strong> two sentencesbefore and two sentences after. An article can mention severalparty names, or switch tone. The given <strong>in</strong>terval ensures a morereliable correlation between the <strong>political</strong> party be<strong>in</strong>g mentioned(the ‘‘target’’) and the adjective’s polarity score, contrary to measur<strong>in</strong>gall adjectives <strong>in</strong> the article. A similar approach for targetidentification with a 10-word w<strong>in</strong>dow is used <strong>in</strong> Balahur et al.(2010). They report improved accuracy when compared to measur<strong>in</strong>gall words <strong>in</strong> the article. We furthermore exclude adjectives thatscore between 0.1 and +0.1 to reduce noise. This results <strong>in</strong> a set <strong>of</strong>366,613 assessments, where one assessment corresponds to anadjective score l<strong>in</strong>ked to a party or politician.For example:Bart De Wever (N-VA) verwijt de Franstalige krant Le Soir dat zeaanzet tot haat, omdat zij een op<strong>in</strong>iestuk publiceerde over deVlaamse wooncode met daarbij een foto van een Nigeriaans massagraf.De ho<strong>of</strong>dredactrice legt uit waarom ze De Wever <strong>in</strong> zijn segregatiezuchthard zal blijven bestrijden. ‘‘Verontwaardigd? Ja, wezijn eerst en boven alles verontwaardigd.’’2.2. Data preprocess<strong>in</strong>gIn a second preprocess<strong>in</strong>g phase all data is filtered so as to removepossible duplicate articles. To see why this is necessary, considerthe case <strong>in</strong> which an article concerns two parties at the sametime. As a consequence <strong>of</strong> the crawl<strong>in</strong>g process, this article will bepresented twice <strong>in</strong> the dataset (once for the first party namesearch, once for the second party name search). The second articlepresent is a redundant entry and must be removed for the frequency<strong>in</strong>formation to be correct. This leaves us with a corpus <strong>of</strong>all unique articles conta<strong>in</strong><strong>in</strong>g the keywords presented <strong>in</strong> Table 1.Bart De Wever (N-VA) accuses the French newspaper Le Soir <strong>of</strong><strong>in</strong>cit<strong>in</strong>g hatred after they published an op<strong>in</strong>ion piece on the Flemishhous<strong>in</strong>g code together with a picture <strong>of</strong> a Nigerian mass grave. Theeditor expla<strong>in</strong>s why they will cont<strong>in</strong>ue to fight De Wever’s love <strong>of</strong>segregation hard. ‘‘Outraged? Yes, we are first and above alloutraged.’’The adjective ‘‘hard’’ scores 0.03 and is excluded. The adjective‘‘verontwaardigd’’ (outraged, <strong>in</strong>dignant) scores 0.4. In overall, thepassage about the <strong>political</strong> party N-VA is assessed as negative.1 http://www.clips.ua.ac.be/pages/pattern.
E. Junqué de Fortuny et al. / Expert Systems with Applications 39 (2012) 11616–11622 11619Fig. 2. Discrepancy between media <strong>coverage</strong> and popularity for popular parties.Fig. 3. Discrepancy between media <strong>coverage</strong> and popularity for popular politicians.3. ResultsWe analyse the biases and sentiments throughout the wholecorpus for each <strong>political</strong> entity. We will first be look<strong>in</strong>g at thefrequency <strong>of</strong> occurrence (i.e. the <strong>coverage</strong>) and afterwards at thetone <strong>of</strong> articles.3.1. <strong>Media</strong> <strong>coverage</strong> biasThe <strong>coverage</strong> c(e,s) <strong>of</strong> an entity e by a newspaper s is def<strong>in</strong>ed asthe number <strong>of</strong> news articles published by the newspaper on thatentity, normalised on the total amount <strong>of</strong> articles by that newspaper<strong>in</strong> the corpus A s 2 :cðe; sÞ ¼ #faja 2A s ^ e 2 ag#A sð1ÞThe popularity p(e) <strong>of</strong> a <strong>political</strong> party e is def<strong>in</strong>ed as the relativeamount <strong>of</strong> preference votes v(e) for that entity (as compared to2 Source: Federal Public Services Home Affairs (http://poll<strong>in</strong>g2010.belgium.be/). Allpercentages <strong>in</strong> this study are normalised over the Flemish parties and the selection, soas to be able to make statistically sound comparisons.
11620 E. Junqué de Fortuny et al. / Expert Systems with Applications 39 (2012) 11616–11622Fig. 4. Comparison <strong>of</strong> media <strong>coverage</strong> <strong>of</strong> different parties by different newspapers: (a) <strong>coverage</strong> rank<strong>in</strong>g (b) bias.Fig. 5. Sentiment for each <strong>political</strong> party, with the percentage <strong>of</strong> positive news items on the left and negatives ones on the right.other entities <strong>in</strong> the top rank<strong>in</strong>g set E):vðeÞpðeÞ ¼Pe 2Evðe 0 Þ0The popularity is used as the a priori fair distribution. The <strong>coverage</strong>bias (henceforth referred to as the bias) <strong>of</strong> a media source is the differencebetween the real distribution and the fair distribution. Thatis:biasðe; sÞ ¼cðe; sÞ pðeÞ ð3ÞbiasðsÞ ¼ X biasðe; sÞ ð4Þe2Ewhere a is an article, represented as a bag <strong>of</strong> words fw 1 ; w 2 ; ...; w na gwith n a the amount <strong>of</strong> words <strong>in</strong> the article. Fig. 2 shows that forsome parties a substantial bias is found, with a maximal positivebias towards CD& V and a maximal negative bias towards the farrightVlaams Belang (VB). The first result can be justified by the factð2Þthat CD& V ran the <strong>in</strong>terim government while the new governmentformations took place. The latter result gives supportive evidence toprevious research outcomes that the party is be<strong>in</strong>g quarant<strong>in</strong>ed bythe media (Yperman, 2004).We repeat the analysis for politicians, us<strong>in</strong>g the relative amount<strong>of</strong> preference votes for a party <strong>in</strong> 2010 as a comparison measure. Ascan be seen <strong>in</strong> Fig. 3, the bias with respect to a politician varies irrespective<strong>of</strong> the party from which the politician comes. For <strong>in</strong>stance,a positive bias towards Bart De Wever is not reflected <strong>in</strong> the (negative)bias <strong>of</strong> his party (N-VA).It is also <strong>in</strong>terest<strong>in</strong>g to note the differences between differentnews sources. To this extent we def<strong>in</strong>e a matrix, rank<strong>in</strong>g all <strong>political</strong>parties by <strong>coverage</strong> per newspaper (Fig. 4(a)). The major tendenciesare similar to our previous analysis, but some localdifferences do exist. We use the Hamm<strong>in</strong>g distance d H (Eq. 5) tomeasure the amount <strong>of</strong> rank<strong>in</strong>g difference for each newspaper,compared to the average rank<strong>in</strong>g (see Table 2, d H,c ). As the Hamm<strong>in</strong>gdistance <strong>in</strong>creases, disagreement between the consensus
E. Junqué de Fortuny et al. / Expert Systems with Applications 39 (2012) 11616–11622 11621Fig. 6. Sentiment <strong>of</strong> news items <strong>in</strong> 2011 for each party.Fig. 7. Sentiment <strong>of</strong> news items <strong>in</strong> 2011 for each newspaper.rank<strong>in</strong>g <strong>in</strong>creases. A maximal Hamm<strong>in</strong>g distance <strong>of</strong> 6 is found forregional newspaper GVA. When we look at the total bias <strong>of</strong> newspapers (Eq. 4), we see that aga<strong>in</strong> regional newspapers (GVA, HBVL)
11622 E. Junqué de Fortuny et al. / Expert Systems with Applications 39 (2012) 11616–11622deviate more than global ones. This is also visible <strong>in</strong> the Hamm<strong>in</strong>gdistance between <strong>coverage</strong> and votes (see Table 2, d H,c ).d H ðv; wÞ ¼ X#Ei¼1lðv i ; w i Þlða; bÞ ¼ 0 a ¼ b1 a – bThe bias between different parties is not uniformly distributedamong all parties (i.e. equal to zero). A more f<strong>in</strong>e gra<strong>in</strong>ed analysis(Fig. 4(b)) shows that general tendencies propagate to the local level(i.e. Vlaams Belang is under-represented <strong>in</strong> all newspapers).Interest<strong>in</strong>gly though, some substantial local differences exist aswell. For <strong>in</strong>stance regional newspaper Het Belang Van Limburg(HBVL) has a large negative bias towards N-VA.3.2. Sentiments3.2.1. Sentiments by partyFor a given <strong>political</strong> party, we take the distribution <strong>of</strong> positiveversus negative assessments (i.e., adjective polarity scores) as an<strong>in</strong>dicator <strong>of</strong> the party’s overall sentiment <strong>in</strong> media. Fig. 5 showsthe distribution for each party. Overall, 30–40% <strong>of</strong> newspaper <strong>coverage</strong>is assessed as negative. Some statement bias is present underthe assumption <strong>of</strong> uniformity <strong>of</strong> the sentiment distribution.Highest negative scores are measured for the far-right VlaamsBelang (which is quarant<strong>in</strong>ed by the other parties): 30.4%, andfor the N-VA: 28.8%. In 2010, the Dutch-speak<strong>in</strong>g, right-w<strong>in</strong>gN-VA emerged both as newcomer and largest party <strong>of</strong> the Belgianfederal elections. The second largest party was the French-speak<strong>in</strong>g,left-w<strong>in</strong>g PS (founded <strong>in</strong> 1978). While the N-VA ultimatelyseeks secession <strong>of</strong> Flanders from Belgium, the PS is <strong>in</strong>cl<strong>in</strong>ed towardsstate <strong>in</strong>terventionism. Dur<strong>in</strong>g the follow<strong>in</strong>g year they wereunable to form a government coalition, which has sparked mediacontroversy. This clash is a possible explanation for the negativescore.3.2.2. Evolution <strong>of</strong> sentiments over timeFor a given <strong>political</strong> party, we group assessments <strong>in</strong> subsets <strong>of</strong>one week. We then calculate a simple mov<strong>in</strong>g average (SMA)across all weeks to smoothen fluctuation <strong>in</strong> <strong>in</strong>dividual partiesand emphasize differences across parties.Fig. 6 shows the SMA <strong>of</strong> each <strong>political</strong> party across all newspapers.It is <strong>in</strong>terest<strong>in</strong>g to note the peak with all parties (exceptVlaams Belang) around July–August. Dur<strong>in</strong>g this time, the negotiat<strong>in</strong>gparties (negotiat<strong>in</strong>g for a government coalition s<strong>in</strong>ce 2010)were on a three-week leave. Once negations resumed around August15th, the peak drops. In the Belgian <strong>political</strong> <strong>crisis</strong>, it seems,no news on the <strong>political</strong> front equals good news.Fig. 7 shows the SMA <strong>of</strong> each newspaper across <strong>political</strong> parties.The curves with the highest fluctuation are those for Het Belang VanLimburg and De Redactie. With these newspapers we measure astandard deviation on the SMA <strong>of</strong> 0.08 and 0.07 respectively, whereother newspapers are <strong>in</strong> the [0.03,0.05] range. Het Belang Van Limburgalso has the highest average sentiment: +0.15 aga<strong>in</strong>st[0.13,0.14] for all other newspapers. De Standaard newspaper appearsto deliver the most neutral <strong>political</strong> articles.4. ConclusionsWe have analysed Flemish newspapers quantitatively dur<strong>in</strong>g aperiod <strong>of</strong> <strong>political</strong> <strong>crisis</strong> us<strong>in</strong>g a custom built expert system. Weð5Þð6Þhave shown that there exists a <strong>coverage</strong> bias and provide supportfor the claim that some statement bias exists throughout the massmedia. Methodologically we have shown that expert systems are aviable strategy for research <strong>in</strong> <strong>political</strong> <strong>text</strong> corpora.This proposed <strong>text</strong>-m<strong>in</strong><strong>in</strong>g approach based framework can beused as a general <strong>political</strong> barometer, to compare newspapers withregards to their (relative) report<strong>in</strong>g style, and can even serve <strong>political</strong>parties who could follow the news report<strong>in</strong>g on specific topicsand adjust their stands if deemed appropriate. An on-l<strong>in</strong>e dashboardthat updates the given graphs <strong>in</strong> real-time will facilitate suchuses. In our future research, we envision the application <strong>of</strong> thisframework for American <strong>political</strong> news, and more specific for theAmerican presidential race. From a methodological po<strong>in</strong>t <strong>of</strong> view,we aim to compare the <strong>text</strong> m<strong>in</strong><strong>in</strong>g approach us<strong>in</strong>g subjectivitylexicons with a mach<strong>in</strong>e learn<strong>in</strong>g classification approach, us<strong>in</strong>g alabelled dataset. Furthermore, the sentiment analysis could be ref<strong>in</strong>edby dist<strong>in</strong>guish<strong>in</strong>g negative content from negative op<strong>in</strong>ion andby add<strong>in</strong>g more classes <strong>of</strong> sentiment.To conclude, we hope that further <strong>political</strong> analysis can benefitfrom this systematic and unbiased approach.ReferencesBalahur, A., Ste<strong>in</strong>berger, R., Kabadjov, M., Zavarella, V., Van Der Goot, E., Halkia, M.,et al. (2010). Sentiment Analysis <strong>in</strong> the News.BBC Europe. (2011). Belgium swears <strong>in</strong> new government headed by Elio Di Rupo..Benewick, R. J., Birch, A. H., Blumler, J. G., & Ewbank, A. (1969). The float<strong>in</strong>g voterand the liberal view <strong>of</strong> representation. Political Studies, 17, 177–195.D’Alessio, D., & Allen, M. (2000). <strong>Media</strong> bias <strong>in</strong> presidential elections: A metaanalysis.Journal <strong>of</strong> Communication, 50, 133–156.De Smedt, T., & Daelemans, W. (2012). ’’Vreselijk mooi!’’ (terribly beautiful): Asubjectivity lexicon for Dutch adjectives. In: Proceed<strong>in</strong>gs <strong>of</strong> the 8th LanguageResources and Evaluation Conference (LREC 2012), <strong>in</strong> press.Dexter, L., & White, D. (1964). People, society, and mass communications. London: TheFree Press <strong>of</strong> Glencoe, Collier-MacMillan Ltd.Esuli, A., & Sebastiani, F. (2006). SentiWordNet: A publicly available lexical resourcefor op<strong>in</strong>ion m<strong>in</strong><strong>in</strong>g. In Proceed<strong>in</strong>gs <strong>of</strong> LREC, Citeseer (Vol. 6, pp. 417–422).Fayyad, U., & Piatetsky-Shapiro, G. (1996). From data m<strong>in</strong><strong>in</strong>g to knowledgediscovery <strong>in</strong> databases. AI Magaz<strong>in</strong>e, 17, 37–54.Fredricksen, C. (2010). Time spent watch<strong>in</strong>g TV still tops <strong>in</strong>ternet. .Godbole, N., & Skiena, S. (2007). Large-scale sentiment analysis for news and blogs(System Demonstration). In ICWSM Icwsm 07 (pp. 1–2).Liu, B. (2010). Sentiment analysis and subjectivity. Handbook <strong>of</strong> natural languageprocess<strong>in</strong>g (pp. 1–38).McCombs, M. E., & Shaw, D. L. (1972). The agenda-sett<strong>in</strong>g function <strong>of</strong> mass media.Public Op<strong>in</strong>ion Quarterly, 36, 176.Mihalcea, R. (2011). The <strong>text</strong> m<strong>in</strong><strong>in</strong>g handbook: advanced approaches to analyz<strong>in</strong>gunstructured data Ronen Feldman and James Sanger (Bar-Ilan University andABS Ventures) Cambridge, England: Cambridge University Press, 2007, xii+410pp; hardbound, ISBN 0-521-83657-3, 70.00. Computational L<strong>in</strong>guistics, 34,125–127.Niven, D. (2003). Objective evidence on media bias: Newspaper <strong>coverage</strong> <strong>of</strong>congressional party switchers. Journalism and Mass Communication Quarterly,80, 311–326.Pang, B., Lee, L., & Vaithyanathan, S. (2002). Thumbs up? Sentiment Classificationus<strong>in</strong>g Mach<strong>in</strong>e Learn<strong>in</strong>g Techniques.Rada, R. (2008). Expert systems and evolutionary comput<strong>in</strong>g for f<strong>in</strong>ancial <strong>in</strong>vest<strong>in</strong>g:A review. Expert Systems with Applications, 34, 2232–2240.Savigny, H. (2002). Public op<strong>in</strong>ion, <strong>political</strong> communication and the <strong>in</strong>ternet.Political Studies, 22, 1–8.Schumaker, R. P., & Chen, H. (2009). Textual analysis <strong>of</strong> stock market predictionus<strong>in</strong>g break<strong>in</strong>g f<strong>in</strong>ancial news. ACM Transactions on Information Systems, 27,1–19.Suh, J. H., Park, C. H., & Jeon, S. H. (2010). Apply<strong>in</strong>g <strong>text</strong> and data m<strong>in</strong><strong>in</strong>g techniquesto forecast<strong>in</strong>g the trend <strong>of</strong> petitions filed to e-People. Expert Systems withApplications, 37, 7255–7268.Taboada, M., Brooke, J., T<strong>of</strong>iloski, M., Voll, K., & Stede, M. (2011). Lexicon-basedmethods for sentiment analysis. Computational L<strong>in</strong>guistics, 1, 1–41.Tang, H., Tan, S., & Cheng, X. (2009). A survey on sentiment detection <strong>of</strong> reviews.Expert Systems with Applications, 36, 10760–10773.Yperman, T. (2004). Van Vlaams Blok naar Vlaams Belang. Ph.D. thesis University <strong>of</strong>Ghent.