Opti-Insight⢠User Guide - English - QRS Diagnostic
Opti-Insight⢠User Guide - English - QRS Diagnostic
Opti-Insight⢠User Guide - English - QRS Diagnostic
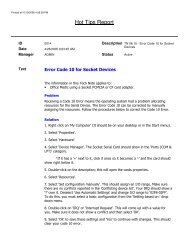
- No tags were found...

Create successful ePaper yourself
Turn your PDF publications into a flip-book with our unique Google optimized e-Paper software.
14Reviewing and Editing an ABP StudyOpening a patient file1. <strong>Opti</strong>-Insight will automatically open a patient file directly after the data isretrieved.2. From the File menu, select Open. Alternatively, from the toolbar, click the BPData button.NOTE: If you are opening patient files not converted to the current versionof <strong>Opti</strong>-Insight, a message appears requesting that you convert previouslysaved patient files to new encrypted files to enhance security. SeeConverting patient data files.3. The Open APB Study/Choose Patient dialog box appears, allowing you to selectthe patient file to open. (An asterisk next to the file name indicates patient filesthat have not been converted.) Select the patient whose BP data you wish toretrieve by clicking on the patient’s name.4. Select OK.5. If the patient has more than one ABP study, a second dialog box, Choose Date,appears. Select a date and select OK. The patient’s data appears in the displayarea. You can now edit the BP studies or print a report.Each study in a patientfile contains data that isdisplayed in the viewsaccessed by the tabs at thebottom of the application.You can edit data on thefollowing tabs: ABP Data,Patient Info, Physician Info.The status bar identifies thepatient name, ID, study date,and file name of thedisplayed file.Fig. 8: ABP Data Graph, Threshold tab15Viewing an ambulatory blood pressure studyIn the upper portion of the ABP Data tab, a table displays each of the BPmeasurements collected during the test period (Fig. 8). The table shows highlightedsystolic and diastolic BP readings, heart rate, and any event, quality, or test codesassociated with the measurement.Below the table is a graphical representation of the BP data. The scale of the verticalaxis represents blood pressure in mmHg and heart rate in beats per minute (bpm).The horizontal axis displays the time in clock hours. Clicking on any point in thegraph highlights the corresponding measurement row in the table.There is one tab to the right of the graph: Threshold. The Threshold tab displays thelegend for the ABP Data graph and allows the user to change the Threshold settingson the graph.Shading on the graph indicates the period of the study. The default colors (which canbe changed using the Configuration > Colors tab) are the following:• Light gray shading: Indicates the asleep period of the study.To zoom in on a portion of the graph:1. Place the mouse over either axis of the graph (Fig. 8) until it turns into a doublearrow.2. For the vertical (horizontal) adjustment, drag the double arrow down (right) tozoom in or up (left) to zoom out. If zooming in causes part of the graph to behidden, the right-hand or bottom border turns into a scroll bar that you can useto adjust the viewing window.To adjust the size of the data table:1. Position the mouse pointer over the bottom boundary of the table.2. When the pointer turns to a double arrow, drag it up or down to resize the tableand graph displayed.Tabs and their contents• ABP Data: ABP study data from the monitor.• Patient Info: Patient name, ID, contact information, and physical description.• Physician Info: Patient history, clinical information, and interpretation.• Statistics: Statistical analysis of the edited ABP study.• Hourly Averages: Analysis of edited ABP study data including studycomparison.
16Editing an ambulatory blood pressure studyIn the ABP Data view, you can edit an ABP study for accuracy and context. Whenthe data is retrieved by <strong>Opti</strong>-Insight, all readings in an ABP study that have suspectcodes will be “tagged” in the first column of the table, either with an asterisk (*) oran exclamation point (!). Tagged records are omitted from the analysis of the ABPstudy displayed in the Statistics and Hourly Averages views, but these readings can beprinted in the report (see Omitted BP Data Page).Entering Patient Diary CommentsUse the Comments column, the right-most column inthe table, to keep track of patient activity during a BPreading. While activity is only one of the many factorsthat can affect blood pressure, it can be helpful inunderstanding a BP reading within the context of thestudy.17The monitor tags data with an asterisk based on criteria used to determine thevalidity of the data. The exclamation point (!) is a permanent tag and is used whenan accurate reading can not be determined by the ABP monitor. This tag can notbe changed and associated data will not be used in data analysis. The asterisk (*)is a tag that you can edit. Data can be tagged or un-tagged based on a number offactors, including patient history, patient diary information, or other factors.There are two methods to remove or insert an asterisk (*) tag on a measurement.Using the table:1. Highlight the reading you want to tag (omit) or un-tag (include) by selecting it.2. Select the first, or left-most, cell under the column, labeled “Tag”From the graph:1. Use the cursor on the graph to select the reading you want to tag (omit) or untag(include). Consequently, this action highlights the reading in the table.2. Right-click the mouse which invokes the context menu.3. Select Toggle Tag from the menu.NOTE: All edits to the ABP study data are saved immediately.To enter a patient comment from the table (Fig 9):1. Highlight the reading to which you want toadd a comment, and select the correspondingcell in the Comments column.Fig. 9: Comments from table2. Press the left mouse button to invoke a pull-downmenu.3. Enter a comment or select a comment from the list.4. Press Enter.To enter a comment from the graph:1. Using the mouse pointer, select the reading in the ABP data graph to whichyou want to add a comment by pressing the left mouse button. This causes thecorresponding row in the table to be highlighted2. Press the right mouse button, which invokes the context menu.3. Select Set comment from the menu.4. Add comment by typing or selecting from list, and select OK to add.NOTE: All edits to the ABP study data are saved immediately.You can add or delete entries appearing in the comments list by going to the DiaryComments section of the Configuration window. (For instructions on configuring DiaryComments, see Customizing and Configuring <strong>Opti</strong>-Insight.)
18Changing Awake/Asleep TimesAlong with BP thresholds, asleep timesare used to calculate BP loads and asleepdip percentage. The time is defined by theparameters set when preparing the monitorfor a study. However, you can change thesetimes if they have not been pre-defined or areinaccurate.1. Display an ABP study (Fig. 8). Choosethe Threshold tab.2. Click Edit Awake/Asleep Times to changethe patient’s asleep and awake times.3. In the Times tab (Fig. 10), reset thepatient’s asleep and awake times tothe nearest half-hour by moving theappropriate sliders right or left. The new Fig. 10: Awake and Asleep Timestimes are displayed on the clock face,with the black portion representing time asleep and the white portion, timeawake. The clock is displayed in military time, i.e., 12:00 is noon, 18:00 is6 p.m., and 00:00 (or 24:00) is midnight.Setting BP Threshold Limits<strong>User</strong>s may select the systolic and diastolic thresholds used to calculate the bloodpressure load. There are two settings for thresholds: global and custom.Global thresholds apply to all patient files; custom settings apply to all studies fora particular patient. The default setting for <strong>Opti</strong>-Insight is a global threshold set to140/90 for awake periods and 120/80 for asleep periods.Alternatively, you can define custom thresholds,which apply to a particular patient’s file. Thesethresholds will apply to all studies for this patientonly.1. Display an ABP study (Fig. 8). Choose theThreshold tab.2. Click Edit Thresholds to change the thresholdsettings.3. Click Use custom or Use global thresholdsand move the sliders to change the rangesaccording to your preferences.4. Click OK to apply the changes.Fig. 11: Setting BP Thresholds19Editing Patient Info and Physician InfoPatient information and physician information may be entered while data is retrievedfrom the monitor (see Retrieving Data from the ABP Monitor). <strong>User</strong>s may edit or addthis data once the patient file is saved as well.To edit Patient Info:1. Choose the Patient Info tab at the bottom of the screen.2. Click on the Edit button.3. Update any patient information and choose OK.To edit Physician Info:1. Choose the Physician Info tab at the bottom of the screen.2. Click on the Edit button.3. Update any information and choose OK.<strong>User</strong>s are able to enter and edit Patient History, Reason for Test, Current Medications,and Physican Interpretation. As an alternative to typing in the free text field forCurrent Medications, users may add Medication, Dosage, and Frequency todictionaries that are stored within <strong>Opti</strong>-Insight.To use the Add Medications function (Fig. 12):1. Type a medication into the drop-down titled Medication.2. Once the medication is typed, press “Enter” or “Tab” on the keyboard or useyour mouse to move the cursor to the Dosage column.3. Enter Dosage and Frequency in the same manner. Pre-populated entries inthe Frequency column are listed below.AbbreviationacbidpcprnqamqdqhqhsqidqodqpmqwktidMeaningBefore mealsTwice dailyAfter mealsAs neededEvery day before noonEvery dayEvery hourEvery night at bedtimeFour times a dayEvery other dayEvery day after noonEvery weekThree times a day
204. Once the Medication, Dosage, and Frequency are entered into their respectivecolumns, choose the “Add” button to add the information to the CurrentMedications field above and to the dictionary.Fig. 12: Physician Information, Add MedicationsTo locate and choose a previouslystored entry:1. Either start to type an entry orchoose the down-arrow with yourmouse. As more characters of thedesired entry are typed, a list ofmatching entries will be displayed.2. To choose the stored entry, usethe down arrow on the keyboard,highlight the desired entry, andpress “Enter” on the keyboard.Alternatively, use the mouse tohighlight the entry, and thendouble-click the entry.3. When each of the columnsare populated with the correctinformation, press “Add.”21Viewing StatisticsTo view the statistical analysis for the displayed ABP study, click on the Statistics tabon the bottom of the screen. This window shows the following tables:• Overall: Data for all periods combined• Awake Period: Data collected while the patient is awake• Asleep Period: Data collected while the patient is asleepNOTE: All data in these tables is included in exports.• BP Load: Blood pressure load characterizes the distribution of measurements inan ABP study relative to thresholds indicative of hypertension. The percentageof readings above this threshold is the BP load. Formulated to assess the effectsof anti-hypertensive therapy in an ABP study, it has been shown to correlate withseveral indices of hypertensive cardiac target organ involvement.• Dip: The nocturnal fall of blood pressure expressed as a percentage of themean awake values.<strong>Opti</strong>-Insight displays an ABP study ina number of tabular, statistical, andgraphical forms that simplify the tracking Fig. 13: Patient Informationof a patient’s progress and the analysisneeded to formulate a diagnosis. Data analysis of the edited ABP study is shown onthe following tabs:• Statistics• Hourly AveragesFig. 14: Figure Statistics
22Viewing Hourly AveragesTo display trends in a patient’s ABP study, click the Hourly Averages tab at the bottomof the window (Fig. 15). The table shows the average BP readings for each hour thepatient was tested. In addition to the systolic (Sys), diastolic (Dia) and the heart rate(HR), the following statistical averages are provided:• Mean Arterial Pressure (MAP) - This is the average pressure in an arteryover the period of one heartbeat. In the brachial artery, it is calculated byadding the diastolic to one-third of the difference between the systolic anddiastolic readings.• Pulse Pressure (PP) - This is calculated by subtracting the diastolic from thesystolic reading. It is another hemodynamic parameter that may serve as anindicator for cardiovascular risk.• Pressure Rate Product (PRP) - This is the product of the average systolicreading multiplied by the average heart rate. PRP strongly correlates to a patient’sactivity level and may be a key indicator of cardiovascular risk. As typicallyreported in research and clinical applications, PRP data is divided by 1000.Comparing two studiesTo further enhance the utility of ABP, you may want to measure the progress of apatient’s blood pressure by collecting multiple ABP studies. <strong>Opti</strong>-Insight allowscomparison of the hourly averages and statistics for two studies.To Compare Two Studies on the Same Patient:1. Click on Hourly Averages tab at the bottom of the window.2. Click on the Get Comparison Study button at the right of the window. (If thebutton is grayed out, the patient file you are viewing contains only one study.)3. The Choose Date will appear. Select the study you want to use as a referencefor comparison by highlighting it and clicking OK.The statistics generated during the previous study are now incorporated into theHourly Averages window. The table expands to include two new lines for eachhourly average. One shows the hourly average for the corresponding hour for thereference study, and the other line shows the difference between the displayed andthe reference studies.23On the graph at the bottom of the window, both studies’ data are displayed (Fig. 16).The dotted lines represent data from the reference study, and solid lines representdata from the displayed study. Select Difference, and the graph will display one linerepresenting the difference between the two studies.Fig. 15: Hourly AveragesThe same navigation tools for the Hourly Average and ABP Data windows also applyto the comparison window. You can move the table to a particular hour by clickingabove that hour on the graph. Additionally, you can use your mouse to resize thetable and zoom the graph in and out. (For instructions on resizing and zooming, seeViewing an Ambulatory Blood Pressure Study.)Use the check boxes at the top of each column to select the statistics you would liketo see displayed in the graph at the bottom of the page. You can resize the tableand zoom in on the graph with your mouse pointer. (For instructions on resizing andzooming, see Viewing an Ambulatory Blood Pressure Study.)Fig. 16: Hourly Averages, Study Comparison
26• Edited Data: Shows all the BP readings used in calculating statistics in graphand table format. Displays the time of the reading, the BP measurement, heartrate, mean arterial pressure (MAP), codes, and comments. The vertical blackline between # and Time columns indicate the sleep period. A “>” symboladjacent to the BP reading indicates that it has exceeded the threshold.• Omitted Data: Shows the BP readings that were not used to calculate statistics.This page appends to the Edited Data page if printed.• Hourly Averages: Displays hourly average data for the study in graph andtable formats. In addition to the BP reading, heart rate, and MAP, Pulse Pressure(PP) and Pressure Rate Product (PRP/1000) are included. Prints as displayed onthe Hourly Averages tab.• Study Comparison: Displays study comparison data in graph and tableformats. Prints as displayed on the Hourly Averages tab.• Histogram: Contains frequency histograms for all variables.• Monitor Configuration: Shows the study parameters used by the ABP monitorfor the study. The page shows information about sleep times and definitions forapplicable codes. This page also displays the selected maximum pressure value.Report - Details tabYou can control the following parameters for printing reports:• Graph Type: Controls if the type of graph printed will be line, bar, or the graphtype currently displayed.• Graph Scale: Controls the time scale for the graph of ABP data when printed.This graph will be printed when the ABP summary page, Edited Data Page, orOmitted Data Page are printed.• Horizontal Site Lines: Sets how often sight lines are used when printing theEdited Data Page, or Omitted Data Page in the report.27Printing the report<strong>Opti</strong>-Insight provides you with flexibility in printing the report. You can either:• Print the configured report by clicking the Print button on the toolbar or by goingto the Report menu and selecting Print. The Print dialog box is displayed, whereyou can choose the printer under Name.• Print the report page corresponding to the current tab that is being displayed byclicking Print Page. The table below shows the report page(s) generated by thedisplay of each tab.Displayed TabABP DataPatient InfoPhysician InfoStatisticsHourly AveragesReport Page(s) PrintedEdited and Omitted Data with GraphPatient InformationSummary PageStatistical TablesHourly Averages and Study ComparisonSaving the report as a PDFTo save the report as an Acrobat Portable Document Format (PDF), from the Reportmenu, select Create PDF. Alternatively, click the PDF toolbar button. The systemcreates the PDF to the location you specify.NOTE: You must have a printer installed. If you do not have a printerinstalled, see the online Help to install a driver to print to a file.Previewing the report1. To view individual pages after the report has been configured, from the Reportmenu, select Preview. Alternatively, click the Print Preview toolbar button. ThePrint Preview window is displayed (Fig. 19).2. To view individual pages, click on the numbered icons on the left side of thewindow.3. To change the format and details, click Configure.4. To print the report, click Print Report. To print the currently viewed page, clickPrint Page.Fig. 19: Print Preview
28Managing Patient FilesManage patient files using the following functions.OpenThis feature allows you to retrieve a patient’s data file.1. From the toolbar, select the BP Data button or from the File menu, select Open.The Open APB Study – Choose Patient dialog box appears, allowing you toselect the patient file to open.2. Select the patient whose BP data you wish to retrieve by clicking on the patient’sname. Select OK.3. If the patient has more than one ABP study, a second dialog box, Choose Date,will be displayed. Select a date and press OK.4. The patient’s data appears in the Display Area. You can now edit the BP data orprint a report.NOTE: If patient files are saved to a shared folder/network, the patientfile may be accessed by only one user at a time. If an additional userattempts to open a patient file in use, a message stating that the file iscurrently in use will be displayed.CopyTo copy BP data files to other disks or directories:1. From the File menu, select Copy.2. The Copy – Choose File(s) dialog box appears. Select the files you want tocopy. Click OK.3. A Copy Files to: dialog box appears. Choose the destination drive anddirectory. Click OK to copy the files.ExportTo export BP data files to either ASCII or GDT format:1. From the File menu, select Export.2. Choose either to export the Displayed File or select files From Database.3. If selecting files from the database, check the files you want to export and clickOK.4. The Export dialog box appears. Click Export to export the file(s). Select Edit tochange the files you want to export. Choose Configure to configure the detailsof the exported file(s). (For instructions on configuring export, see Export inCustomizing and Configuring <strong>Opti</strong>-Insight)EmailTo email <strong>Opti</strong>-Insight data files as an attachment:1. From the File menu, select Email.2. Choose either to email the Displayed File or select files From Database. IfDisplayed File is chosen, the data currently displayed on the screen is emailed.If From Database is chosen, the patient database window opens and promptsyou to Select file(s) to email. All selected tests will be emailed.3. If selecting files from the database, check the files you want to email and clickOK.4. The Email dialog box will appear. Type in the recipient email address(es), asubject for your message, and a message. The <strong>Opti</strong>-Insight file must have a“.awp.enc” file appendage for the recipient to view the <strong>Opti</strong>-Insight file. The“.enc” denotes that the file is encrypted.5. Click Send to email the file(s). Select Attach to change the files you want toemail. Choose Configure to configure the details of emailing the file(s). (Forinstructions on configuring email, see Email in Customizing and Configuring<strong>Opti</strong>-Insight).DeleteThis feature allows you to delete one or more patient data files. Each patient filecontains ALL the BP data for that patient; therefore ALL BP data for that patient will bedeleted.1. From the File menu, select Delete.2. A Delete – Choose File(s) dialog box appears. Select which BP data files todelete. Select or de-select items by clicking in the box beside the patient name.After you select all the files to be deleted, click OK to continue.3. A dialog box to confirm the deletion of these files is displayed. Select Yes tocontinue.29The exported files will be named after the <strong>Opti</strong>-Insight filename as either a *.ASC or*.GDT file depending on the format chosen.
30Converting patient data filesIf you have patient files from previous versions of <strong>Opti</strong>-Insight and you try to open orcopy them, a message appears requesting that you convert them to new encryptedfiles to enhance security of patient information.To convert patient data files:1. Begin to open or copy a patient file saved in a previous version of <strong>Opti</strong>-Insight.A message appears indicating that one or more patient files is not in a HIPPAcompliant format and requests that you convert them now.2. Do one of the following:• To convert all patient files at this point, we recommend that you first backup these files. Then, click Yes.• To not convert all patient files now, click No. If you choose not to convertthem, an asterisk (*) appears next to the patient file name in the list of filesto indicate files that have not been converted as encrypted files. Each timeyou launch <strong>Opti</strong>-Insight and open patient files saved in the previous format,the message to convert the files appears.Customizing and Configuring <strong>Opti</strong>-InsightIn one facility it might be helpful to have multiple configuration profiles for your users,for example, one for each physician in the practice or one for each service bureauclient.You can create or edit configuration profiles in <strong>Opti</strong>-Insight:1. From the Configure menu, select Preferences. Create a new profile or edit anexisting profile.2. Click on the name of the profile you want to edit and click Edit.3. To create additional profiles, click New, type in a name to identify the profile,click Enter, and then select Edit.4. Click OK to choose a configurationIf you are editing a configuration, a window opens that displays a number offunctions shown as tabs across the top of the window. These are described in detailon the following pages.NOTE: On each tab, clicking a Default button returns the settings of that tabto the default factory settings.Hardware SettingsThis window (Fig. 21) allows you to configureyour computer to communicate with your ABPmonitor. You may also test the settings that youhave selected to make sure it is operational.For complete instructions, see Configuring yourcomputer for Communication.1. Under ABP device, select the unit.2. Under Serial port, select the COM portinto which you have plugged the unit.NOTE: This is still required if using theUSB adapter.3. Click Test port. The unit will beep once,and you will receive a verification messagethat the port is properly configured.4. If you receive an error message, “Cannotcommunicate with ABP device,” one of thefollowing applies:• You have not selected the appropriateport or device.• The device is not connected properly.• There is no battery power in themonitor.• The USB adapter has not beeninstalled correctly.Fig. 20: Configuration listFig. 21: Configuration, Hardware31
32Data SettingsThis window (Fig. 22) includes the following features.• Default path: This is the foldercreated on your hard drive whenyou installed <strong>Opti</strong>-Insight. If youdo not want to save reports inthis folder, select another inthe tree (picture below) andit will automatically becomethe default. If you are creatingmultiple configurations, you maywant to set up a separate folderfor each profile. You can chooseto have <strong>Opti</strong>-Insight alwaysaccess this folder, access it onthe first search only, or accessthe last folder used. Changethis by selecting one of the threeFig. 22: Configuration, Datachoices shown.• Always prompt for study start time/date: Check this to have the softwareprompt you to enter the test date when you retrieve data collected by an ABPmonitoring device.• Show hints: Check this to view information about icons and graph features asyou work.• Auto-detect serial ports: Check this to have the system check for serial portconnections.To return all settings in this window to the factory defaults, click Default.33Color SettingsThis feature allows you to customize the color scheme of the graphs and chartsgenerated through each configuration profile you have created (Fig. 23). In largeorganizations, varying the color palette for each profile allows printed reports andonscreen data to be easily matched to the correct physician or client. Customizablepalettes also allow you to fine-tune the color scheme for optimum reproduction byyour office printers. Shading on the ABP graph indicates the period of the study. Thedefault colors (which can be changed using the Configuration > Colors tab) are thefollowing:• Sleep period: Shown in light gray shading and indicates the asleep period ofthe study.Here are the steps for customizing the color palette for a configuration profile:1. Click on the tab for the attributeyou want to change. In theexample shown here, the ABPgraph tab is selected, but thisfunction works identically foreach tab.2. To change a color, click on it. Acolor palette window will appear,showing 48 basic colors. Youmay select one of these, or youmay create your own customcolors by clicking on the DefineCustom Colors button.3. Repeat this process for eachcolor you want to change.Fig. 23: Configuration, Colors
34Diary Comment SettingsYou can use this feature to keeptrack of entries from patient diariesdescribing the patient’s activities duringBP measurements. The entries on thedefault list in this window (Fig. 24)correspond to the lists contained inpatient diaries. You can customize thislist by adding new entries or deletingsome of the default entries.The entries on your final list areincorporated into a list that appearsin the Comments column on the tablelocated on the ABP Data tab. Whenyou are processing a file, you can selectone of the entries from this menu withyour mouse instead of typing the text.(See Patient Diary Comments.)Fig. 24: Configuration, Diary CommentsEncryption <strong>Opti</strong>ons allow you to encryptyour emails with a key of your choosing,which you will need to make availableto the recipient of the email. Patientfiles are always encrypted. If the key isincluded in the file, any copy of <strong>Opti</strong>-Insight can open the file. To increasesecurity, uncheck the box for Include keyin file and type in an encryption key. Therecipient of the emailed file must havethe key to open the attached file.All bolded categories on the tab arerequired.Report SettingsThis feature allows you to format yourreports and to choose what informationis included in them.Fig. 26: Configuration, Report Formats35Email SettingsThe Email feature creates a new email message, attaches selected patient data files,and sends the email to its destination.To set up the parameters for email(Fig. 25):1. Choose the type of connection youare using by selecting LAN or Dialup.2. Fill in the Email server settings. Thisinformation is available from yourInternet service provider (ISP) oroffice network administrator. YourISP may require you to check theAuthorize box in order for you tosend email.3. The Email settings you fill in willappear in the header of youremail: the name of the recipient,your return email address, thesubject of the email and a messageof your choosing.Fig. 25: Configuration, EmailTo format a report:1. From the Configure menu, selectPreferences. Select the profile youwant to edit and click Edit.2. Click the Reports tab and then theFormats tab.3. Select which items will be includedin your One Page report, FullReport, and Standard Report. Selector de-select the check-boxes on theright to make these changes.4. To create a new report, click NewReport, enter a name of yourchoosing, and select the items youwant to appear in that report.Fig. 27: Configuration, Report Details5. To delete any of these reports,select the report and click Delete Report.6. Enter a Report Title by typing the title of your choice in the box provided. Thetitle appears as a header on each page of the report. Each report format allowsfor a different report title.7. As with the other features, return to factory settings by clicking Default.8. To change the graph type, graph scale, and report summary for your report,click Details. You can also change the number of horizontal sight lines shown inyour report to make it easier to read, or you can choose not to use them.
36Export SettingsThis feature allows you to export reports in an alternate format (Fig. 28), whichis useful when the data will be merged with a database. You can export reportsin either ASCII or GDT output. GDT is a format used to share computer medicalrecords.1. To configure exports to ASCII output, select options in these areas:• Delimiters: Choose which character will separate field items in thedatabase.• Export: Choose exactly what information will be exported.2. To configure this function for GDT output, do the following:• Select the Export GDT tab.• Click the GDT Summary checkbox.Overview of <strong>Opti</strong>-Insight Report SymbolsReport SymbolsThe following symbols are used in the Edited and Omitted BP data report pages.Symbol“t”“+”“-““r”“!”“>”ExplanationIndicates a reading was taken in the Office Test Mode.Indicates that the reading was initiated by pressing the Start/Stop keyon the monitor.Indicates that the pressure to which the cuff inflated in the dynamicinflation mode may have been too low to obtain an accurate systolicreading. Readings marked with “-” are automatically omitted from the<strong>Opti</strong>-Insight report. Compare the “tagged” BP reading marked witha “-” to the BP readings above and below it. If the omitted readingseems to be reasonable, “un-tag” it; if it does not seem reasonable,leave it “tagged”.Indicates that this reading was a retry reading. Retries are readingsthat are automatically obtained 4 minutes after a questionable readingis obtained by the monitor.The exclamation point is a permanent tag and is used when anaccurate reading can not be determined by the ABP monitor.This symbol will appear to the left of the measurement if the readingwas above the set threshold.37Fig. 28: Configuration, Export
38Overview of Event CodesAdministrative Tools39Event (EC) codes are used extensively in your decisions on editing BP data. The codesare displayed on the tables in the ABP Data tab and in the Edited and Omitted BPdata report pages in the columns labeled EC.• Event Codes describe the conditions under which the BP measurement wastaken. They are also accompanied by solutions that can be taken to avoid theiroccurrence in the future.NOTE: Codes do not automatically indicate that a reading is invalid; theyserve only as guides to help you edit data.Event Code DefinitionsEventDescription in <strong>Opti</strong>-InsightCodeSolution1Weak or no oscillometric signal Check the position of the cuff; tighten thecuff.2 Artifact/erratic oscillometric signal Remain still during the BP reading.3 Exceeded retry count (4 attempts) Remain still during the BP reading.485868788Exceeded measurement time limit (120seconds)Reading aborted (blocked valves orpneumatics)Reading aborted (user)Reading aborted (inflate timeout or airleak)Reading aborted (safety timeout)Check the air hose connections and makecertain the cuff is tight.Check the air hose connections and makecertain the air tubing is not crimped.Push the Start/Stop button to restart thereading.Check the air hose and cuff.Retry the reading by pushing the Start/Stopbutton. If the problem persists, return theunit for service.89 Reading aborted (cuff over-pressure) Check for blocks or kinks in the air hose.909197Service required (power supply out ofrange or other hardware problem)Service required (safety override fitted orautozero out of range)Service required (transducer out ofrange)Replace the batteries. If the problempersists, return the unit for service.Retry the reading by pushing the Start/Stopbutton. If the problem persists, return theunit for service.Return the unit for service.98 Service required (A/D out of range) Return the unit for service.99Service required (EEPROM calibrationdata CRC failure)The unit needs to be recalibrated. Returnfor service.<strong>Opti</strong>-Insight includes administrative tools thatimplement additional security-related features.With <strong>Opti</strong>-Insight Admin Tools, you can createnew user accounts, change user access levels(administrative or user access), reset userpasswords, enable the login process, and enableautomatic logging off after a specified timeelapses without user activity. Access to AdminTools requires administrative level login.Fig. 29: Admin Tools window(admin user name removed)Maintaining login options<strong>Opti</strong>-Insight includes the flexibility of enabling or disabling password login security.Enabling this option supports the HIPAA access protection requirements. If your facilityuses an Electronic Medical Record (EMR) system or another system that alreadyprovides login security, you may not want to enable the password control feature in<strong>Opti</strong>-Insight.When the password control feature is enabled, you can also enable an automaticlogoff feature that logs out a user who has not performed any activity in <strong>Opti</strong>-Insightafter a specified time has elapsed. You can enable or disable automatic logoff andyou can set the time.NOTE: All Admin Tools options require access from users who haveadministrative privileges.To enable login access:1. From the Configure menu, select Admin Tools. If you have not logged in as anadministrator or if the password control feature is not enabled, the Enter Nameand Password dialog window appears. Enter your administrative name andpassword and click OK. The Admin Tools window (Fig. 29) appears.NOTE: If this is the first time accessing Admin Tools, you must use the defaultuser name and password found on your <strong>Opti</strong>-Insight install CD (Fig. 30).2. Click the Use Passwords checkbox. A check indicates that the option is enabled.3. Click Done.NOTE: You must create a new Administrative user name and password beforedeleting the default administrator.
40To enable automatic logoff:NOTE: The password control feature must be enabled.1. From the Admin Tools window, click the Auto Logoff Enabled checkbox. A checkindicates that it is enabled.2. In the Auto Logoff Minutes box that appears after you check the Auto LogoffEnabled checkbox, enter the number of inactive minutes of inactivity that mustelapse before the user is automatically logged off. Alternatively, you can clickthe Up or Down arrows to select a number. You can set the number of minutesbetween 1 and 240 minutes; the default is 20 minutes.3. Click Done.<strong>Opti</strong>-Insight includes security featuresthat allow only an administrative usermaintain user account information.The administrator can add, modify,and delete user accounts.There are two types of useraccounts: administrator and user.The administrator has access toadministrative features such asenabling login access and enablingthe automatic logoff feature.The administrator can also reset userpasswords for individual users whohave forgotten their passwords.awpv3enableVersion 3.4Software Installation & <strong>User</strong> Manuals<strong>QRS</strong> <strong>Diagnostic</strong>Technology in Practice 6901 E. Fish Lake Road, Suite 188 | Maple Grove, MN, USA 55369800.465.8408 | +1.763.559.8492www.<strong>QRS</strong>diagnostic.com711000-00Fig. 30: <strong>Opti</strong>-Insight CD with <strong>User</strong> Nameand Password location. Check your CDlabel for actual default user name andpassword.NOTE: All Admin Tools options require access from users who haveadministrative privileges.611000-00B41Adding user accountsYou can add new user accounts quickly and easily. An administrator can create auser at either an administrative or user level. Each new user is assigned a defaultpassword of “user”. When new users first log in, they must change the defaultpassword before they can perform any tasks in <strong>Opti</strong>-Insight (Fig 31). This applies toboth administrative and user accounts.1. From the Configure menu, select Admin Tools.2. If you have not logged in as anadministrator or if the password controlfeature is not enabled, the Enter Nameand Password dialog window appears.Enter your administrative name andpassword and click OK. The Admin Toolswindow appears.3. Click New <strong>User</strong>.4. In the <strong>User</strong> Name field that appears, enterthe new user login name. The newly addeduser automatically has his or her passwordset to the default “user”. When loggingin for the first time, the new user will beprompted to change the password.5. Click OK.Fig. 31: Admin Tools window,adding user6. To change the level of user, select the user then click Change Level. This optiontoggles the user level that appears in the Level column between <strong>User</strong> andAdmin.7. Click Done.Changing user levelYou can change user account levels to either administrative or user privileges. Youcan not change user names.1. From the Configure menu, select Admin Tools.2. If you have not logged in as an administrator or if the password control featureis not enabled, the Enter Name and Password dialog window appears. Enteryour administrative name and password and click OK. The Admin Tools windowappears.3. Click the user account you want to change.4. To change the level of user, click Change Level. This option toggles the user levelthat appears in the Level column between <strong>User</strong> and Admin.5. Click Done.
42Deleting user accountsYou can delete both administrative and user accounts; however, you can not deletean administrator account if it is the only existing one. You also cannot delete yourself.Deleting a user account prevents the user from logging into <strong>Opti</strong>-Insight, if thepassword control feature is enabled.1. From the Configure menu, select Admin Tools.2. If you have not logged in as an administrator or if the password control featureis not enabled, the Enter Name and Password dialog window appears. Enteryour administrative name and password and click OK. The Admin Tools windowappears.3. Click the user account you want to delete.4. Click Delete <strong>User</strong>.5. A confirmation message appears. Click Yes to continue deleting the useraccount.6. Click Done.Resetting user passwordsWhen a user forgets his or her password, that user must contact the systemadministrator, who will reset the user’s password to the default password of “user.”When he or she first logs in again, the user must change the default password beforebeing able to perform any tasks in <strong>Opti</strong>-Insight.1. From the Configure menu, select Admin Tools.2. If you have not logged in as an administrator or if the password control featureis not enabled, the Enter Name and Password dialog window appears. Enteryour administrative name and password and click OK. The Admin Tools windowappears.3. Click the user account you want to change.4. Click Reset Password.5. Click Yes to confirm resetting the password.6. A confirmation message appears, click OK.7. Click Done.<strong>Opti</strong>-Insight Technical AssistanceFor any questions, please reference the Help section within <strong>Opti</strong>-Insight or ourwebsite for constant product updates. If these do not fully address your problem,please contact our service department.For more detailed assistance, please refer to this <strong>Opti</strong>-Insight <strong>User</strong>’s <strong>Guide</strong> orcontact <strong>QRS</strong> Customer Care.<strong>QRS</strong> <strong>Diagnostic</strong>6901 E. Fish Lake Road, Suite 188Maple Grove, MN 55369 USATel: +1.800.465.8408 or+1.763.559.8492Fax: +1.763.559.2961Safety<strong>QRS</strong> is responsible for the safety, reliability, and performance of its equipmentprovided that the following conditions exist:Assembly operations, extensions, readjustments, modifications and repairs arecarried out by <strong>QRS</strong> authorized personnel. The electrical installation of the relevantroom complies with all Local, State, and Federal building and electrical codes. Allequipment is used in accordance with instructions for its use.Contact <strong>QRS</strong> for information before connecting any devices not mentioned in this<strong>Opti</strong>-Insight <strong>User</strong>’s <strong>Guide</strong>.To ensure patient safety, use only parts and accessories manufactured orrecommended by <strong>QRS</strong>.43
6901 E. Fish Lake Road, Suite 188 | Maple Grove, MN 55369+1.800.465.8408 | +1.763.559.8492 | Fax +1.763.559.2961info@<strong>QRS</strong>diagnostic.com | www.<strong>QRS</strong>diagnostic.comRelease Date: 03/12Advena Ltd33 Bridge St.Hereford HR4 9DQUK610000-00A0086