A Cost-Benefit Analysis of Community-Based Disaster Risk ...
A Cost-Benefit Analysis of Community-Based Disaster Risk ...
A Cost-Benefit Analysis of Community-Based Disaster Risk ...

You also want an ePaper? Increase the reach of your titles
YUMPU automatically turns print PDFs into web optimized ePapers that Google loves.
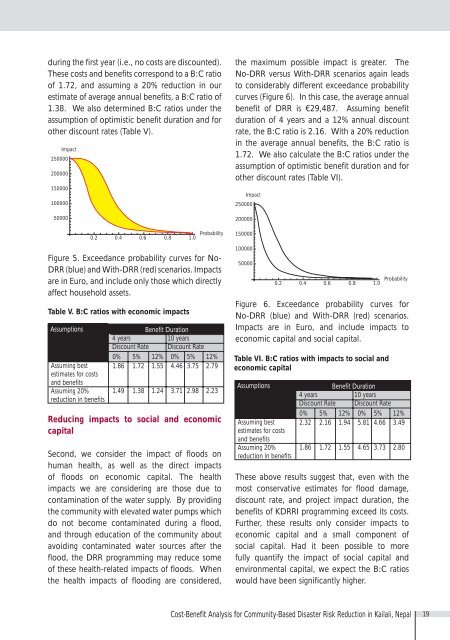
during the first year (i.e., no costs are discounted).These costs and benefits correspond to a B:C ratio<strong>of</strong> 1.72, and assuming a 20% reduction in ourestimate <strong>of</strong> average annual benefits, a B:C ratio <strong>of</strong>1.38. We also determined B:C ratios under theassumption <strong>of</strong> optimistic benefit duration and forother discount rates (Table V).Impact25000020000015000010000050000the maximum possible impact is greater. TheNo-DRR versus With-DRR scenarios again leadsto considerably different exceedance probabilitycurves (Figure 6). In this case, the average annualbenefit <strong>of</strong> DRR is €29,487. Assuming benefitduration <strong>of</strong> 4 years and a 12% annual discountrate, the B:C ratio is 2.16. With a 20% reductionin the average annual benefits, the B:C ratio is1.72. We also calculate the B:C ratios under theassumption <strong>of</strong> optimistic benefit duration and forother discount rates (Table VI).Impact2500002000000.2 0.4 0.6 0.8 1.0Probability150000Figure 5. Exceedance probability curves for No-DRR (blue) and With-DRR (red) scenarios. Impactsare in Euro, and include only those which directlyaffect household assets.Table V. B:C ratios with economic impactsAssumptionsAssuming bestestimates for costsand benefitsAssuming 20%reduction in benefits<strong>Benefit</strong> Duration4 years 10 yearsDiscount Rate Discount Rate0% 5% 12% 0% 5% 12%1.86 1.72 1.55 4.46 3.75 2.791.49 1.38 1.24 3.71 2.98 2.23Reducing impacts to social and economiccapitalSecond, we consider the impact <strong>of</strong> floods onhuman health, as well as the direct impacts<strong>of</strong> floods on economic capital. The healthimpacts we are considering are those due tocontamination <strong>of</strong> the water supply. By providingthe community with elevated water pumps whichdo not become contaminated during a flood,and through education <strong>of</strong> the community aboutavoiding contaminated water sources after theflood, the DRR programming may reduce some<strong>of</strong> these health-related impacts <strong>of</strong> floods. Whenthe health impacts <strong>of</strong> flooding are considered,100000500000.2 0.4 0.6 0.8 1.0ProbabilityFigure 6. Exceedance probability curves forNo-DRR (blue) and With-DRR (red) scenarios.Impacts are in Euro, and include impacts toeconomic capital and social capital.Table VI. B:C ratios with impacts to social andeconomic capitalAssumptionsAssuming bestestimates for costsand benefitsAssuming 20%reduction in benefits<strong>Benefit</strong> Duration4 years 10 yearsDiscount Rate Discount Rate0% 5% 12% 0% 5% 12%2.32 2.16 1.94 5.81 4.66 3.491.86 1.72 1.55 4.65 3.73 2.80These above results suggest that, even with themost conservative estimates for flood damage,discount rate, and project impact duration, thebenefits <strong>of</strong> KDRRI programming exceed its costs.Further, these results only consider impacts toeconomic capital and a small component <strong>of</strong>social capital. Had it been possible to morefully quantify the impact <strong>of</strong> social capital andenvironmental capital, we expect the B:C ratioswould have been significantly higher.<strong>Cost</strong>-<strong>Benefit</strong> <strong>Analysis</strong> for <strong>Community</strong>-<strong>Based</strong> <strong>Disaster</strong> <strong>Risk</strong> Reduction in Kailali, Nepal 19