A Cost-Benefit Analysis of Community-Based Disaster Risk ...
A Cost-Benefit Analysis of Community-Based Disaster Risk ...
A Cost-Benefit Analysis of Community-Based Disaster Risk ...

You also want an ePaper? Increase the reach of your titles
YUMPU automatically turns print PDFs into web optimized ePapers that Google loves.
ForewordAs the world faces an increase in the frequency and severity <strong>of</strong> natural hazards, assistance organizationscontinue to struggle to meet the challenges posed by scarce economic resources and competingdevelopment priorities. Mercy Corps works in many countries around the world, implementing programsthat help communities prepare for and become more resilient to natural disasters. We believe it is necessaryto evaluate our work not only in terms <strong>of</strong> its immediate impact, but also from an economic standpointas we determine how best to protect development investments made by communities and those whosupport them.Mercy Corps views <strong>Disaster</strong> <strong>Risk</strong> Reduction (DRR) is an essential part <strong>of</strong> our mission to help peoplebuild secure, productive and just communities and therefore incorporates DRR strategies to helpcommunities become more resilient to hazards and reduce the likelihood that their development maybe undermined by one or more disasters. With this in mind, Mercy Corps is pleased to present the first<strong>Cost</strong> <strong>Benefit</strong> <strong>Analysis</strong> undertaken for one <strong>of</strong> our DRR programs.This <strong>Cost</strong> <strong>Benefit</strong> <strong>Analysis</strong> was undertaken to provide Mercy Corps with a quantitative analysis tocomplement the qualitative benefits that we have observed throughout the life <strong>of</strong> our DRR project whichis being implemented in Nepal. The Kailali <strong>Disaster</strong> <strong>Risk</strong> Reduction Initiatives (KDRR) project, at theheart <strong>of</strong> this study, assists riverside communities in the far western Kailali District <strong>of</strong> Nepal where we areworking in cooperation with the Nepali Red Cross Society (NRCS) Kailali District Chapter. The project isfunded by ECHO, under its DIPECHO Fourth and Fifth Action Plans for South Asia, and includes localcapacity building and training for community disaster management committees, the development <strong>of</strong>early warning systems, small scale mitigation works, and support to young rescuers clubs in schools thatare devoted to learning about and passing on knowledge <strong>of</strong> disaster risk management.Mercy Corps would like to thank all those who made this cost benefit analysis possible, including: thecommunity <strong>of</strong> Bisanpur where this study was carried out; Bo White and Molly Rorick, the co-authors<strong>of</strong> this study; Yale University’s School <strong>of</strong> Forestry and Environmental Studies, for continuing to provideMercy Corps with excellent research assistance; the Mercy Corps Nepal team implementing the Kailali<strong>Disaster</strong> <strong>Risk</strong> Reduction Initiatives project, especially the project manager Ulla Dons; ECHO and itsDIPECHO Fourth and Fifth Action Plans for South Asia; and the Emergency Capacity Building (ECB) 3Project, funded by the Bill and Melinda Gates Foundation, for providing funding support for this study.As we continue to learn from our DRR activities and develop tools to better measure impact, MercyCorps will refine and adapt program methodologies to ensure that we are doing our best work to helpcommunities protect their development gains, prepare for the effects <strong>of</strong> climate change, and save livesand livelihoods.Susan RomanskiDirector, <strong>Disaster</strong> <strong>Risk</strong> Reduction, Mercy Corps20103 The Emergency Capacity Building (ECB) Project is a partnership between CARE, CRS, Mercy Corps, Oxfam, Save the Childrenand World Vision. The ECB Project aims to improve the speed, quality, and effectiveness <strong>of</strong> the humanitarian community insaving lives, improving welfare, and protecting the rights <strong>of</strong> people in emergency situations. Visit www.ecbproject.org or e-mailinfo@ecbproject.org for more information<strong>Cost</strong>-<strong>Benefit</strong> <strong>Analysis</strong> for <strong>Community</strong>-<strong>Based</strong> <strong>Disaster</strong> <strong>Risk</strong> Reduction in Kailali, Nepal 3
I. Introduction<strong>Cost</strong> benefit analysis (CBA) is a tool that businesses, NGOs, and governmentorganizations commonly use to estimate the efficiency <strong>of</strong> a given project, comparecompeting options, and more easily comprehend the costs and benefits <strong>of</strong> a course<strong>of</strong> action. More recently, CBA is being used in the field <strong>of</strong> natural disaster risk managementto determine whether preparedness activities in a community before a potential naturaldisaster occurs provide substantial benefits that can reduce the need for costly responseefforts after an emergency. NGOs and development agencies tend to argue that preparednessactivities, especially in disaster prone or poor communities, are important for both protectingdevelopment investments and avoiding costly post-disaster aid. Donor institutions, on theother hand, faced with uncertain quantitative information on the net economic and socialbenefits for disaster risk reduction (DRR) projects, tend to conserve scarce resources foremergency response as opposed to DRR interventions . Demonstrating the benefits <strong>of</strong> DRRthrough quantitative methodologies such as CBA could allow funders to see the true value <strong>of</strong>these interventions. 5The cost-effectiveness <strong>of</strong> a given DRR project willdepend on many factors, such as the frequencyand magnitude <strong>of</strong> disasters (floods, earthquakes,volcano eruptions, landslides, etc.), the ability topredict where they will occur, the extent to whichcommunities are impacted given a disaster, andthe cost <strong>of</strong> the intervention. Such factors canvary widely; thus, it is important that the costeffectiveness <strong>of</strong> DRR projects are evaluated intheir context or compared to CBAs that wereconducted under similar contexts. To date, thevast majority <strong>of</strong> DRR CBAs have been carriedout in environments where there is plentifuldata available either from extensive surveying <strong>of</strong>educated populations that can reliably provideinformation regarding the monetary value <strong>of</strong>various forms <strong>of</strong> capital, or where the benefits<strong>of</strong> a DRR project are otherwise more easily anddirectly quantifiable into monetary amounts 6 .Such CBA studies typically evaluate large scaleDRR interventions (e.g., retr<strong>of</strong>itting a subwaysystem for earthquakes), and are generally carriedout by pr<strong>of</strong>essional consulting firms or throughsuch agencies as the World Bank, the FederalEmergency Management Agency (FEMA), and theUnited Nations.There are very few examples <strong>of</strong> community levelDRR interventions being evaluated using CBA.<strong>Community</strong> level DRR CBAs, particularly indeveloping countries or in remote communities,provide an additional set <strong>of</strong> constraints suchas limited person-hours and financing for anyassessment process, a scarcity <strong>of</strong> available datafrom reliable government or NGO sources,and a partially or wholly illiterate population <strong>of</strong>beneficiaries. Thus, while many DRR CBAs beginat the level <strong>of</strong> data analysis, community-basedDRR CBAs such as this one start at the level <strong>of</strong>data collection.5 Benson, C., and J. Twigg (2004), “Measuring mitigation”: Methodologies for Assessing Natural Hazard <strong>Risk</strong>s and the Net<strong>Benefit</strong>s <strong>of</strong> Mitigation - A Scoping Study, International Federation <strong>of</strong> the Red Cross and Red Crescent Societies, ProVentionConsortium.6 Examples <strong>of</strong> these can be found on the prevention website such as the World Bank Earthquake Vulnerability ReductionProgram in Colombia or A Case Study <strong>of</strong> Caribbean Infrastructure Projects that have Failed Due to the Effects <strong>of</strong> NaturalHazards, OAS (1998). See http://www.proventionconsortium.org/?pageid=26#projects<strong>Cost</strong>-<strong>Benefit</strong> <strong>Analysis</strong> for <strong>Community</strong>-<strong>Based</strong> <strong>Disaster</strong> <strong>Risk</strong> Reduction in Kailali, Nepal 5
II. Theoretical Approaches to <strong>Community</strong>-<strong>Based</strong> CBAsFor a community-based DRR CBA, one needs to compare the impact <strong>of</strong> disasters withand without DRR interventions. There are three different approaches that can be used toobtain data for these two different situations.1. Hypothetical Approach- In order to perfectlycontrol for particularities <strong>of</strong> individual communitiesand differences in disaster magnitudes, youcan compare the impact <strong>of</strong> a given disaster in acommunity with DRR to the hypothetical impact<strong>of</strong> this same disaster in this same community had itnot had the DRR programming. This is a so-called“backward looking” method. It is also possibleto perform a so-called “forward-looking” CBAin order to evaluate a potential DRR project, bycomparing the realized impacts in a communitywithout DRR programming to the hypotheticalimpacts <strong>of</strong> the same disaster in that communityhad there been DRR. Obviously, the limitation<strong>of</strong> the Hypothetical Approach is that it relies oninferences <strong>of</strong> impact, rather than realized impactsand these may be <strong>of</strong> questionable accuracydepending on the circumstances. On the otherhand, in some cases it may be very obvious howDRR influences disaster impacts, so hypotheticallosses with or without DRR may be easy to assessaccurately.2. Comparative Approach- In theory, it is possibleto compare two different communities: one withand one without DRR. This is especially possibleif the effective magnitude <strong>of</strong> disasters is exactlythe same in the two communities. However, theeffective disaster magnitude may be different inthe two different locations, even when comparingthe same disaster event and so one needs someway <strong>of</strong> assessing “effective disaster magnitude”(<strong>of</strong> course, this index must be independent<strong>of</strong> impact, because this is also a factor <strong>of</strong>DRR programming!). If the relative effectivemagnitudes <strong>of</strong> the disasters can be accuratelyassessed for the two communities, then it ispossible to use such data for the construction <strong>of</strong>“Non-DRR” and “With-DRR” impact curves. 7 Thecomparative method is appropriate if you havedata for a very limited number <strong>of</strong> disasters, orif you have extremely comparable communitiesthat only differ by whether they have DRR. Suchcomparable communities would probably be verylarge and homogenous, very close to each other,and affected by disasters in highly similar ways.3. Before-and-After Approach- The third optionfor community-based DRR CBAs is comparingimpact data from the same community forsimilar disasters occurring before and after DRRprogramming. The limitation <strong>of</strong> this optionis that impact data for pre-DRR programmingdisasters may not be available in the same formator conducted with the same methodology asthe impact data that is consistently collectedimmediately following a disaster occurring in acommunity where Mercy Corps has conductedDRR activities. The best practice for derivingaccurate impact information from disasters thathave already occurred, but may not have beenformally surveyed at the time, is to utilize multiple7 However it is good to have data on similar magnitude disasters for both DRR and Non-DRR communities. This allows oneto have data points at about the same places along the x-axis <strong>of</strong> the I[M] curve (impact as a function <strong>of</strong> disaster magnitude),so that systematic errors in the assumed relationship between magnitude and probability affect the With-DRR and Non-DRRexceedance probability curves in the same way. This will minimize the error in the final result. Alternatively, it is even betterto simply have data for a large range <strong>of</strong> disaster magnitudes for both With-DRR and Non-DRR communities, so that your With-DRR and Non-DRR models for I[M] are high quality.6<strong>Cost</strong>-<strong>Benefit</strong> <strong>Analysis</strong> for <strong>Community</strong>-<strong>Based</strong> <strong>Disaster</strong> <strong>Risk</strong> Reduction in Kailali, Nepal
information gathering methods such as communitymember surveys, key informant interviews andsecondary data research. 8 Mitigating factors suchas political and economic changes, separate fromthe DRR activities carried out between the twodisasters, must also be accounted for in the finalCBA results. A challenge with the Before-and-After Approach is the assumption that nothingbesides the implementation <strong>of</strong> DRR has changedin the community between the two disasters,and this is most likely not the case. For example,impacts “before” might be less than “after” dueto an exogenous change in people’s livelihoodsthat is nothing to do with DRR programming. Inaddition, because one <strong>of</strong> the main goals <strong>of</strong> DRRprogramming is to make a community more aware<strong>of</strong> the impacts <strong>of</strong> disasters, there is a recognitionthat greater awareness <strong>of</strong> DRR strategies maytranslate to a more thorough reporting <strong>of</strong> impacts.On the other hand, there is the possibility thatimpacts before DRR programming will beless accurate after DRR programming simplybecause pre-DRR disasters occurred longer ago.Therefore, when implementing the Before-and-After Approach, it is important to try to controlfor these potentially confounding variablesas best as possible. Further, we recommendthat the Hypothetical Approach be implementedin addition to either the Comparative Approachor the Before-and-After Approach to account forchanges in perception following DRR training.Our General ApproachFor this study, we are using the backward-lookingHypothetical Approach. This approach waschosen due to the fact that the DRR programminglocation (the Bisanpur village) was small enough,and the project managers insightful enough, thatwe could confidently asses what the impact on thecommunity would have been had there not beenDRR programming. Furthermore, we wanted toavoid the “information-DRR association problem”mentioned above. Lastly, the quantitative CBAportion <strong>of</strong> this assessment does not include any<strong>of</strong> the indirect impacts <strong>of</strong> the flooding. Here wedefine indirect impacts as any impacts whichoccur more than a year after the flood.8Post <strong>Disaster</strong> Surveys: experience and methodology http://www.ema.gov.au/www/emaweb/rwpattach.nsf/VAP/(99292794923AE8E7CBABC6FB71541EE1)~Post+disaster+surveys.pdf/$file/Post+disaster+surveys.pdf<strong>Cost</strong>-<strong>Benefit</strong> <strong>Analysis</strong> for <strong>Community</strong>-<strong>Based</strong> <strong>Disaster</strong> <strong>Risk</strong> Reduction in Kailali, Nepal 7
III. Project ContextThe Kailali <strong>Disaster</strong> <strong>Risk</strong> Reduction Initiative (KDRRI)Floods and other weather related disasters are a major factor contributing to endemicpoverty in Nepal and this is likely to increase as climate change proceeds. Preparednessrequires the ability to forecast when a disaster is likely to occur and people needknowledge <strong>of</strong> risk, mechanisms <strong>of</strong> communication to inform about disasters, and equipmentto monitor the advent <strong>of</strong> a disaster. The Nepal Red Cross Society (NRCS) - Kailali DistrictChapter and Mercy Corps Nepal have implemented two consecutive projects in the Far-Western Development Region <strong>of</strong> Nepal in order to prepare communities for weather relatedhazards.In the first project, the Kailali <strong>Disaster</strong> <strong>Risk</strong>Reduction Initiatives was implemented in sixcommunities <strong>of</strong> the Far-Western DevelopmentRegion <strong>of</strong> Nepal between November 2007 andApril 2009. The project was supported by theEuropean Commission via its Humanitarian Aiddepartment (DG ECHO) under the DIPECHOFourth Action Plan for South Asia 9 . The statedaim <strong>of</strong> the project was to build safer communitiesthrough DRR initiatives in collaboration withcommunities, local governments and other keystakeholders. Project interventions included localcapacity building and training, early warningsystems, small-scale mitigation, education, andfacilitation <strong>of</strong> coordination. These activities werelater expanded to an additional ten communitiesthrough KDRRI II under the DIPECHO FifthAction Plan for South Asia.Primary problems faced by the communitiessupported under the KDRRI projects areinundation <strong>of</strong> settlement areas, erosion <strong>of</strong> riverbanks on the receding flood and aggravatingthe shifting tendencies <strong>of</strong> the river courses. Theproject is multi-sectored and relies on a mix <strong>of</strong>capacity building, physical and early warninginterventions. The KDRRI work focuses heavilyon capacity building to drive DRR within thecommunities. Thus capacity building includesthe establishment <strong>of</strong> <strong>Disaster</strong> PreparednessCommittees (DPC), comprising members electedby the community, as well as smaller groups withspecific responsibilities (e.g. a search and rescue,early warning, first aid, construction, nurserymanagement teams). These committees alongwith youth representatives, student and teachersare trained in community-based DRR, first aid,search and rescue, early warning, communitymanagement and leadership. Each communityhas created an emergency and maintenancefund. Households commit to donating a certainsum 10 <strong>of</strong> money or amount <strong>of</strong> grain each month.These savings are deposited in a local bank andsupervised by DPC members. The communitymaintains control over the funds, and uses themfor agreed activities, such as relief support fordisaster affected households in the communityor even in neighboring communities and for9 The principal objective <strong>of</strong> the DIPECHO Action Plan for South Asia is to increase the awareness and the response capacity<strong>of</strong> local communities and institutions to potential and recurrent natural disasters and to reduce the effects <strong>of</strong> these disasterson the most vulnerable by supporting strategies that enable local communities and institutions to better prepare for andmitigate natural disasters by enhancing their capacity to cope, thereby increasing resilience and decreasing vulnerability andby strengthening the level <strong>of</strong> coordination, information sharing and advocacy at national and regional level.http://www.evd.nl/zoeken/showbouwsteen.asp?bstnum=192489&location=10 Monthly contribution for the funds is based on decisions made by the individual communities and differs from five to tenrupees (Euro 0.05-0.10) per house hold.8<strong>Cost</strong>-<strong>Benefit</strong> <strong>Analysis</strong> for <strong>Community</strong>-<strong>Based</strong> <strong>Disaster</strong> <strong>Risk</strong> Reduction in Kailali, Nepal
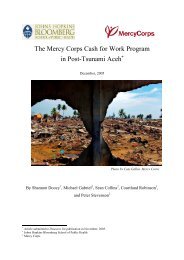
NRCS and Mercy Corps staff felt that it wasthe most representative <strong>of</strong> the greater KDRRI.Furthermore, this community did not in any wayreceive a disproportionately high portion <strong>of</strong> thefunding and staff devoted to the KDRRI project asa whole. If anything, Bisanpur represented one<strong>of</strong> the most modest financial investments, so theproject cost for this community (estimated at onesixth <strong>of</strong> the total KDRRI budget for the purposes<strong>of</strong> this CBA) is highly conservative.The village <strong>of</strong> Bisanpur is located in the Kailalidistrict <strong>of</strong> Nepal’s far west Tarai region. Bisanpuris comprised <strong>of</strong> 275 individuals, living within 30households. All the residents <strong>of</strong> Bisanpur aremembers <strong>of</strong> the Tharu ethnic group. They areprimarily subsistence farmers; however, theyare currently only able to produce enough foodto feed their community for four months out <strong>of</strong>the year. Low agricultural productivity is due totraditional cultivation practices (communitiesrely heavily on rain-fed agriculture and lackfunds for irrigation systems, fertilizer or highquality seed, etc.), fragmented land holdings, anddecreased soil quality from recent flooding andsubsequent siltation. The majority <strong>of</strong> the men inthe community must find seasonal manual laborjobs to earn enough money for food for theremaining eight months <strong>of</strong> the year. In pastyears these men have generally migrated toIndia or the Nepali border town <strong>of</strong> Dangharifor such work; however other Mercy Corpsprojects in the local area (i.e. “Cash forWork” 12 ) have recently provided anothermeans to earn this extra income, which alsoallows them to simultaneously work their ownfields, take care <strong>of</strong> their children, etc.Bisanpur is located immediately next to theMohana River. When the river floods, waterand silt first flood a large swath <strong>of</strong> agriculturalland, and riverbanks are eroded by thefloodwater. Bisanpur has a main road which iselevated, and serves to protect the village fromthe flooding in the agricultural fields. However,during severe floods, the river proceeds to breakthrough this barrier and flood the low portion <strong>of</strong>the village. This low portion contains 11 <strong>of</strong> thevillage’s 30 houses. The 2065 (Nepali calendar)/2008 (Gregorian calendar) flood depositedseveral feet <strong>of</strong> silt on their agricultural fields andthen also broke through the road, flooding these11 houses. This flood destroyed the entire ricecrop for that year (which was nearing the harvestseason at the time), and it also prevented thatyear’s wheat harvest because <strong>of</strong> the inability for thesandy soil to retain enough water for agriculture.Furthermore, according to community members,this land remains at only about 20% <strong>of</strong> its originalproductivity, and the people <strong>of</strong> Bisanpur can nolonger use the land for rice and wheat cultivation.Instead, this land is used only for “river bed”crops, such as cucumber and water melon. Thesecrops are highly perishable, so while they couldtheoretically provide income for the communityif sold, the production volumes and availablemarket linkages are not conducive to significantsales. Furthermore, because the river bed cropsare low-calorie food items and cannot be storedwell, they cannot serve as a significant food sourcefor the community members.Flooding, September 200912 Supported by the World Food Programme (WFP) between November 2008 and June 2010.10<strong>Cost</strong>-<strong>Benefit</strong> <strong>Analysis</strong> for <strong>Community</strong>-<strong>Based</strong> <strong>Disaster</strong> <strong>Risk</strong> Reduction in Kailali, Nepal
IV. MethodologyMethodological decisionsBefore data collection for a CBA can proceed, the following must be determined:• The definition <strong>of</strong> a disaster event within the local context• The time unit by which disaster risks and impacts are to be assessed• The resolution <strong>of</strong> the impact assessment data (e.g., community level, households)• The spatial scale at which the CBA will be conducted (e.g., single village)• The forms <strong>of</strong> capital to be included into cost and benefit calculations (e.g., economic, social,environmental)In the case <strong>of</strong> this CBA, because floods are common (there are <strong>of</strong>ten multiple floods ina single year), and naturally separated by the dry seasons, disaster events are definedhere as flood years, according to the Nepali lunar year. The magnitude <strong>of</strong> the disasteris defined as the magnitude <strong>of</strong> the largest flood in that year, and the impacts include theconsequences <strong>of</strong> all floods during that year (however, the subtleties <strong>of</strong> these definitions werenot extremely important in practice, because most flood years are dominated by a single highmagnitudeflood.) Data was collected at a detailed level, using surveys to inventory impactsas completely as possible from a large proportion <strong>of</strong> the community (~40%). It was decidedthat this fine-grained approach to impact assessment was important in this case, because theinitial qualitative assessments indicated that personal asset losses constituted a major portion<strong>of</strong> the disaster impact. Losses to these forms <strong>of</strong> capital are impossible to inventory withoutextensive survey and interview methods. This approach meant that the CBA could not beconducted across all <strong>of</strong> the communities targeted by the DRR project. Thus, this CBA is a study<strong>of</strong> the cost effectiveness <strong>of</strong> the DRR project in the one community <strong>of</strong> Bisanpur. Nevertheless,to the extent that the DRR programming in Bisanpur is representative <strong>of</strong> how the program hastaken shape in all six communities, these results can be applied to the evaluation <strong>of</strong> the KDRRIproject as a whole.Impact AssessmentIn order to conduct a DRR CBA, the impact(damages) as a function <strong>of</strong> disaster magnitudeneeds to be assessed and quantified.Only some forms <strong>of</strong> impact can be appropriatelyincorporated into a CBA. For one thing, they mustbe quantifiable into monetary values so that the costsand benefits can be compared in the same units.Another consideration is that the forms <strong>of</strong> capitalincluded in the costs and benefits must be consistent.For example, if the costs associated with time orlabor contributions by locals are not considered intoproject costs, then the calculation <strong>of</strong> disaster impactsshould, similarly, exclude such labor costs.Other types <strong>of</strong> impact are appropriate forconventional CBAs, but not risk-based CBAs.These include impacts which manifest after theoccurrence <strong>of</strong> another disaster. For the purposes<strong>of</strong> this CBA, because disasters are defined as allthe floods occurring in one Nepali lunar year,and because floods have a reasonable chance <strong>of</strong>occurring annually, impacts that occur after theflood year were not included.<strong>Cost</strong>-<strong>Benefit</strong> <strong>Analysis</strong> for <strong>Community</strong>-<strong>Based</strong> <strong>Disaster</strong> <strong>Risk</strong> Reduction in Kailali, Nepal 11
Though unquantifiable and non-additive impactscannot be incorporated into the quantitativeportion <strong>of</strong> the CBA, they should nevertheless beincluded in the qualitative benefits to accompanythe quantitative CBA results and interpretation.Lastly, it is important to keep in mind that themodeling approach developed for this CBArequires the specification <strong>of</strong> a “maximum possibleimpact” (i.e. the impact caused by an arbitrarilylarge disaster), and that the same forms <strong>of</strong> capitalmust be included in this calculation as in thecalculation <strong>of</strong> impacts from specific floods. Forexample, if one decides to include “lives lost”into impact calculations, the maximum possibleimpact must include the value <strong>of</strong> all possible livesthat could be lost.Forms <strong>of</strong> capitalIn general, there are three types <strong>of</strong> capital that areimpacted (directly and indirectly) from a naturaldisaster: economic, social, and environmental.• Economic capital refers to those components<strong>of</strong> society that are generally thought <strong>of</strong> ashaving economic or material worth. Examples<strong>of</strong> economic capital that are <strong>of</strong>ten affected bynatural disasters include: household income,infrastructure (roads, electricity), buildings,homes, vehicles, crops, savings, personalbelongings, etc.• Social capital generally refers to social relationsand connections that have productive benefits.Examples <strong>of</strong> social capital that are directlyaffected by natural disasters include: loss <strong>of</strong> life,injuries, or cultural/religious items. Examples<strong>of</strong> social capital <strong>of</strong>ten indirectly affectedinclude: disease occurrence (i.e. typhoid,malaria, cholera, etc.), school attendance,physiological disorders such as stress anddepression, and loss <strong>of</strong> living environments orsocial contacts and relationships.• Environmental capital refers to attributes <strong>of</strong>the natural environment that contribute tothe productivity <strong>of</strong> the community, as well asthose that can be considered to have intrinsicvalue. Examples <strong>of</strong> environmental capital thatcan be impacted by natural disasters includewater quality, soil productivity, air quality,biodiversity, natural habitats, etc.Data Sources for With-DRR ImpactAssessmentGiven time constraints and methodologicalcomplexities, it is not possible to address allpossible components <strong>of</strong> each form <strong>of</strong> capitalin a DRR CBA. The number <strong>of</strong> components isfurther reduced when working at the communitylevel in remote villages such as Bisanpur. Thus,it is important to establish the scope <strong>of</strong> the datacollection that is: What data can be accuratelyand realistically collected?To date, most DRR CBAs measure the impacton economic, social, and environmental capitalusing data compiled by government organizations(local, regional, and national), industries, NGOs,and disaster management authorities. In theKailali district <strong>of</strong> Nepal, however, statistical datais sparse, and at the village level it is virtually nonexistent13 . Despite these challenges, we assessimpact at the focal level <strong>of</strong> the village for thepurposes <strong>of</strong> this CBA. Given the limitations <strong>of</strong>any single data collection method, it is importantto corroborate data from multiple sources andstakeholders. In the case <strong>of</strong> the Kailali DRRCBA, impact data collection was primarilytargeted at (1) village members through the13 After the majority <strong>of</strong> the analysis was complete, we discovered that detailed impact data was collected by Mercy Corps atthe village level for one <strong>of</strong> the flood years. This data was not incorporated into this assessment primarily because it was onlyavailable for a single flood year, however, this type <strong>of</strong> data would be ideal for future CBAs. We therefore strongly encouragethe continued collection <strong>of</strong> the same data in the future.12<strong>Cost</strong>-<strong>Benefit</strong> <strong>Analysis</strong> for <strong>Community</strong>-<strong>Based</strong> <strong>Disaster</strong> <strong>Risk</strong> Reduction in Kailali, Nepal
disaster preparedness committee (DPC) Survey14, (2) project managers and community leadersthrough the Project Manager (PM) Survey 15 , (3)available data through Mercy Corps, Red Cross,and government statistics, and (4) qualitativeassessments and site visits conducted by theresearch team to corroborate survey data and t<strong>of</strong>ill data gaps.1. <strong>Disaster</strong> Preparedness Committee(DPC) surveyA survey consisting <strong>of</strong> 16 questions was used tocollect data on the impact <strong>of</strong> both the 2065/2008and 2066/2009 floods in Bisanpur. 16 Intervieweeswere restricted to members <strong>of</strong> the BisanpurDPC and were asked to answer questions froma household perspective (i.e., “what belongingsdid your household lose” as opposed to “whatbelongings did you lose?”). Questions weredirected at determining specifics on household’sannual crop production and other income, worth<strong>of</strong> assets, belongings lost or damaged during thefloods, replacement costs <strong>of</strong> damaged items,and any health and education costs that resultedfrom the floods. English and Nepali versions <strong>of</strong>the survey are available from Mercy Corps Nepalupon request.The design <strong>of</strong> the survey was challenging. TheCBA model requires specific numbers and detailsthat can be difficult for community members torecall or estimate. Much <strong>of</strong> the community isilliterate and poorly educated, and many concepts(such as annual income) are foreign. Thus, it wascritical that the survey be reviewed, edited, andtranslated by several people familiar with Bisanpurand fluent in Nepali. Further, it was determinedthat the actual surveying be conducted by one <strong>of</strong>the Mercy Corps field coordinators who routinelyworks in, and is familiar with, the local community.It was critical that such a person administer thesurvey as cultural and language barriers wouldhave made the survey impossible to administerby the research team or through a translator.12 <strong>of</strong> the 13 DPC members were interviewed(representing 12 households and thus 40% <strong>of</strong> thecommunity).2. PM survey and interviewThe design <strong>of</strong> the project manager survey wasdirected at any “experts” who would knowhow the community was affected during theflood years. Due to the lack <strong>of</strong> a governmentresource, only Mercy Corps and Red Crossproject managers were interviewed. The surveyconsisted <strong>of</strong> 32 questions, but the interview wasmainly an open discussion with the questionsproviding the structure. Questions were designedto understand the impacts that fell outside <strong>of</strong>individual households (i.e., community impacts),to corroborate data with the DPC survey, toget a general understanding <strong>of</strong> how Bisanpur isaffected by floods, and to understand howBisanpur would have been affected by the floodshad DRR programming not been implemented.Nepali and English versions <strong>of</strong> this surveyare available from Mercy Corps Nepal uponrequest.14 A central component <strong>of</strong> Mercy Corps DRR programming is the establishment <strong>of</strong> disaster preparedness committees (DPCs)and sub-committees within each community that it operates. Members <strong>of</strong> these committees have clearly defined roles andresponsibilities, and are relied upon to promote DRR related activities and to mobilize local people to reduce risks. Selection<strong>of</strong> DPC members follow a participatory approach with key involvement <strong>of</strong> community leaders and are purposely made to begender and socially inclusive so to be as representative <strong>of</strong> the greater community as possible. The community survey was onlyadministered to DPC members as they were viewed as the most knowledgeable about the impact from flooding, are familiarwith surveys, and as a group we representative <strong>of</strong> the greater community.15 The PM survey was initially developed to be administered to local government <strong>of</strong>ficials or community leaders under theassumption that they would be most knowledgeable about community wide impacts <strong>of</strong> the flooding. However, it was laterdetermined that Mercy Corps and Red Cross project managers were most knowledgeable about such impacts considering theirintimate relationship with, and constant evaluation <strong>of</strong>, the project sites.16 See “<strong>Risk</strong> Assessment” section for detailed explanation <strong>of</strong> the flood events and their probability.<strong>Cost</strong>-<strong>Benefit</strong> <strong>Analysis</strong> for <strong>Community</strong>-<strong>Based</strong> <strong>Disaster</strong> <strong>Risk</strong> Reduction in Kailali, Nepal 13
3. Available DataSome impact data was previously collectedby Nepal Red Cross Society and Mercy CorpsNepal for Bisanpur. This data, however, was notcomplete or fine-grained enough to be sufficientfor inclusion in the CBA. Nevertheless it was usedto corroborate information gathered through theDPC and PM surveys.Table I. Types <strong>of</strong> data collected and corresponding sources, and collection methods4. Qualitative Assessment and Site VisitsSubsequent to the DPC survey being administeredand analyzed, the research team visited Bisanpurto meet with the DPC members and the villageleader. This visit was important to help interpretsurvey results, to understand the particularities<strong>of</strong> how floods impact Bisanpur, to assess therelative magnitude <strong>of</strong> the recent floods andtheir respective probabilities, and to assessthe impact <strong>of</strong> these floods in the hypotheticalcase <strong>of</strong> these floods occurring in thiscommunity had there not been any DRRprogramming.Data Sources for No-DRR ImpactAssessmentWith the above methods, we determined how theDRR project reduced the impact <strong>of</strong> the floods, andapproximated the hypothetical impact had therenot been DRR. In cases where the hypotheticalimpact could not accurately be assessed, aconservative assumption was made for the “No-DRR” impact: we assumed it would have beenthe same as the scenario with DRR. Using GoogleEarth satellite photos and GPS coordinates <strong>of</strong>houses and other landmarks in the village, it waspossible to determine the number <strong>of</strong> houses thatwould have been flooded without the river bankand erosion protection, as well as the amount <strong>of</strong>agriculturalland that wassaved by thisintervention.DPC survey, site visitsIt was alsoCapital Component Data Sources Data Collection MethodsEconomicHousehold<strong>Community</strong>SocialHousehold<strong>Community</strong>EnvironmentalHousehold<strong>Community</strong>Method <strong>of</strong> income generation,belongings, savings,Infrastructure, savingsDeaths, injury, health, educationDeaths, injuries, health,educationSoil productivity, water qualitySoil productivity, water qualityDPC membersDPC members, project managers,NGO and government dataDPC membersDPC members, project managers,NGO and government dataDPC members, project managers,researchers assessmentDPC members, project managers,researchers assessmentDPC survey, PM survey, review possible to<strong>of</strong> available data; site visits collect veryreliableDPC survey, site visitsDPC surveys, PM survey, site informationvisitsfrom theinterviewsDPC survey, PM managerand surveyssurvey; qualitative assessmentDPC survey; PM survey; <strong>of</strong> DPCqualitative assessment membersand projectmanagers about exactly how many assets weresaved through the implementation <strong>of</strong> the EarlyWarning System. Project managers also providedspecific information about how the DRR projectchanged the behavior <strong>of</strong> community members andthe availability <strong>of</strong> clean drinking water, allowingus to approximate the number <strong>of</strong> individuals thatwould have been exposed to contaminated waterhad there not been DRR programming prior tothese floods.<strong>Risk</strong> AssessmentThe magnitude <strong>of</strong> the floods in the dataset mustbe assessed, and then the annual probabilities forflood years exceeding any particular magnitudemust be assessed. Because rainfall data hadonly been collected for 12 years in this area,and because it is unclear how up-steam rainfalldetermines flood magnitude (due to the absence<strong>of</strong> flood forecast models), and because the floodingin this region is due to recent environmental shifts14<strong>Cost</strong>-<strong>Benefit</strong> <strong>Analysis</strong> for <strong>Community</strong>-<strong>Based</strong> <strong>Disaster</strong> <strong>Risk</strong> Reduction in Kailali, Nepal
(massive up-steam deforestation), we did notrely on probabilistic statistics on the likelihood <strong>of</strong>causal weather events. Instead, a risk assessmentwas carried out using local knowledge aboutflood probability and advice from experts aboutthe causation <strong>of</strong> the floods. As an index <strong>of</strong> floodmagnitude, the water height from the river bottom(in meters) is normalized so that it ranges from 0at 100% probability, to 10 at ~0%. The authorsnormalized this number simply by subtracting4. We then verified that this system for assigningmagnitude roughly aligned with local knowledge<strong>of</strong> flood probabilities. For example, this systemassigns a probability <strong>of</strong> 60% to a 5 meter waterheight, which is approximately the water height atwhich flooding begins in Bisanpur. This is clearlya very conservative estimate, since the villageessentially floods every year. Further, the waterheight for the 2065/2008 flood was 7.2 meters, andfor the 2065/2008 flood year, it was 6.0 meters.The approximate magnitudes <strong>of</strong> the 2065/2008and 2066/2009 floods are therefore 3 and 2,respectively. This implies that the 2065/2008 floodis a “5-year-flood”, and the 2066/2009 flood is a“3-year-flood”. Again, these were confirmed tobe reasonable approximations through discussionswith locals and development workers who haveknowledge <strong>of</strong> the flood history in the area. Forfuture CBAs, the equations used in our analysis canall stay the same if one simply defines magnitudesuch that it conforms to the probability distributionshown in Figure 2 and Table II:Table II. Defining disaster magnitude via annualprobabilityMagnitudeAnnual probability0 11 0.6072 0.3683 0.2234 0.1355 0.0826 0.04987 0.03028 0.01839 0.011110 0.00674This distribution assumes an exponentialdecline in the probability for a disaster asmagnitude increases. We believe this assumptionis conservative - that is, it likely underestimatesthe contribution by high magnitude disastersto average annual impacts, because thisdistribution assigns such disasters very lowprobabilities.The <strong>Community</strong>-based SigmoidExponential <strong>Disaster</strong> <strong>Risk</strong> (CSEDR) CBAModelThe general methodology for a risk-based CBArequires that quantified impacts be mapped todisaster magnitudes so that the impacts <strong>of</strong> eachpossible disaster can be appropriately weighted,according to the probability <strong>of</strong> that event, in thecalculation <strong>of</strong> a final B:C ratio. Here we use anexplicit mathematic model for mapping impactsto magnitudes, and another to assign probabilitiesto all possible magnitudes. We therefore rely onmathematical s<strong>of</strong>tware to solve for the final results.Further, we designed a user-friendly computerprogram expressly for the purpose <strong>of</strong> carrying outthe analysis <strong>of</strong> a risk-based CBA undertaken atthe community level. This program, which wecall the <strong>Community</strong>-based Sigmoid Exponential<strong>Disaster</strong> <strong>Risk</strong> (CSEDR) computer program, isavailable from the authors upon request (RorickMM & White BA, 2010). Below we provide abasic description <strong>of</strong> the DRR CBA process thatthe CSEDR CBA program implements. Some <strong>of</strong>the underlying assumptions <strong>of</strong> the model are alsodiscussed.The basic methodology <strong>of</strong>CSEDR CBA1. The CSEDR program assumes a sigmoid(s-shaped) function describes how disastermagnitude “M” determines impact “I” (i.e.,the model specifies I[M] as a sigmoid function<strong>of</strong> M). The form <strong>of</strong> this function is the same forboth the With-DRR and Non-DRR situation:<strong>Cost</strong>-<strong>Benefit</strong> <strong>Analysis</strong> for <strong>Community</strong>-<strong>Based</strong> <strong>Disaster</strong> <strong>Risk</strong> Reduction in Kailali, Nepal 15
I= ce amh vam (Equation 1)1- c+ ce hwhere “a”, “c”, and “v” are constants,“e” is Euler’s number (~2.71828), “M” ismagnitude, and “I” is impact 17 .2. The program then finds appropriate parametersfor this model by determining the best fit “a”parameter, using impact data from disasters <strong>of</strong>known magnitude, and the maximum possibleamount <strong>of</strong> capital that can be lost given anarbitrarily large disaster. The “a” parameterdetermines the steepness <strong>of</strong> the s-curve. Thisfitting will be done separately for the With-DRRand Non-DRR data, so the curves will differ.The “c” and “v” parameters are the same forboth the With-DRR and Non-DRR situations,and determined by other means 18 .Figure 1. The impact <strong>of</strong> a disaster at a givenmagnitude, for both Non-DRR (blue) andWith-DRR (red) situations. These functionsare generated by finding the best-fit sigmoid,and a priori specification <strong>of</strong> I[M=0] andI[M=M max ].3. Determines the annual probability <strong>of</strong>all possible flood magnitudes, and fitsan appropriate model. Here we use anexponential decline function 19 :Prob[M] = e -0.5M (Equation 2)Probability1.00.80.60.40.2Impact2500002 4 6 8 10Magnitude200000150000100000500002 4 6 8 10MagnitudeFigure 2. The probability that a disaster at, orexceeding, a given magnitude will occur in anygiven year, as a function <strong>of</strong> disaster magnitude.We assume an exponential decline in probabilityas disaster magnitude increases.17 We make assumptions when we use a sigmoid curve (described in Equation 1) to model impact as a function <strong>of</strong> magnitude.The primary assumption is that as flood magnitude initially increases, impacts increase at an accelerating rate, but that at somepoint, once flood magnitude reaches a certain level, the rate at which impacts increase starts to slow, to a point where increasingflood magnitude makes no more difference on impact, because all capital in the community has been lost.18 We assume that the maximum impact <strong>of</strong> a flood is the same in both the With-DRR and Non-DRR communities. We setv equal to this maximum impact in Equation 1, which describes how impact (I) is a function <strong>of</strong> flood magnitude (M), and thisspecifies that this curve should plateau at this maximum impact. Also, we set c=.01 in Equation 1, which assumes that bothcommunities experience an impact <strong>of</strong> 1/100th <strong>of</strong> this maximum impact when the flood magnitude is 0 (due to the structure <strong>of</strong>the function, the impact at M=0 must be greater than 0).19 We make an assumption when we use the exponential curve (described by Equation 2) to model magnitude as a function <strong>of</strong>probability. The assumption underlying this decision is that the probability <strong>of</strong> a flood decreases exponentially with increasingflood magnitude. Since different indices for magnitude (e.g. water level, water speed, annual rain-fall, etc.) may not have linearrelationships with one another, whether this assumption is true or not depends on one’s magnitude index. Thus, given one’schoice <strong>of</strong> magnitude index (which will probably be determined by considerations <strong>of</strong> the causal factors <strong>of</strong> the disasters along withconsiderations <strong>of</strong> the indices for which there is available risk data), it is important that this assumption is more or less correct.16<strong>Cost</strong>-<strong>Benefit</strong> <strong>Analysis</strong> for <strong>Community</strong>-<strong>Based</strong> <strong>Disaster</strong> <strong>Risk</strong> Reduction in Kailali, Nepal
4. Knowing impact as a function <strong>of</strong> magnitude(Figure 1), and probability as a function<strong>of</strong> magnitude (Figure 2), solves for impactas a function <strong>of</strong> probability to obtain the“exceedance curve” (Figure 3).Impact250000Impact25000020000015000010000050000200000150000Probability0.2 0.4 0.6 0.8 1.0100000500000.2 0.4 0.6 0.8 1.0ProbabilityFigure 4. The area (yellow) between the Non-DRR (blue) and With-DRR (red) exceedancecurves represents the average annual benefitsaccrued through the DRR program.Figure 3. The annual impact due to disasters,as a function <strong>of</strong> annual probability. This is alsoknown as the “exceedance curve”. This curve isobtained by solving for I[M] as a function <strong>of</strong> P[M].5. The With-DRR and Non-DRR data producetwo exceedance curves, which differ by their “a”parameter. We then take the difference betweenthe areas under these curves, which is simply thedifference between the discrete integrals <strong>of</strong> thesecurves, between 0 to 1. This difference in arearepresents the average annual benefits accruedthrough DRR interventions.6. Considering project lifetime, discount rates,potential error in cost and benefit estimates,etc., we now determine the overall B:C ratio forthe DRR project as a whole . This number givesthe factor by which the benefits are greater thanthe costs. If this ratio is over 1, the benefits aregreater than the costs and it can be concludedthat the DRR project is economically viable. Ifthis ratio is below 1, the costs are greater thanthe benefits (unless the CBA has significantlyunderestimated the benefits or overestimated thecosts), so the economic viability <strong>of</strong> the projectshould be questioned.<strong>Cost</strong>-<strong>Benefit</strong> <strong>Analysis</strong> for <strong>Community</strong>-<strong>Based</strong> <strong>Disaster</strong> <strong>Risk</strong> Reduction in Kailali, Nepal 17
VI. Results and InterpretationThe “impact” data used for this analysis is diverse—in terms <strong>of</strong> the ability to quantify it,the collection method, our confidence in its accuracy, etc. Ultimately, we decided thatit is only appropriate to include direct impacts into the CBA (defined here as impactswhich occur in the same year as the flood). Further, there were some impacts which weredifficult to quantify. To deal with this, we analyze the data in two stages. First, we analyzedthe results without including any hard-to-quantify impacts. Second, we analyze the resultsincluding health impacts due to disasters. There are, <strong>of</strong> course, many other significant impacts<strong>of</strong> disasters which we did not include in either part <strong>of</strong> the quantitative analysis, either becausewe were not able to meaningfully quantify them, or because they were indirect (and thereforenon-additive). Some <strong>of</strong> these are discussed in the “qualitative results” section further below.Also, there are some beneficial outcomes <strong>of</strong> DRR programming which are not consequences<strong>of</strong> reducing disaster impacts. Although these things cannot be included in the quantitativeCBA, they are discussed in the “qualitative results” section.Table III shows the raw data, which we analyzedusing the CSEDR CBA Model, to provide B:Cratios for the KDRRI project.Table III. Raw data on impacts and magnitude.Economic CapitalSocialCapital<strong>Risk</strong>Assmt.Impact TableTable IV. Other necessary dataOther Necessary DataNumber <strong>of</strong> households 30Average household size (people) 9.2Total Project <strong>Cost</strong> (€)304,422 (50,737 per community)Number <strong>of</strong> communities project targets 6Expected <strong>Benefit</strong> Duration (Years) 4-10Average Annual Household Crop Productionand Other Income (€) 1,046Average Value <strong>of</strong> Household Assets (€)*including one annual crop and not value <strong>of</strong> land 3,386Average Household Annual Crop Value (€) 694Average Household Owned Land Value (€) 2,529Reducing impacts to economic capital# <strong>of</strong> Houses flooded 21 11 12 1% grain-storage lost in flooded homes (quintals) 100% 71% 100% 71%% assets lost in flooded homes *not includingcrops, land, or grain storage 100% 0% 100% 0%% total annual crop lost 100% 100% 15% 15%% <strong>of</strong> land permanently lost due to erosion 15% 5% 5% 0%Value <strong>of</strong> Infrastructure lost 4452 € 4452 € N/A N/ANumber <strong>of</strong> individuals exposed to contaminateddrinking water 193 0 110 0Flood Magnitude 3 3 2 2If impacts are assumed to only include directlosses <strong>of</strong> personal assets (including the annualcrop, grain storage,2065/2008 Flood 2066/2009 FloodNon With Non WithDRR DRR DRR DRRlivestock, belongings,etc.), and to communityinfrastructure, wefind considerablydifferent exceedanceprobability curves forNo-DRR versus With-DRR scenarios (Figure5). From these curves,we can infer that theaverage annual benefit<strong>of</strong> DRR is €23,550(before accounting forthe discount rate). To calculate aB:C ratio, we assume that the benefitduration is 4 years (our conservativeestimate), and that there is a 12%annual discount rate, which takeseffect after the first year (to accountfor the fact that future benefits areworth less than present benefits).We assume that the project cost forthe village <strong>of</strong> Bisanpur is 1/6 <strong>of</strong> thetotal program cost, and incurred only18<strong>Cost</strong>-<strong>Benefit</strong> <strong>Analysis</strong> for <strong>Community</strong>-<strong>Based</strong> <strong>Disaster</strong> <strong>Risk</strong> Reduction in Kailali, Nepal
during the first year (i.e., no costs are discounted).These costs and benefits correspond to a B:C ratio<strong>of</strong> 1.72, and assuming a 20% reduction in ourestimate <strong>of</strong> average annual benefits, a B:C ratio <strong>of</strong>1.38. We also determined B:C ratios under theassumption <strong>of</strong> optimistic benefit duration and forother discount rates (Table V).Impact25000020000015000010000050000the maximum possible impact is greater. TheNo-DRR versus With-DRR scenarios again leadsto considerably different exceedance probabilitycurves (Figure 6). In this case, the average annualbenefit <strong>of</strong> DRR is €29,487. Assuming benefitduration <strong>of</strong> 4 years and a 12% annual discountrate, the B:C ratio is 2.16. With a 20% reductionin the average annual benefits, the B:C ratio is1.72. We also calculate the B:C ratios under theassumption <strong>of</strong> optimistic benefit duration and forother discount rates (Table VI).Impact2500002000000.2 0.4 0.6 0.8 1.0Probability150000Figure 5. Exceedance probability curves for No-DRR (blue) and With-DRR (red) scenarios. Impactsare in Euro, and include only those which directlyaffect household assets.Table V. B:C ratios with economic impactsAssumptionsAssuming bestestimates for costsand benefitsAssuming 20%reduction in benefits<strong>Benefit</strong> Duration4 years 10 yearsDiscount Rate Discount Rate0% 5% 12% 0% 5% 12%1.86 1.72 1.55 4.46 3.75 2.791.49 1.38 1.24 3.71 2.98 2.23Reducing impacts to social and economiccapitalSecond, we consider the impact <strong>of</strong> floods onhuman health, as well as the direct impacts<strong>of</strong> floods on economic capital. The healthimpacts we are considering are those due tocontamination <strong>of</strong> the water supply. By providingthe community with elevated water pumps whichdo not become contaminated during a flood,and through education <strong>of</strong> the community aboutavoiding contaminated water sources after theflood, the DRR programming may reduce some<strong>of</strong> these health-related impacts <strong>of</strong> floods. Whenthe health impacts <strong>of</strong> flooding are considered,100000500000.2 0.4 0.6 0.8 1.0ProbabilityFigure 6. Exceedance probability curves forNo-DRR (blue) and With-DRR (red) scenarios.Impacts are in Euro, and include impacts toeconomic capital and social capital.Table VI. B:C ratios with impacts to social andeconomic capitalAssumptionsAssuming bestestimates for costsand benefitsAssuming 20%reduction in benefits<strong>Benefit</strong> Duration4 years 10 yearsDiscount Rate Discount Rate0% 5% 12% 0% 5% 12%2.32 2.16 1.94 5.81 4.66 3.491.86 1.72 1.55 4.65 3.73 2.80These above results suggest that, even with themost conservative estimates for flood damage,discount rate, and project impact duration, thebenefits <strong>of</strong> KDRRI programming exceed its costs.Further, these results only consider impacts toeconomic capital and a small component <strong>of</strong>social capital. Had it been possible to morefully quantify the impact <strong>of</strong> social capital andenvironmental capital, we expect the B:C ratioswould have been significantly higher.<strong>Cost</strong>-<strong>Benefit</strong> <strong>Analysis</strong> for <strong>Community</strong>-<strong>Based</strong> <strong>Disaster</strong> <strong>Risk</strong> Reduction in Kailali, Nepal 19
It is our belief that the B:C ratio <strong>of</strong> 3.49, whichwas determined assuming a 10 year benefitduration 20 , a 12% discount rate 21 , best estimatesfor costs and benefits 22 , and the inclusion <strong>of</strong> somesocial benefits, is the most accurate assessment <strong>of</strong>the KDRRI project. A B:C ratio <strong>of</strong> 3.49 indicatesthat for every Euro spent on DRR, we expect that3.49 Euros will be saved by the community or theaid organization responding to the community’spost-disaster needs. Though this is significantby itself, it should be stressed that the 3.49 B:Cratio still represents a considerable underestimate<strong>of</strong> benefits given the methodological problemswith including all benefits associates KDRRIprogramming. Thus, the 3.49 B:C ratio shouldbe thought <strong>of</strong> as the best conservative estimate.The additional, non-quantified benefits <strong>of</strong> KDRRIprogramming are discussed in the followingsection.Additional Social and Economic impactThe CSEDR Model was only able to capture thedirect economic benefits from DRR programmingin Bisanpur. However, several other benefits fromDRR programming that could not be quantifiedclearly have monetary, social, and spiritualbenefits. These include:Human : The study did not attempt to quantify,or estimate, how many lost lives or injurieswere avoided due to DRR programming inBisanpur. However, Bisanpur villagers toldstories <strong>of</strong> how the early warning system helpedalert them to the approaching flood and gavethem ample time to secure their belongings andmove to higher ground. Further, the search andrescue team was estimated to have saved over300 people in neighboring villages (includingthe local police force) by taking them to saferground.Livestock: During the 2065/2008 dozens <strong>of</strong>livestock, including water buffalo and goats,from a neighboring community were rescuedusing KDRRI research and rescue techniques andequipment. The economic capital <strong>of</strong> neighboringcommunities that was saved through the DRRprogramming in Bisanpur was not considered inour economic analysis.<strong>Community</strong> Empowerment: During the site visitsand discussions with Bisanpur residents it was clearthat DRR programming significantly empoweredBisanpur as a community. For instance, thecommunity now feels more confident to meetwith, and request help from, government <strong>of</strong>ficials;they have become proactive about preparationand planning <strong>of</strong> new structures in the community,and no longer feel completely helpless in the facefloods.Indirect loss <strong>of</strong> crop production and other income:The CSEDR Model does not account for future(beyond 1 year) losses in crop production andother income that resulted from the floods. Forexample, while the model includes impactson crop production and other income for thefirst year following the loss <strong>of</strong> an agriculturalimplement such as a plow, it does not considerthe economic impact <strong>of</strong> the plow’s absence 2 or3 years later.20 We believe 10 year benefit duration is more appropriate for the KDRRI project than a 4 year benefit duration for severalreasons. Much <strong>of</strong> the programming that was done in KDRRI will last well beyond the completion <strong>of</strong> the project. For instance,there were several permanent structures built to protect the communities, resources/tools used by the search and rescuegroups have a slow depreciation rate, by most accounts the early warning system has become a permanent component <strong>of</strong> thecommunities, and the education/capacity building/training that was conducted can be expected to last well beyond the 2 yearimplementation phase.21A 12% discount rate was chosen because it is the most common rate used for CBAs in India by the Asian Development Bank.See: http://www.adb.org/Documents/ERD/Working_Papers/WP094.pdf22The 20% reduction in benefits used as a sensitivity analysis was not used for our best estimate as we feel confident in theaccuracy <strong>of</strong> calculated economic impacts. Further, had social and environmental impacts been quantifiable the B:C ratiowould have been significantly higher.20<strong>Cost</strong>-<strong>Benefit</strong> <strong>Analysis</strong> for <strong>Community</strong>-<strong>Based</strong> <strong>Disaster</strong> <strong>Risk</strong> Reduction in Kailali, Nepal
Social Cohesion: Before DRR programming inBisanpur the village men routinely left for Indiaor the trade town <strong>of</strong> Dhangari to work as daylaborers. However, in recent years Cash-For-Work programs established alongside KDRRIhave allowed many <strong>of</strong> them to stay in theirvillage despite the particularly poor agriculturalyields. This has the benefit <strong>of</strong> allowing the mento continue to work their own land and be withtheir family, while also earning the extra moneythey require to support their livelihood. Further,after the 2065/2008 flood year 3 families wholost their homes moved to another village. Itis possible that more households would haveuprooted and left the community had there notbeen DRR programming.Education: During the 2065/2008 flood severalschool books were lost in the flooding, andBisanpur children missed several days <strong>of</strong> class.Our quantitative analysis does not account forhow this loss in education affects the communityor how many books were saved due to the earlywarning system.Environmental: Loss <strong>of</strong> top soil and decreasedsoil productivity from the 2065/2008 flood wasextensive. Roughly 2 feet <strong>of</strong> sand and silt wasdeposited during the flood. The CSEDR Modelcaptures the immediate impact, which was theloss <strong>of</strong> 2 harvests. However, through the sitevisit and conversations with Bisanpur residents itwas estimated that the soil productivity remainsroughly 20% <strong>of</strong> what it was before the flood,and is only increasingly marginally from year toyear. The CSEDR Model does not account for thefuture loss <strong>of</strong> crop production and other incomeresulting from this loss in soil productivity.CBA is a tool specifically designed to considercosts and benefits that can be quantified intomonetary units. Unfortunately, the quantification<strong>of</strong> the above benefits was simply beyond thescope <strong>of</strong> this project. Our qualitative assessmentsuggests that, had it been possible for us to morecomprehensively quantify disaster impacts onsocial and environmental capital, we wouldhave found much greater benefits <strong>of</strong> KDRRIprogramming, and thus, much higher B:C ratios.<strong>Cost</strong>-<strong>Benefit</strong> <strong>Analysis</strong> for <strong>Community</strong>-<strong>Based</strong> <strong>Disaster</strong> <strong>Risk</strong> Reduction in Kailali, Nepal 21
VIII. ConclusionsUsing conservative estimates for the benefits measured in this study, we find B:C ratios greaterthan 1 for this particular disaster risk reduction project. Therefore, we conclude that investmentsin similar DRR activities in similarly hazard prone areas are likely to return in benefits at least 3.49times the original cost <strong>of</strong> the investment.Furthermore, it is important to note that we findB:C ratios greater than 1 under a broad range<strong>of</strong> circumstances— even when we use a highlyrestricted set <strong>of</strong> flood impacts and even undergreat reductions in the benefits. Our best estimateB:C ratio for the KDRRI project is 3.49, whichsuggests that for every Euro spent on DRR, theexpectation is that 3.49 Euros will be saved by thecommunity or the aid organizations responding tothe community’s post-disaster needs. Further, thisestimate represents a very conservative B:C ratio,as it only considers economic impact and limitedvariables <strong>of</strong> social impact. There are many impactswhich we did not include in our quantitativeassessment, either because they were indirector difficult to quantify. Through our qualitativeassessment in the field, and through our in-depthdiscussions with villagers, community leaders andlocal development workers, we believe that thequalitative impacts <strong>of</strong> floods are in fact those mostsignificantly modified by the KDRRI programming.Thus, we believe that a complete assessment<strong>of</strong> this disaster risk reduction project must alsoconsider its many significant qualitative benefits.Had it been possible to more thoroughly quantifythe full scope <strong>of</strong> the benefits accrued throughKDRRI programming, we are confident that ourfinal B:C ratios would be significantly higher.22<strong>Cost</strong>-<strong>Benefit</strong> <strong>Analysis</strong> for <strong>Community</strong>-<strong>Based</strong> <strong>Disaster</strong> <strong>Risk</strong> Reduction in Kailali, Nepal
Works citedQueenland Government, Counter <strong>Disaster</strong> and Rescue Services (2002). <strong>Disaster</strong> Loss Assessment:GuidelinesAsian Development Bank (2007). Theory and Practice in the Choice <strong>of</strong> Social Discount Rate for <strong>Cost</strong>-benefit <strong>Analysis</strong>: A Survey.http://www.adb.org/Documents/ERD/Working_Papers/WP094.pdfPost <strong>Disaster</strong> Surveys: experience and methodologyhttp://www.ema.gov.au/www/emaweb/rwpattach.nsf/VAP/(99292794923AE8E7CBABC6FB71541EE1)~Post+disaster+surveys.pdf/$file/Post+disaster+surveys.pdfWorld Bank Earthquake Vulnerability Reduction Program in Colombia - A Probabilistic <strong>Cost</strong>-benefit<strong>Analysis</strong>, World Bank (2006)http://www.proventionconsortium.org/?pageid=26#projectsBuildings and Infrastructure Project: A Case Study <strong>of</strong> Caribbean Infrastructure Projects that haveFailed Due to the Effects <strong>of</strong> Natural Hazards, OAS (1998)http://www.proventionconsortium.org/?pageid=26#projectsDescription <strong>of</strong> Fourth DIPECHO Plan for South Asia.http://www.evd.nl/zoeken/showbouwsteen.asp?bstnum=192489&location=Rorick MM, White BA (2010) The CSEDR CBA Model, Mercy Corps Nepal<strong>Cost</strong>-<strong>Benefit</strong> <strong>Analysis</strong> for <strong>Community</strong>-<strong>Based</strong> <strong>Disaster</strong> <strong>Risk</strong> Reduction in Kailali, Nepal 23
24<strong>Cost</strong>-<strong>Benefit</strong> <strong>Analysis</strong> for <strong>Community</strong>-<strong>Based</strong> <strong>Disaster</strong> <strong>Risk</strong> Reduction in Kailali, Nepal