Handout #5
Handout #5
Handout #5

Create successful ePaper yourself
Turn your PDF publications into a flip-book with our unique Google optimized e-Paper software.
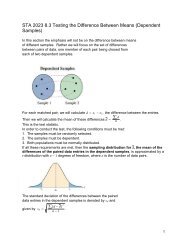
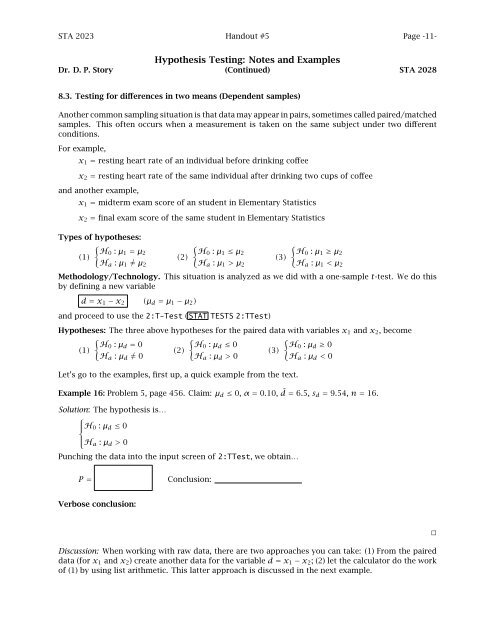
STA 2023 <strong>Handout</strong> <strong>#5</strong> Page -11-Hypothesis Testing: Notes and ExamplesDr. D. P. Story (Continued) STA 20288.3. Testing for differences in two means (Dependent samples)Another common sampling situation is that data may appear in pairs, sometimes called paired/matchedsamples. This often occurs when a measurement is taken on the same subject under two differentconditions.For example,x 1 = resting heart rate of an individual before drinking coffeex 2 = resting heart rate of the same individual after drinking two cups of coffeeand another example,x 1 = midterm exam score of an student in Elementary Statisticsx 2 = final exam score of the same student in Elementary StatisticsTypes of hypotheses:(1){H0 : μ 1 = μ 2H a : μ 1 ≠ μ 2(2){ {H0 : μ 1 ≤ μ 2H0 : μ 1 ≥ μ 2(3)H a : μ 1 >μ 2 H a : μ 1 0(3){H0 : μ d ≥ 0H a : μ d < 0Let’s go to the examples, first up, a quick example from the text.Example 16: Problem 5, page 456. Claim: μ d ≤ 0, α = 0.10, ¯d = 6.5, s d = 9.54, n = 16.Solution: The hypothesis is…⎧⎪⎨ H 0 : μ d ≤ 0⎪⎩ H a : μ d > 0Punching the data into the input screen of 2:TTest, we obtain…P =Conclusion:Verbose conclusion:Discussion: When working with raw data, there are two approaches you can take: (1) From the paireddata (for x 1 and x 2 ) create another data for the variable d = x 1 − x 2 ; (2) let the calculator do the workof (1) by using list arithmetic. This latter approach is discussed in the next example.□
STA 2023 <strong>Handout</strong> <strong>#5</strong> Page -12-Example 17: A golf club manufacturer claims that golfers can lower their scores by using the manufacturer’snewly designed golf clubs. Eight golfers are randomly selected and each is asked to give his orher most recent score. After a month of using the new clubs, the golfers are again asked to give theirmost recent score.Golfer 1 2 3 4 5 6 7 8Score (x 1 : old design) 89 84 96 82 74 92 85 91Score (x 2 : new design) 83 83 92 84 76 91 80 91d = x 1 − x 2 6 1 4 −2 −2 1 5 0Assuming the golf scores are normally distributed, is there enough evidence to support the manufacturer’sclaim at α = 0.10?Solution: Paired samples: We let d = x 1 − x 2 , and treat this as a one-sample z-test. The hypothesis is…⎧⎪⎨ H 0 : μ d ≤ 0 (Reasoning: μ 1 ≤ μ 2 ⇒ μ 1 − μ 2 ≤ 0 ⇒ μ d ≤ 0)⎪⎩ H a : μ d > 0 (Reasoning: μ 1 >μ 2 ⇒ μ 1 − μ 2 > 0 ⇒ μ d > 0)Calculations: (1) The calculations may be performed on your TI, by entering the d-data in a list (thed-data as calculated by simple methods and listed above in the table); or (2) use list arithmetic and letthe calculator calculate the d-data. The steps for the latter case are as follows:1. Enter x 1 as list L12. Enter x 2 as list L23. Perform the operation L1 − L2, and store the result as L3: L1 - L2, STO L34. Now perform STAT , TESTS, 2:T-TEST. Specify an input of Data, and enter the other information,including the list L3Having done the calculations, we Calculate to obtain the results of the test.P =Conclusion:Verbose conclusion:□8.4. Testing for differences proportionsThe premise here is that we have two populations with population proportions p 1 and p 2 . We takerandom samples of sizes n 1 and n 2 , respectively, from each of the populations. The samples areindependent of each other.Hypotheses: The three above hypotheses for the paired data with variables x 1 and x 2 , becomesTypes of hypotheses:(1){H0 : p 1 = p 2H a : p 1 ≠ p 2(2){ {H0 : p 1 ≤ p 2H0 : p 1 ≥ p 2(3)H a : p 1 >p 2 H a : p 1
STA 2023 <strong>Handout</strong> <strong>#5</strong> Page -13-Example 18: In a randomized controlled trial in Kenya, insecticide treated bednets were tested as away to reduce malaria. Among the 343 infants who used the bednets, 15 developed malaria. Amongthe 294 infants not using bednets, 27 developed malaria. Use 0.01 significance level to test the claimthat the incidence of malaria is lower for infants who use bednets.Solution: Let p 1 be the proportion of the population getting malaria after being protected by bednets;and p 2 be the proportion of population not using bednets who got malaria. We test H 0 : p 1 = p 2versus H 0 : p 1