Annual Report 1011 - The Stena Metall Group
Annual Report 1011 - The Stena Metall Group
Annual Report 1011 - The Stena Metall Group
- No tags were found...

You also want an ePaper? Increase the reach of your titles
YUMPU automatically turns print PDFs into web optimized ePapers that Google loves.
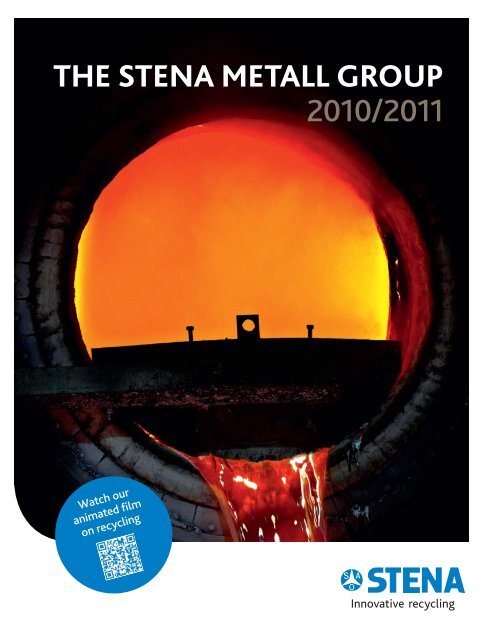
THE STENA METALL GROUP2010/2011Watch ouranimated filmon recycling
You can alsowatch ouranimated filmon recyclingat www.stenametall.se/en/recyclingfilmCONTENTSHighlights of 2010/2011inside flapWe are the <strong>Stena</strong> <strong>Metall</strong> <strong>Group</strong> 1Chief Executive Officer’s comment 2Market and prices 4Our operations 6BUSINESS AREASRecycling 12Trading & Sales 16Electronics Recycling 18Aluminium 20Steel 22Oil 24Economics & Finance 26<strong>The</strong> <strong>Stena</strong> Sphere 28FINANCIAL REVIEWDirectors’ report 32<strong>Group</strong>Income statement 35Statement of changes in equity 35Balance sheet 36Statement of cash flows 38Accounting and valuation principles 39Notes to the financial statements 42Parent CompanyIncome statement 53Statement of changes in equity 53Balance sheet 54Statement of cash flows 56Notes to the financial statements 57Holdings 60Proposed distribution of earnings 62Auditors’ report 63Board of Directors 64Addresses 64COVER:One of <strong>Stena</strong> Aluminium’s smelting furnacesin Älmhult, with a capacity of 30 tons.
OPERATING OVERVIEWRECYCLING<strong>The</strong> <strong>Group</strong> provides recycling services in fivegeographical markets under the <strong>Stena</strong> Recyclingname. Waste from throughout society is processedat one of around 200 facilities.www.stenarecycling.comTRADING & SALES<strong>The</strong> companies <strong>Stena</strong> Metal Internationaland <strong>Stena</strong> Metal Inc. trade in scrap, pig iron,hot briquetted iron and finished steel products.<strong>Stena</strong> Metal Inc. has operations in the U.S.,Brazil, Thailand and China.www.stenametalinternational.comwww.stenametall.comHighlights of 2010/2011Record profits for <strong>Stena</strong> Aluminium and<strong>Stena</strong> Recycling in Norway and Poland.<strong>The</strong> acquisition of an Italian electronicsrecycler makes us a market leader in Italy.<strong>Stena</strong> Solutions, a total waste managementconcept, was introduced to customers inSweden and is scheduled for launch in all ofthe <strong>Group</strong>’s recycling markets.A dedicated safety program with the vision of“Making <strong>Stena</strong> accident free” continued withsuccess in most areas.A new recycling branch concept was openedoutside Stockholm and achieved great success.An extensive trainee program was launchedto guarantee future access to competentemployees.ELECTRONICS RECYCLING<strong>The</strong> collection, processing and recycling of electricaland electronic waste is handled by the WEEE businessarea at 28 facilities in ten countries.www.stenatechnoworld.comALUMINIUM<strong>Stena</strong> Aluminium produces customized aluminiumalloys from recycled raw material in solid and liquidform for foundries and the steel industry.www.stenaaluminium.comSTEEL<strong>Stena</strong> Stål, with facilities in Sweden and Norway,offers a wide range of steel products as well assteel pretreatment and flame cutting/machiningof heavy plate.www.stenastal.comOIL<strong>The</strong> largest Nordic supplier of bunker oil, <strong>Stena</strong> Oilhas operations in the Nordic region and outsideWest Africa. <strong>Stena</strong> Oil also trades oil internationally.www.stenaoil.comFINANCE<strong>The</strong> Finance business area handles financial activitiesand serves as the <strong>Group</strong>’s internal bank.www.stenametall.comFive-year summarySEK million 2010/2011 2009/2010 2008/2009 2007/2008 2006/2007Visit our websites to find news, innovative solutionsand detailed information on our products and services.You’ll also find contact information for our local offices.Net sales 28,977 23,160 20,465 31,781 25,404EBITDA 1,337 1,247 358 1,648 1,465Operating income 722 603 –338 948 894Shareholders’ equity 4,407 4,115 3,716 4,202 3,859Equity/assets ratio, % 33.0 38.0 32.5 28.0 28.5Average numberof employees 3,486 3,184 3,453 3,638 3,409
WE ARE THE STENA METALL GROUP<strong>The</strong> <strong>Stena</strong> <strong>Metall</strong> <strong>Group</strong> benefits customers and createsnew resources by recycling society’s wastes. Our recyclingoffering consists of products and services for every typeof business. In addition, we process and trade steel andaluminium and trade oil and metals in the internationalmarket. <strong>The</strong> <strong>Group</strong> also includes finance operations.We have a strong culture based on decentralized businessacumen with the goal of generating value for our customers,ourselves and society as a whole. Our vision is to set anexample and be the most innovative company in all ourbusinesses.We are part of the <strong>Stena</strong> Sphere, which consists of thethree parent companies <strong>Stena</strong> AB (publ), <strong>Stena</strong> Sessan ABand <strong>Stena</strong> <strong>Metall</strong> AB.<strong>The</strong> photo was taken at <strong>Stena</strong> Recycling’sfacility in Malmö. Leyla Agalar, assistantproduction manager in the hazardous wastedepartment. Marek Lewandowski, ferrousand non-ferrous metals department.1
CHIEF EXECUTIVEOFFICER’S COMMENTSeeAnders Janssoncomment onthe past year*2010/2011 brought with it an increase in both sales volumes and market shares. This was despitetight competition and widespread economic uncertainty. <strong>The</strong> <strong>Stena</strong> <strong>Metall</strong> <strong>Group</strong>’s profit wasSEK 525 million before tax, an increase of 16 percent compared with the previous year.<strong>The</strong> conditions faced by our businesses fluctuatedin 2010/2011. Fall 2010 started out on a positivenote, but was followed by a harsh winter thatimpacted most of our businesses. Conditionsbrightened in the spring, with improvementsacross the board. Our hopes were dashed,however, when uncertainty increased in thefinancial market. This would come to definethe latter part of our financial year.Our philosophy of delegated business acumenwith independent, service-oriented branches inmore than 250 locations close to our customersserves as the key to the <strong>Stena</strong> <strong>Metall</strong> <strong>Group</strong>’sdevelopment. It has been impressive to see theenergy and commitment of our employees inthe last year. We continue to invest in our businessesand in the development of our employees.Because of this, I feel confident in our ability toproduce economic benefits for our customersand ourselves even in tough times.Business developmentIn our recycling operations, we have seen goodvolume growth and stronger market shares.Our offering has been expanded to include newproducts and services. Today we provide bothindustry-specific and customized solutions forevery sector of society under the name <strong>Stena</strong>Solutions.In Sweden, an expanded offering, combinedwith an increased focus on efficiencies, has contributedto our continued positive development.Focused business acumen and customizedwaste management solutions produced significantgains in the Polish recycling operationsduring the year. We now have a solid foundationfor continued growth.Our Norwegian recycling business had its bestyear ever. At the start of the current financialyear we acquired Norsk <strong>Metall</strong>retur, Norway'sleading recycler of ferrous and non-ferrousmetals, to complement our current operationsand give us an exciting base for further growthin the Norwegian market.Our Danish recycling operations continue todevelop well and gain market share. As part ofthe effort to strengthen our positions in theDanish recycling market and complement ourproduction structure, we acquired a shreddingfacility in Grenå, on Jylland, early in the currentfinancial year.Our electronics recycling operations, WEEE,had a tough year in the face of stiff competition,fluctuating volumes and price volatility in manymarkets. In spite of this, we improved our positionsin a number of areas and are especiallypleased with developments in the Nordic regionand Italy.<strong>Stena</strong> Stål has performed well and improvedits profitability in a changeable market in recentyears. We have expanded our range of productsand services, including through the acquisitionof AHAB Steel, which operates in the coil metalsegment.By utilizing strong business acumen, <strong>Stena</strong>Aluminium improved its earnings and thequality of its offering. Close cooperations withcustomers, where <strong>Stena</strong> Aluminium analyzestheir technical support and training needs, werea continued success.In an extremely volatile and uncertain financialmarket, <strong>Stena</strong> <strong>Metall</strong> Finans generated anacceptable result given the circumstances. At thesame time we were able to utilize our knowledgeof the Nordic bond market to secure additionalfunding and extend the maturity profile of theloan portfolio.<strong>Stena</strong> Oil continued to report good volumesand strengthened its market shares, especiallyin its new market outside West Africa.<strong>Stena</strong> Metal Inc. generally had a good yearand reported a satisfactory profit. It also beganto broaden its offering to include new products.Innovation leads to profitabilityOur position is that we are never better thanwhat people think of us. Three words – simplicity,reliability and development – sum up the aim ofour work at every level. Working with <strong>Stena</strong>should be easy for customers. <strong>The</strong>y shouldexpect quick decisions and results.We also want to communicate to customersthat our long experience and wide range ofexpertise make us a safe choice and a supplierthat keeps its promises. Our employees areencouraged to think along new lines and be2* You can also watch the film at www.stenametall.se/en/executivesummary
Staffan Persson, president of <strong>Stena</strong> Aluminium, in conversation with CEOAnders Jansson at the warehouse for aluminium ingots in Älmhult. <strong>Stena</strong>Aluminium had a successful financial year 2010/2011, when it improvedboth its earnings and customer offering. In addition, it was grantedapproval to raise production from 50,000 to 90,000 tons a year.innovative, regardless of their position. This ishow we believe solutions are created, preferablyin cooperation with the customer.<strong>The</strong>se core values are reflected in our localbusiness acumen and generate profitable business.During the financial year there were manygratifying examples of how our innovativecapabilities led to profitable new businessesthat also benefited customers. By carefullyanalyzing their needs, we can offer the servicethey need and do it profitably.In Västberga, outside Stockholm, we launcheda unique concept for a recycling branch designedspecifically for building contractors, where theycan quickly and easily dispose of their material,with the help of new technical solutions. More ofthese branches are already in the works.Our detailed knowledge of various types ofwaste is often a competitive advantage. In Denmark,for example, our chemists strongly contributedto several new projects during the year.Being close to customers is critical to <strong>Stena</strong>Stål and often leads to projects beyond theordinary. Reliable deliveries were decisive whenone of its customers needed help with an orderfor 150 tons of specially designed, ready-toassemblebeams for overhead cranes.!SAFETYContinuous focus on safetyWe have a vision of “Making <strong>Stena</strong> accident free”and an ambitious goal to greatly reduce thenumber of accidents within the <strong>Group</strong>. Duringthe financial year we further accelerated ourefforts to implement new tools and policies inorder to create safer workplaces. In manylocations we see clear signs of improvement,although this is a long-term project and muchremains to be done.Solid foundation for further growthAt the time of writing the world is strugglingto overcome widespread economic pessimism.However, thanks to the combination of stronglong-term owners, decentralized business acumenand a stable financial platform, the <strong>Group</strong> is wellprepared for the possibility of a tougher future.In 2008 a major safety program waslaunched by the <strong>Group</strong> with the vision of“Making <strong>Stena</strong> accident free.” <strong>The</strong> goal isto reduce the number of accidents by 80percent by 2012.Per-Olof Winnansson is the <strong>Group</strong>'ssafety coordinator.“In many areas we have come quite farand can already see improvements,” hesaid. “<strong>The</strong> financial year 2010/2011 sawa 33 percent reduction in accidents comparedwith the previous year. But thisisn’t a project that simply ends. It requireslong-term thinking and patience. We haveto bear down if things go poorly in a certainmonth and not get too carried away aftera short period of improvements.“Long-term success will be achievedwhen we manage to keep managers andemployees focused on the issue. All accidentscan be avoided, and it is the actionsof the individual employee that we haveto try to influence.”Anders Jansson, Göteborg, October 20113
MARKET AND PRICES<strong>The</strong> prices of the majority of the <strong>Group</strong>’s most important raw materials rose at the beginning of the financial year.This changed during the spring and early summer, when prices fell substantially. One reason was the increasing globaluncertainty. Major economies saw an improvement after the financial crisis in 2008, but were now showing signs ofweakness. Other reasons included the growing concerns about sovereign debt and budget deficits in many countries aswell as the increasing risks associated with the banking system’s financing. <strong>The</strong>re is tremendous uncertainty aboutgrowth prospects in the years ahead and at the start of the financial year 2011/2012.NON-FERROUS METALSSTEELMetal prices on the London Metal Exchange (LME)were volatile during the last financial year, but as awhole settled at historically high levels. Copper reachedan all-time high in February at over US$10,000 per ton.Despite growing financial concerns, prices on the LMEwere approximately 15 percent higher (in USD) at theend of the financial year than at the beginning, with theexceptions of nickel and zinc, which fell to the levelswhere they began.Metals on the LME and other raw materials areattracting great interest from financial players, andvolatility naturally follows from financial turbulence.Unrest in Northern Africa and the Middle East, thetsunami in Japan and the current euro zone crisis haveall had an impact.Strong growth in China and other emerging countriesis creating huge demand for metals, however, andprices and demand have both stayed at high levels. Forexample, China’s share of global copper consumptionhas risen from 22 to 38 percent between 2006 and2010. <strong>The</strong> corresponding figure for aluminium is from25 to 42 percent and for nickel from 20 to 40 percent.During the year LME non-ferrous inventories increasedwith the exception of nickel. Aluminium inventoriesremain very high (over 4.5 million tons), but areowned mainly by banks and financial players, whichare more concerned about global growth than the balancebetween supply and demand.Scrap: <strong>The</strong> market for non-ferrous scrap was stableduring the financial year, with continued demand fromChina, India, South Korea and other emerging markets.Demand in Europe was also relatively high. Demandfor aluminium scrap was stable, while the record-highcopper prices produced a large supply of copper scrapin Europe, at times leading to weaker demand. NorthernEurope’s strong industrial sector has been a stablesales channel at the same time export volumes to Asiaremained strong. <strong>The</strong> turbulence following the Westerndebt crisis has not yet had a significant impact ondemand, though obviously there are concerns goingforward.Nickel (USD/ton), LME50,00040,00030,00020,00010,000008/09 09/10 10/11Prices fell steadily from fall 2010 until the end of theyear and at the start of 2011 were about 10 percentbelow September’s prices.In January prices began to rise, which was earlierthan expected given normal seasonal patterns. <strong>The</strong>reasons were pent-up demand to fill unusually lowinventories and a larger degree of speculation whenprices were thought to have hit bottom. During thefirst quarter many steel mills were quickly booked upand prices rose. Long scrap-based products were firstin the cycle, but flat ore-based steel followed slightlylater.By the middle of the second quarter long productsretreated and in the third quarter the same was felt byflat products. At the end of the financial year pricelevels were back where they started the year.Steel mills are under pressure from high raw materialcosts and face poor profitability with low margins.<strong>The</strong>re were signs during the summer that capacity wasbeing cut in Europe when a number of blast furnaceswere removed from production.Copper (USD/ton), LME10,0008,0006,0004,0002,000008/09 09/10 10/11Aluminium (USD/ton), LME4,0003,0002,0001,000008/09 09/10 10/11Commercial steel (SEK/ton), import prices10,0008,0006,0004,0002,000008/09 09/10 10/114
RECOVERED PAPERFrom a historically high level at the start of the financialyear, prices continued to rise for the most importantrecovered paper grades, reaching record levelsduring the spring. Strong demand eventually led toconsistent price levels across markets and customers,with everyone facing the same conditions.<strong>The</strong> first signs that the paper market, and recoveredpaper, were beginning to weaken came in the summer.Machinery was periodically shut down due to slackeningdemand. At the end of the financial year priceswere still very high, however, and by spreading outsales an inventory build-up was averted.All indications are that prices will continue to fall,although the importance of recovered paper as a rawOIL<strong>The</strong> price of crude oil (Nymex) rose during the yearfrom USD 72 to USD 89 per barrel. Prices were essentiallyhigher for most of the year, but with a significantdownward correction at the end of the financial year.Among the key factors pushing prices higher wasthe decision by the International Energy Agency (IEA)in fall 2010 to adjust its demand forecast higher.Demand rose substantially, especially in China butalso in other countries such as Russia and Brazil. <strong>The</strong>North African revolutions that began in Tunisia andeventually reached Libya led to lower supply and apolitical risk that sent oil prices climbing higher. <strong>The</strong>fact that the production lost in Libya represented onlyabout 1.5 percent of global production shows how thinthe margins in the oil market are.FERROUS SCRAPIt was an eventful year in the ferrous scrap market.<strong>The</strong> world’s largest single scrap market, Turkey, wasaffected by the turbulence in North Africa and theMiddle East. Scrap trading in general was impacted bythe nuclear disaster following Japan's huge earthquake.It was feared that Japanese scrap had been contaminatedby radiation and trading was temporarilystopped. In late 2010/11 prices fluctuated greatlywhen the harsh winter first led to scrap shortages andhigher prices, then to a surplus and rapid price declinewhen the snow melted.During the first eight months of the year Europewas the train and Germany its locomotive. <strong>The</strong>German industrial expansion slowed slightly duringthe latter part of the financial year, however, resultingin a slight surplus of raw material. This could lead tocontinued price pressure in Europe.<strong>The</strong> Asian market remains healthy after a relativelystable year. Iron ore has noted slight adjustments. Onthe other hand, last year’s flooding in Australia led tohigh coke prices for blast furnace operators.Corrugated board (EUR/ton), export price20015010050008/09 09/10 10/11material for the world’s emerging countries willprobably mean only a modest decline.Oil (USD/barrel), Nymex13011090705030During spring and summer 2011 weak macroeconomicdata from the U.S. and an increased focuson the Western debt crisis adversely affected oilprices. Nonetheless, oil finished the financial yearup about 24 percent.Ferrous scrap (USD/ton), fob Rotterdam800600400200008/09 09/10 10/1108/09 09/10 10/11<strong>The</strong> U.S. steel industry’s utilization rate was around75 percent with stable pricing throughout the year.Domestic demand for steel products remained underpressure, but because of the relatively high productionin the U.S. and Europe scrap prices were historicallyhigh.PIG IRON<strong>The</strong> price of pig iron rose during the first half of thefinancial year, but then began to level off. <strong>The</strong> pricerise was driven by strong demand from steel mills,especially for flat products, in part due to generaloptimism about the economy. Toward the end ofthe financial year prices began to fall due to growingworries about the economic outlook in Europe andthe U.S. This was partly offset by continued demandfrom emerging countries.Pig iron (USD/ton), cfr New Orleans1,000750500250008/09 09/10 10/11FREIGHTFreight prices were lower than the previous year.Rates hit their low point in February 2011, dropping toessentially the same level as during the financial crisisin late 2008. Daily rates have continued to fluctuatefrom a historically low level. In general, it appears thatprices will remain under pressure due to the largenumber of new construction programs that are addingtonnage to an already sated market.Freight Baltic Dry Index8,0006,0004,0002,000008/09 09/10 10/11All graphs on this page refer to price trends for the periodSeptember 1, 2008 through September 26, 2011. All indicatemonthly figures.Sources: Reuters, MBR and <strong>Stena</strong> <strong>Metall</strong>5
OUR OPERATIONSA BUSINESS THAT WORKSFOR EVERYONEAs far back as 1939 our founder, Sten A Olsson, saw an opportunity in recycling. Since then our <strong>Group</strong> has grown organicallyand through acquisitions and today has operations in around 250 locations in 14 countries. <strong>The</strong> recycling businessis our largest, but we are also a trading company with operations that vary in specialty and approach.One thing all our businesses have in common is that they develop in pace with the changes in the society around us.To us, the concept of sustainable business means benefiting customers as well as the environment, while also improvingprofitability and safety. Truly benefiting society helps us all.Recycling and processingOUR RECYCLING BUSINESSSooner or later most things end up as scrap andare thrown out. Regardless of whether wastearises from consumption or production, we arethere to take care of the raw materials. We don’tconsider waste a problem. On the contrary, it is avital resource at a time when we have to conserveraw materials, energy, clean air and clean water.We collect waste from every sector of societyand, in our efforts to properly manage the rawmaterials, try to recycle as much as possible andavoid adding to landfills.6THE WORLDIN WHICH WE OPERATEFor <strong>Stena</strong>’s business to succeed, the environment inwhich we operate also has to be healthy. Customers,local communities and our employees addvitally important value to our business, and withoutthem we are nothing. That’s why we care aboutthem. <strong>The</strong> same applies to the environment aroundus and nature’s finite resources: We cannot affordto work in a way that does not protect these assets.Our goal is to be profitable while benefiting ourstakeholders and the world in which we operate.TURBINE BLADESAND CAMPERSBECOME CEMENTTogether with a German partner, we have developed apatented solution in Denmark to recycle 100 percent ofold wind turbine blades, recreational vehicles and plasticpleasure boats. After the energy has been recovered from50 percent of the turbine blades, what’s left is an ash thathas traditionally posed a challenge, ending up either inlandfills or being incinerated, both of which are costlyand problematic. With our new method, the ash isnow used to produce cement, since its chemicalcomposition is nearly identical tonew cement.You can watch our animated short on recycling atwww.stenametall.se/en/recyclingfilm
STENA FACILITIES<strong>The</strong> waste we collect is recycled at one of around 220facilities. End-of-life products or production waste fromindustry are divided into scrap, paper, plastics, hazardouswaste, electronics and other production waste.We sort and shred the waste into clean raw materialusing innovative, environmentally safe methods. Usuallywe will recover the energy from any waste that cannotbe recycled.INNOVATIVE SOLUTIONSIn parallel with our research, innovative work is conductedat all our facilities. Since our customers face a constantlychanging reality, we have to work closely with themto develop the recycling solutions of tomorrow, largeand small.Systematic innovation is being done within the <strong>Group</strong>,giving us access to new ideas from which we can choosethose with the greatest potential and spread them toour markets and customers.RESEARCH ANDDEVELOPMENTOur constant challenge is to stay a step ahead anddevelop innovative, profitable recycling solutionsas new products and composites reach the market.Today’s research is focused on recycling more ofthe products we consume. Demand for materialis growing around the world, increasing the incentiveto extract more from low-value material.<strong>Stena</strong>’s own recycling research fills a vacuum.We collaborate with universities and organizationsaround the world and sponsor a professorship inrecycling at Chalmers University of Technologyin Göteborg. Our researchers are working continuouslyon a number of projects in areas thatcurrently lack commercially and environmentallysustainable solutions.CAR PARTSREPLACE COALWe have been working for some time to find a solutionfor the small parts left over after cars are dismantled at ourshredding facilities. <strong>The</strong> combination of leather, rubber, textilesand plastics previously couldn’t be recycled and ended up inlandfills. In recent years some parts have been burned as fuel, butthanks to <strong>Stena</strong>’s research, the waste can now be separated so thatplastics and metals are extracted and recycled. Moreover, the fuelfractions are clean enough to replace fossil fuels. This fuel hasbeen used lately by the cement industry instead of coal withgood results. <strong>The</strong> solution has several positive side effects.For one thing, it reduces the need for fossil fuels. Secondly,we are able to recycle material and recover energythat had previously gone to landfill.7
STENA SOLUTIONSOur total waste management solution, <strong>Stena</strong> Solutions, makes wastemanagement easier and more economical for customers. We offercustomized recycling for essentially every sector and industry insociety, ranging from retailers and manufacturers to hair salons.During the financial year 2010/2011 we began introducing <strong>Stena</strong>Solutions in our recycling markets with good results. <strong>The</strong> offeringis divided into five different stages, beginning with waste audits andresource optimization, continuing with training and waste management,and concluding with reporting and monitoring.5. <strong>Report</strong>ing andmonitoring1. Customized total wastemanagement solution2. Resource optimization4. Waste management3. Training andinformationServices are a large and important part of <strong>Stena</strong> Solutions, where we utilize our expertise to help customersdevise the most effective, environmentally safe and profitable recycling solution for their particular waste.Customers and employeesCUSTOMER’S REALITYIt’s when collaborating with customers thatour capabilities are put to the test. Our goal isto offer solutions that increase the value of theirbusinesses. As a customer, they should feel thatwe can find the right level for their particularoperations, regardless of whether they are a majormanufacturer or run a machine shop on the corner.Today we have around 220 recycling facilitiesthroughout Europe. Our familiarity with localconditions, combined with specialized expertisein various types of waste, is the key to finding themost profitable sales channel for each customer’swaste volumes.CABLES ARERETURNED TOCIRCULATIONCable recycling is constantly improving. Recycling cables hasalways been a challenge, since they consist of several differentplastics and metals all wrapped together. For several years <strong>Stena</strong>has recycled them at dedicated cable granulation plants, wherepatented technology is used to better separate the plasticsfrom each other and recycle the material. During the year weachieved a breakthrough when we managed to separateplastics so well that they have exactly the same propertiesas the original plastic raw material. This meansthat cable manufacturers can receive the rawmaterial back from their waste and useit directly in production.8
3,700EMPLOYEES<strong>The</strong> 3,700 employees who work in the <strong>Stena</strong> EMPLOYEES*<strong>Metall</strong> <strong>Group</strong> together are helping to promotea more economical and sustainable society. Ourdecentralized organization offers individuals agreat deal of personal responsibility and is basedon commitment and a passion for the work. Weare geographically diverse, but have a strong setof common values. With three words, Simplicity,Reliability and Development, we have summedup how we want to be seen by everyone whoworks with us. In 2011 we have launched an internaltraining program, <strong>Stena</strong> Story, which will help tomaintain and build support for our strong culturein new markets. We also launched an extensivetrainee program where 27 applicants wereaccepted from our various business areas. Nearlyhalf of them are women.DECENTRALIZEDBUSINESS ACUMENEverything we do in our business reflects a commitmentto decentralized business acumen. Wewant to be our customers’ first choice and webelieve that decisions should be made as closeto them as possible. <strong>The</strong> organization is built onresponsibility and decisiveness, and our employeesmeet their customers’ needs and expectationswith personal commitment and a focus onachieving the goals at hand.SAFETYFor <strong>Stena</strong>, safety equals quality, and our vision isto create a group without a single accident. A safeworkplace makes work enjoyable and gives ouremployees and subcontractors a sense of security.We also know that safety is good for business andtherefore is a critical element in decentralizedbusiness acumen. Our customers also benefit,since a high level of safety means higher productivityand quality.We take a proactive approach to eliminatingand managing risks. All of the <strong>Group</strong>’s employeeshave received training and been made aware oftheir personal responsibility in helping us to reachour common goal: Making <strong>Stena</strong> accident free.CONTINUOUSIMPROVEMENTSTo drive our business forward, we have a <strong>Group</strong>wideperformance management tool we callContinuous Improvements. Each year hundredsof projects are started and completed within the<strong>Group</strong>. Thanks to systematic improvements, we areable to prioritize, measure and follow up all projects,at the same time the tool gives our employeesthe opportunity to be inspired by others’ success.* Refers to number of employees. <strong>The</strong>re was an average of 3,486 employees.9
Production, trading and salesALUMINIUM PRODUCTION<strong>The</strong> <strong>Stena</strong> <strong>Metall</strong> <strong>Group</strong> includes the production of recycled aluminium. <strong>Stena</strong>Aluminium is the Nordic region’s leading supplier of aluminium to foundriesand the steel industry. Among other things, it is the only company in the regionto offer liquid aluminium. Our mission is to help customers to be successful.In recent years we have focused strongly on offering training and technical supportwith very positive results. By producing aluminium from recycled raw material,we reduce energy consumption by 95 percent compared with manufacturingfrom bauxite.STEEL SALES<strong>Stena</strong> Steel is Sweden’s third-largest full-serviceprovider of steel products, with the goal of stayingclose to customers geographically and inour relationships. We are seeing an increase inrequests from customers for preprocessed andprefabricated material which they can usedirectly in their production. Our machinery andoffering are constantly being expanded, and wehave the right expertise and experience to helpcustomers make the right choice.BUNKER DELIVERIES<strong>Stena</strong> Oil has been bunkering ships in Scandinavianwaters for over 30 years. Since 2010 we also operateoutside the coast of West Africa with four ships.Our concept is based on customer satisfaction,safety, flexibility and performance, which hasproduced many satisfied customers over the years.10
RAW MATERIAL FOR NEW PRODUCTSThanks to our innovative capabilities and curiosity, we have detailed knowledge of how rawmaterials are extracted, processed, used and eventually recycled for reuse in new productsin society.After we have processed the material we collect at our recycling facilities, we sell it as rawmaterial to end-customers around the world, including steel mills, foundries, paper mills,plastics manufacturers and other producers. We provide customers around the world withlarge quantities of processed raw material of consistently high quality which meets specificcustomer specifications. By using recycled materials, we conserve virgin raw materials fromforests, mines and oil reserves.That’s how popular new products are manufactured from society’s wastes, which becomea resource and an opportunity, over and over again.65%REDUCTION IN CO 2EMISSIONSLOGISTICSLarge quantities of waste are transported every day to recycling facilitiesor ports for export. <strong>The</strong> environmental benefits of recycling are considerableeven though it is a transport-intensive industry. For several years we have beentransporting waste by rail using <strong>Stena</strong>’s own scrap trains. We also collect scrapby train from some of our customers. In the last three years using trains insteadof trucks has reduced CO 2emissions by 65 percent!We work continuously to reduce the load on our roads, including throughhigher environmental requirements and modern technology.11
Baled cardboard en route from a <strong>Stena</strong> facility to a paper mill.Together we convert a material that many consider a wasteproduct to an important and valuable industrial raw material.Today recovered paper serves as the raw material for morethan half of the paper products manufactured in the world.Our recovered paper business consists of two parts. One isto create as much value as possible for the customer and ourselvesthrough efficiencies, know-how and the best possiblesales channels. <strong>The</strong> other is the collection services we offer.Nearly all paper products can be manufactured withrecovered paper as a raw material, although packaging board,newsprint and soft paper are especially well suited.12
RECYCLINGSTENA RECYCLING OFFERSBREADTH AND DEPTH<strong>The</strong> environmentalsavings from our recycling areenough to powerall the televisionsin Europefor three months*<strong>Stena</strong> Recycling handles all types of waste for all types of businesses andindustries. With over 200 facilities in five countries, <strong>Stena</strong> Recycling offersits customers a dynamic partner active in every part of the recycling chain.<strong>Stena</strong> Recycling’s customers can be found inamong others, which has given us knowledgemanufacturing, engineering, municipal services,that we can spread to our markets.offices, restaurants, auto scrap yards, small andmedium-sized workshops and printing plants.Safety generated new businessIn short, practically every sector and industryToday we handle every type of material (ferrousin society. We have a complete offering – <strong>Stena</strong>and non-ferrous metals, plastics, paper, hazard-Solutions – with customized waste managementous waste and other waste) in all our recyclingsolutions, where we handle the entire chainmarkets: Sweden, Denmark, Poland, Finlandfrom collections to practical recycling. Withand Norway. (<strong>Stena</strong> also offers electronicsall our products and services under the samerecycling; see page 18.) We have been recyclingumbrella, specifically designed for varioussociety’s wastes for more than 70 years, andindustries, it is easy for the customer to feelcomfortable and find the right solution justfor them.our experience and breadth have provided uswith expertise in every type of waste. In Denmark,for example, our skilled chemists wereiSTENA RECYCLING<strong>Stena</strong> Solutions in every marketIn 2010/2011 we began introducing <strong>Stena</strong>Solutions in all five of our recycling marketswith good results. We already knew that manycustomers want a single partner for all theirrecycling needs. Someone who takes care of alltheir wastes safely for people and the environment.<strong>The</strong>y also want that little somethingextra, like a solution specially tailored to theircritical in helping us to sign several new contractsduring the year. Continuous training forour employees means we can offer customersrecycling solutions that produce the bestreturns and, for the environment, the biggestbenefits.In December 2010 the Finnish mining companyPyhäsalmi Mine Oy signed an agreementwith <strong>Stena</strong> Recycling Oy in Finland for a totalwaste management solution encompassing<strong>Stena</strong> Recycling has recycling operations inSweden, Poland, Denmark, Norway andFinland, with a network of around 200facilities. Through innovative, cost- effectivesolutions, we recycle and process waste fromthroughout society with our total wastemanagement solution, <strong>Stena</strong> Solutions. <strong>The</strong>offering includes related services such asinternal logistics, training, statistical dataand safety advice.Business Area Manager Anders Janssonspecific requirements. That's what they getfrom <strong>Stena</strong> Recycling.over 30 fractions. Together with the customer,<strong>Stena</strong> has managed to raise the recycling rateAssistant Business Area ManagerLorentz RondahlA frequent request from our largest customersis for insourcing, which we see as proof thatthey consider <strong>Stena</strong> a reliable partner and partof their operations. In Sweden we have workedthis way for several years with Volvo and ABB,thanks to dedicated efforts. One of the keys tothese successful results was the specializedrecycling training Pyhäsalmi’s employees wereoffered as part of <strong>Stena</strong>’s solution. <strong>The</strong> twocompanies also had a similar approach to safetyPresidentsSweden Leif GustafssonPoland Fredrik ValentinDenmark Lars PetersenNorway Fredrik Eide AassFinland Risto Airas* <strong>The</strong> example is based on the CO 2emissions that recycling helps to avoid. Recycling by the <strong>Stena</strong> <strong>Metall</strong> <strong>Group</strong>eliminated 9.8 million tons of CO 2emissions in 2010/2011. This corresponds to the environmental impact all730 million Europeans would have by watching television three hours a day for three months.13
RECYCLINGand shared the same goals and vision. This was acontributing factor in the decision to hire <strong>Stena</strong>.As a hazardous waste recycler, <strong>Stena</strong> hasalways focused considerable energy on safety,and we offer a number of courses on how tomanage hazardous waste in the safest way possible.In recent years the <strong>Group</strong>’s internal safetywork has also been intensified through an overarchingprogram and frequent follow-ups. <strong>The</strong>semeasures pave the way for even higher qualityservices, and it is gratifying that our customersappreciate the efforts.A year with several acquisitions<strong>The</strong> financial year 2010/2011 concluded withunrest in the global market, but as a whole waspositive for our recycling operations, with agood flow of incoming volumes and many newcollaborations. In Denmark, we acquired a plantfor other waste, and in Sweden we opened atotally new type of facility close to centralStockholm. <strong>The</strong> concept, which <strong>Stena</strong> is alone! MAKING STENAACCIDENT FREEMaking <strong>Stena</strong> accident free is our visionin order to create safer workplaces. Toachieve it, we abide by a number of principles,the first three of which are:1. All accidents and occupational injuriescan be prevented.2. All accidents and incidents must bereported and followed up so that theydo not happen again.3. As a <strong>Stena</strong> employee or subcontractor,I always set a good example.During the financial year 2010/2011 allemployees received safety training, sincewe know that nearly all accidents can betraced to the human factor. Anotherimportant tool are safety walks, wheremanagement and employees on the floorgo through the facilities in detail to quicklyspot any risks. Thousands of safety walkswere conducted during the year as part ofthis long-term effort.in offering, is similar to a drive-through restaurant,but here the customers can quickly andeasily drop off scrap metal and have theirmoney deposited directly into their accountafter the scrap is weighed and inspected. <strong>The</strong>main target group is building contractors, andthe drop-off facility has become such a successthat others are already in the works. In Sweden,our offering was further expanded through theacquisition of Kretsloppsparken in Kristianstad.Its broad-based operations include recyclingsolutions for businesses, but it also serves as arecycling center for Kristianstad municipality.At the beginning of the financial year <strong>Stena</strong>Recycling AS of Norway had three branches.When 2011/2012 began the number was 16. Inspring 2011 it acquired the recycling companyAanerød AS close to the Swedish border, andon September 1, 2011 the number of employeesincreased by 130 through the acquisition of Norsk<strong>Metall</strong>retur, a company with twelve branchesalong the Norwegian coast.International recycling<strong>The</strong> recycling market is constantly changing.For <strong>Stena</strong>, this has meant collaborating moreacross borders. This is partly because globalcustomers want us to follow them internationally,but also so that we and our customers canbenefit from economies of scale from havingbranches in more than 200 locations. Certainlyit is a question of knowledge transfers, but it isalso about jointly packaging the <strong>Stena</strong> Solutionsconcept. On September 1, 2011 the recyclingcompanies in Denmark were merged to form<strong>Stena</strong> Recycling A/S. As a result, we have aunified brand and customers need only onepartner in all five markets. <strong>The</strong> cross-bordercollaboration also lets us utilize expertise fromneighboring countries. This was the case with aNorwegian kitchen cabinet maker, which sendsthe paint waste from its plant to Göteborgfor recycling. <strong>The</strong>se international recyclings olutions make us extremely competitive.Core business generates benefitsOur core business generates enormous environmentalbenefits, although that doesn’t stop usfrom working in many areas to further reduceour environmental impact. Recycling is a transport-intensiveindustry and we continuously tryto improve our logistics solutions to avoid emissionsand cut costs. Developments in this areaare happening rapidly, thanks in large part tomodern technology.Offering our customers sensible recyclingsolutions and compensating them for materialthat can then be returned to circulation is thebest environmental benefit we can think of. Ata time when most companies are trying toreduce their environmental impact, it is gratifyingto be able to provide a puzzle piece asimportant as recycling. One of our most popularservices is our customer portal, where customerscan access data on their recycled wastefor reporting and communication purposes.<strong>The</strong> Norwegian chemical company CytecNorway KS explained that it had worked forseveral years to reduce its waste volumes andmanaged to cut them by no less than 50 percent.But after switching to <strong>Stena</strong>, it was able tofurther reduce its wastes – at a lower cost!It is also gratifying that a number of companies,including Husqvarna, are now taking a stepfurther and seeking <strong>Stena</strong>’s knowledge andexperience when they design their products.A team of experts from <strong>Stena</strong> showed Husqvarnathe obstacles and opportunities associated withdismantling and shredding its products in orderto help it design with recycling in mind.14
!FOCUS ON INNOVATIONS<strong>The</strong> Finnish company Hartwall, one ofthe largest beverage makers in the Nordicregion, is constantly focused on innovationand quality improvements, especiallyfrom an environmental standpoint.<strong>The</strong> company, which is owned byHeineken, produces beverages for brandssuch as Lapin Kulta and Foster’s as well asan array of nonalcoholic alternatives.Since 2011 <strong>Stena</strong> Recycling has servedas its partner responsible for wastemanagement at a state-of-the-artfacility in Lahti.Hartwall’s rigorous environmentalsafety requirements are reflected in thegoals it sets for suppliers. <strong>Stena</strong>’s rolewas to raise the already high recyclingrates for Hartwall’s waste products,a major challenge it met in partnershipwith the customer and which resulted inspecially designed instructions, machineryand receptacles. <strong>The</strong> recycling rate is nowover 90 percent.Fractions from Hartwall include PETbottles and other plastics, glass, paper,wood, metals, hazardous waste and afraction limited to breweries: organicmalt dust.One of Hartwall’s waste objectives isto convert all byproducts containingsugar or ethanol into energy in the formof bioethanol. With the help of <strong>Stena</strong>’sequipment, liquid is separated from cansand bottles and converted into energybefore leaving the brewery.15
TRADING & SALESRecycled materials and scrap are becoming an increasingly importantglobal resource. <strong>The</strong> <strong>Group</strong> has two companies that sell them: <strong>Stena</strong> MetalInternational AB, which sells the <strong>Group</strong>’s processed scrap to end-customers,and <strong>Stena</strong> Metal Inc., which trades scrap, pig iron and raw materials on theinternational market.16Ulf Håkansson, plant manager at the steel mill Höganäs Sweden AB, discussing the quality of thinplate with Stefan Roos, Non-Ferrous Product Manager, Sweden at <strong>Stena</strong> Metal International AB.<strong>The</strong> scrap at the Halmstad mill comes largely from the <strong>Stena</strong> <strong>Metall</strong> <strong>Group</strong>’s home markets and isprocessed into iron powder for use in car parts, among other things. Quality assurance is rigorousand the cooperation between <strong>Stena</strong> and Höganäs dates back more than 30 years.
LOCAL COLLECTIONS AND GLOBAL SALES<strong>Stena</strong> Metal International AB is the sales companyresponsible for the ferrous and non-ferrousscrap collected by the <strong>Group</strong>. <strong>The</strong> company wasformed at the end of 2009, and customersquickly noticed that we lived up to our promiseto be a reliable partner capable of selling tosteel and metal mills around the world. <strong>Stena</strong>Metal International AB coordinates shipmentsof material from our home markets, so that wecan reach customers we couldn't sell to before.Thanks to relatively low costs for containerfreight, we have a market essentially spanningthe world. <strong>The</strong> domestic markets in our recyclingcountries – Sweden, Poland, Finland, Denmarkand Norway – are important. Other key salesmarkets for ferrous and non-ferrous scrapinclude Germany, Turkey, Spain, India, Chinaand the U.S.Focus on relationshipsTo further support the important Chinese market,we opened a representative office during thefinancial year 2010/2011 in Hong Kong, wherewe can serve existing customers and establishnew contacts.During the year we also established a separatesales support department at our head office inGöteborg to free up time for our sales representativesto devote to their most important task– meeting customers.Getting to know customers is essential tocreating the long-term relationships we want.We are good at satisfying each customer's specificneeds, and our aim is that as a customer of<strong>Stena</strong> Metal International AB you will receivethe grade of scrap that works optimally for yourspecific manufacturing process.iSTENA METALINTERNATIONAL AB<strong>Stena</strong> Metal International AB is the <strong>Group</strong>’ssales company for the ferrous, non-ferrousand stainless scrap volumes collected in<strong>Stena</strong> Recycling’s markets. Its main office islocated in Göteborg with a representativeoffice in Hong Kong. Customers include steeland metal mills around the world.President Thomas AnderssonRELIABLE PARTNER<strong>Stena</strong> Metal Inc.’s strong long-term relationshipswith customers have proven critical to itsexactly when they want it, at a competitiveprice. For the producer, it guarantees they caniSTENA METAL INC.success, especially in recent years. With over 30years of experience, it is a seasoned risk assessorand can maximize the market for its customers.From its headquarters in Stamford, Connect-sell their inventory and get paid quickly.<strong>The</strong> financial year 2010/2011 ended with adownbeat market, but as a whole was a goodyear. While demand from certain markets isweak, others have slowly increased to levels not<strong>Stena</strong> Metal Inc. trades internationallyin scrap, pig iron, hot briquetted iron(HBI) and finished steel products. It doesbusiness with producers and end-usersin every part of the world and has officesin the U.S., Brazil, Thailand and China.icut, in the U.S., <strong>Stena</strong> Metal Inc. helps rawmaterial producers and customers around theseen since before the global recession in 2008.In addition, we have broadened our productPresident Flemming Jensenworld find each other. For the end-customer, itrange with new ferrous products.guarantees they will receive the right material17
ELECTRONICS RECYCLINGON THE CUTTING EDGE IN WEEEAs Europe’s leading electronics recycler, we continue to develop unique customersolutions. We also continue to make progress in our new market, Italy.At the end of the financial year <strong>Stena</strong> was collectingelectronic scrap in 18 European countriesand had its own plants in ten of them.<strong>Stena</strong> collects, processes and recycles electronicscrap from households, companies andproducers. All operations are governed by theWEEE directive, which gives manufacturers andimporters re-sponsibility for recycling their productsproperly.Recycling electronic scrap is a relatively newindustry, but it is the fastest growing type ofwaste in the EU. As we consume more andproduct lifecycles become shorter, more trashends up in landfills. Each year Europeans throwiWEEEWASTE OF ELECTRICAL ANDELECTRONIC EQUIPMENT<strong>Stena</strong> is Europe’s leading electronics recycler,with 28 facilities in ten countries: Sweden,Norway, Denmark, Poland, Finland, Germany,Austria, Italy, Romania and the CzechRepublic. We also collect material fromanother eight countries.<strong>Stena</strong> collects, processes and recyclesWEEE from households, businesses andmanufacturers. We also develop and sell anumber of products from recycled material.Business Area Manager Phär Oscárout over nine million tons of used televisions,computers, refrigerators, etc. Official figuresshow that only 33 percent of the end-of-lifeelectronics is collected, which means that ahuge amount of untapped resources is available.<strong>The</strong> relative maturity of the various countriesdiffers significantly, however. From 17 kg ofelectronic scrap collected annually per personin Sweden and Norway to only around 2.5 kg inPoland, for example.Market leader in Italy<strong>Stena</strong> continued to grow in Italy in 2010/2011,both organically and through acquisitions. Afteronly three years, <strong>Stena</strong> is the market leader,with five plants from Milan in the west to Venicein the east and Verona at the center.We have signed extended contracts with allof the country’s collective recycling schemes,which represent the largest volumes.<strong>The</strong> European WEEE market is constantlychanging. We are seeing it consolidate andmargins shrink. At this point electronics recyclingmainly involves finding new ways to handlelarge volumes efficiently and safely for the environmentin accordance with current EU legislation.In recent years <strong>Stena</strong> has passed severalmilestones in electronics recycling. We haveunique solutions to recycle CRT televisions, LCDflat screens and computer monitors. <strong>The</strong> sameapplies to a technology that makes it possibleto separate brominated from non-brominatedplastics in computer scrap.Our innovations also make it possible tomeet future EU requirements, which benefitscustomers in all our markets.<strong>Stena</strong> manufactures a growing number ofcustomized products from recycled material.One example is a blasting abrasive manufacturedfrom old picture tubes.Reliable processes<strong>The</strong> goal of our continuous development workis to make it profitable for ourselves and ourcustomers to recycle. Our solutions also meanthat more material can be returned to circulation.Our 28 facilities around Europe receive electronicscrap to separate and process into rawmaterial that is so clean it can be used directlyin the manufacture of new products.During the year we significantly raised productivityat many of our facilities. This wasdone partly through major strides and extensivechanges as well as by continuously finetuningour processes to make them even moreefficient.But our processes not only have to be efficientbut safe for employees and the environment.We increased our market shares during thefinancial year through both new customers andcontract extensions. In Sweden, we extendedour agreement with Elkretsen, the businesssector’s electronic waste collector, making usSweden’s leading electronics recycler, withslightly over one third of the country’s volumesfrom both households and businesses.18
Dismantler Serhat Mehmedikoglu works at <strong>Stena</strong>Technoworld GmbH in Stockerau, Austria. <strong>The</strong> plant,which has been in operation since February 2011,specializes in recycling televisions, computer monitorsand small domestic appliances (SDA).19
Here finished aluminium alloy is poured from afurnace heated to a temperature between 750and 850 degrees. Now it is ready for delivery tothe customer in liquid form or cast as ingots.20
ALUMINIUMIN PARTNERSHIPWITH CUSTOMERSToday we produce50,000 tons of aluminiuma year, equivalent to3.5 billionsoda cans<strong>Stena</strong> Aluminium’s mission is to help its customers become successful. In recentyears it has therefore focused strongly on offering training and technical supportwith very good results. At the end of the financial year the company was grantedenvironmental approval to expand production, which will provide additionalresources to meet future customer needs.<strong>The</strong> smelting plant in Älmhult produces recycledaluminium for foundries and steel mills. <strong>The</strong>aluminium is shipped in ingots, drops and liquidform. Liquid aluminium provides major economicand environmental benefits for the customerand is something <strong>Stena</strong> Aluminium alone offersin the Nordic market.Aluminium is a material steadily growing inpopularity and demand. Its properties make itwell suited for use in components for the autoindustry, for example, where there are manyend-customers.<strong>Stena</strong> Aluminium’s production is based onrecycled aluminium, which eliminates around450,000 tons of CO 2emissions each year comparedwith aluminium produced from bauxite.Our operations benefit the environment onseveral levels. In part because we use recycledaluminium, but also thanks to the methods weuse in production and the investments wemake in the environment.Expanded offering<strong>Stena</strong> Aluminium’s mission is to help its customersbe successful, which it does by creatinglong-term relationships based on flexibility, theright quality, reliable deliveries and easy accessto products and technical support. During thefinancial year our focus on technical supportand training continued to produce positiveresults. We started a competence project withthe help of an EU grant, where we workedintensely to raise competence levels togetherwith five customers.During the financial year large parts of themarket recovered, especially in the auto andtelecom industries. Customer requirements interms of specific alloys and properties areincreasing, creating growing demand for ourmetallurgy and processing services. During theyear we opened a new laboratory to betterhelp customers optimize properties and quality.This is an important and growing part ofour offering, where we are more of a partnerthan a supplier. We have improved our positionsand see that customers appreciate it.Focus on safety<strong>Stena</strong> Aluminium is working extensively toimprove safety. All employees receive continuoustraining and we are working deliberately toimprove transparency and structures, followingup at all levels. As a result, we set a new recordwith 391 consecutive days without an accidentrequiring sick leave.An eventful financial year ended with theCounty Administrative Board and the EnvironmentalCourt giving the go-ahead to increaseproduction from 50,000 tons today to 90,000tons. This is the result of a multi-year effortand means that we can continue to followour customers as they grow in pace with themarket’s recovery. As part of our own growthefforts, we are investing in a new flue gasde sulfurizati facility, thanks to which our environmentalimpact will be lower at 90,000 tonsthan it is today.iSTENAALUMINIUM AB<strong>Stena</strong> Aluminium is the Nordic region’sleading supplier of aluminium to foundriesand the steel industry. It also offers technicalsupport and training as well as metallurgyservices. <strong>The</strong> large part of thecompany’s operations is in Älmhult,Sweden, with a small office in Kolding,Denmark.President Staffan Persson21
STEELMORE PRODUCTS AND FASTERCUSTOMER DELIVERIESIt was a good year for <strong>Stena</strong> Stål, when global steel consumption rose. In addition,AHAB Steel was acquired, expanding <strong>Stena</strong> Stål into a new product segment andbroadening its customer offering.<strong>Stena</strong> Steel has been Sweden's third largestTo further develop the business, we expandedsteel supplier for many years. Our main offeringto a totally new segment during the financialis in long products and heavy gauge plate,year 2010/2011 through the acquisition ofwhere we have a significant part of the SwedishAHAB Steel, which has since been renamedmarket and are seeing very good growth. Being<strong>Stena</strong> Stål Storfors AB.quick and staying as close to customers as pos-<strong>The</strong> coil metal segment accounts for moresible have always been the keys for <strong>Stena</strong> Stål.than half of the Swedish steel market. AlthoughWe currently have 21 locations in Sweden andwe previously were able to supply thin sheet toNorway. <strong>The</strong> basic idea is to be on site locally,our customers, the acquisition offers manyclose to customers, and be familiar with geo-important advantages. One is that <strong>Stena</strong> Stålgraphical conditions. <strong>The</strong> level of service wecan now grind and cut sheet from rolls usingoffer should be so high that customers can havein-house resources.their material delivered from our smaller localWith the production units in Storfors, we canwarehouses on short notice.supply even more products to our customers,In addition, we are continuously expandingwhile delivering them faster than before.and improving our distribution system to raisethe level of service and deliver material reliablyIncreased digital presenceto customers.During the financial year we devoted great effortCustomization is increasingClose proximity is important to truly understandto making our facilities even safer, including byappointing a safety coordinator.We have also invested heavily to improve ouriSTENA STÅL ABa customer’s business and suggest improvements.We see a very positive, growing trend with suchcollaborations, where the aim is to choose theright steel, the right production method andthe right logistics solution.Another thing that has grown in popularity isthat customers increasingly want material thatis already preprocessed and prefabricated. <strong>The</strong>ywant to avoid having to spend time modifyingdigital presence. <strong>Stena</strong> Steel’s website can nowbe read in three languages: Swedish, Norwegianand English. In addition, we have developed ourown smartphone app.Market upswingIn terms of volume, 2010/2011 was a good yearfor <strong>Stena</strong> Stål, when we saw global steel consumptionrise. Demand has been high, which<strong>Stena</strong> Stål is a nationwide Swedish steelsupplier with a wide range of products thatincludes beams, reinforcing bars, tubes,plate, merchant bars, stainless, tool steel,alloyed structural steel, forgings and castings.It is the leader in flame cutting andCNC processing of heavy plate, while alsogrinding and cutting thin plate and sheetsfrom rolls. <strong>Stena</strong> Stål has warehouses, productionand sales in 21 locations in Swedenas well as in Moss, Norway.the material in their own facilities. With themachinery we have, we can do most of the workhas driven up raw material prices.President Jan-Erik Dahlinfor them and deliver the material to their exactspecifications.22
AHAB Steel in Storfors was acquired during thefinancial year. With its production units, <strong>Stena</strong> Stålhas broadened its offering in the coil metal segment.<strong>The</strong> photo shows 15-ton rolls being custom-cut.End-customers are mainly active in laser cutting,punching, pressing and rolling.23
OILGROWING BUSINESSIN WEST AFRICA90%of all goods have been shippedby boat at some point*Since its launch in January 2010, <strong>Stena</strong> Oil’s West African venture has performedstrongly and allowed us to offer our services to shipping companies that navigatethe region. We have grown from two vessels to four, and our African business areanow accounts for a significant share of revenue.<strong>The</strong> decision to launch a bunkering businessoutside the coast of West Africa was made at atime when the market was in decline. Whilemany other companies were having problems inthe wake of the financial crisis, <strong>Stena</strong> Oil,thanks to long-term owners, was able to investand prepare for an eventual rebound. Duringthe financial year 2010/2011 the fleet wasexpanded from two vessels to four. We can nowdeliver oil to customers along large parts of thestretch from Abidjan south to Angola.<strong>The</strong> customer base, which consists of internationalshipping companies with operations inEurope and West Africa, has grown steadilysince the start.iSTENA OIL AB<strong>Stena</strong> Oil is Scandinavia’s leading supplierof bunker oil, providing full-service solutionsfor ships operating in the Skagerak,Kattegatt and North Sea region. Since2010 we bunker ships outside the coast ofWest Africa as well. <strong>The</strong> company alsotrades internationally in bunker oil.President Jonas PerssonIn August 2011 an agreement was signedwith a customer from an industry that is new tous – the oil rig market. We will now be regularlydelivering oil to a rig with three supply boats.Interest in oil drilling outside the coast of WestAfrica is growing, and it will be a learning periodfor us during which we can make importantcontacts for the future.Quality is keyBehind the successful venture in West Africalies a proven business concept. For over thirtyyears <strong>Stena</strong> Oil has supplied bunker oil to shipsin the Kattegatt, Skagerak and the North Seaarea. <strong>The</strong> focus since the start has been oncustomer satisfaction, safety, flexibility andperformance. In recent years we have takenadditional steps and prioritized environmentaland safety work through the Green Bunkeringprogram.With our collective experience, we were ableto launch the venture in West Africa, where weknew that there was plenty of room forimprovement in terms of service and quality,since we ourselves had purchased oil there formany years. One example is wait times, whichwere often far too long.In hindsight, <strong>Stena</strong> Oil’s venture has beenhighly successful. <strong>The</strong> goal is to continue toexpand in the area.Exclusive agreement with depotIn our home market, Scandinavia, we saw a positivetrend during the financial year. Volumesgrew steadily and margins rebounded. Duringthe spring we signed an exclusive agreement tomanage the oil depot in the port of Göteborg asof October 2011. <strong>The</strong> depot is central to ouroffering and is one of our most important competitiveadvantages. It is where we have ourown warehouse and where we load all our shipsbefore they are sent out on assignment. Beingable to manage the depot ourselves allows usto improve efficiencies on several levels bymaking them an integral part of our operations.Oil prices are critical<strong>Stena</strong> Oil also offers its customers in Nordicwaters a very popular full-service marine solutionwhere it removes flush water and sludgeafter bunkering. This hazardous waste is thendelivered to <strong>Stena</strong> Recycling’s facilities, where itis cleaned and processed into an alternative fuelfor the cement industry – a solution that benefitseveryone involved, and certainly the environment.In addition to bunkering ships, <strong>Stena</strong> Oiltrades bunker oil in the international market.Oil prices and regulations on sulfur contentsaffect both businesses. This means that wehave to always stay a step ahead and find solutionsto meet changing conditions.24* Our punctual deliveries of high-quality marine fuels are critical to efficiently shipping goods on time andaround the world.
Martin Guldhed is responsible for commercial operationsat <strong>Stena</strong> Oil. All of the company's business is handledfrom the office in Göteborg. Customer relationships arecritical, and <strong>Stena</strong> Oil is open 24 hours a day, seven daysa week, year-round.25
ECONOMICS & FINANCENEW CFO SEES STRENGTHIN BUSINESS ACUMENOn September 1 John Lindqvist stepped down as CFO of the <strong>Stena</strong> <strong>Metall</strong> <strong>Group</strong>,but still retains his position as Deputy CEO. <strong>The</strong> new CFO is Jonas Höglund.After 32 years as the <strong>Group</strong>'s CFO, what haveyou learned that you would like to pass on toJonas?JL: Our business is built on local business acumen,and as CFO you have to be closely involved inhelping our branches make decisions andunderstand the reality they face. During myyears we have seen fantastic growth, goingfrom seven locations to 250, but we are still aflat organization. This is one of the reasons forour success in the past, and it will be in thefuture as well.What is your impression of the <strong>Group</strong> from afinancial perspective?JH: <strong>The</strong> company has a solid financial foundationwith long-term owners at its core and has beendistinguished for years by a high growth rateand stable profit level, with the exception of thelatest financial crisis. You quickly realize that thecornerstones are business acumen and a stronglocal presence and how important it is to safeguardthat culture. For me it is a question ofassimilating the culture and helping the companyto continue to develop in this direction.How do you describe the <strong>Group</strong>’s financingsituation during the last financial year?JL: In 2010/2011 we issued three bond loans:two in Sweden and one in Norway. This givesus greater financial security by reducing ourdependence on bank financing. <strong>The</strong> issues alsoplace increased demands on information.What are your comments on the <strong>Group</strong>’srevenue and continued focus on costs?JL: Our revenue is greatly dependent on metalprices, so it is not something we use as a me -asuring stick. We always focus on profit, andto achieve our goals the priority will continueto be reducing costs within the <strong>Group</strong>.JH: Tremendous work has been done, but it isa job that never ends. As always in a growingorganization, it is a challenge to compensatefor the increased costs that come with rapidexpansion, which we do partly by improvingproductivity. I feel confident in saying that<strong>Stena</strong> <strong>Metall</strong> has a good business model thatwill continue to generate positive results.John Lindqvist, Deputy CEO, and Jonas Höglund, CFO.26
iAB STENA METALL FINANS<strong>Stena</strong> <strong>Metall</strong> Finans handles financial activitiesand internal banking within the <strong>Group</strong>.THE GROUP’S INTERNAL BANK<strong>Stena</strong> <strong>Metall</strong> Finans serves as the <strong>Group</strong>’sinternal bank. Its areas of responsibilityinclude:• Active participation in analysis, qualityassurance of guidance documents andfinancing of investment activities.• Maintain routines for cash management,capital procurement and account structures,and actively work to reduce the <strong>Group</strong>’stied-up working capital.• Contribute to the <strong>Group</strong>’s short- and longtermearnings by efficiently managing andtrading liquid assets.• Monitor financial markets.• Weigh risk levels in the <strong>Group</strong>’s customercredits and manage the credit portfolio.• Ensure the <strong>Group</strong>’s access to long-termfinancing.EXCHANGE RATE EFFECTSON CONSOLIDATED INCOME<strong>The</strong> best possible balance is always soughtbetween assets and liabilities and betweenrevenue and expenses in foreign currency.It is important that the <strong>Stena</strong> <strong>Metall</strong> <strong>Group</strong>finances its operations in the right currency.Other projected flows are continuouslyhedged using forward exchange contracts.Faster information flows and expandingtrade across national and currency bordershave led to more transparent scrap prices.<strong>The</strong> <strong>Group</strong>’s earnings were previouslyaffected more by the exchange ratebetween USD and SEK than they are today.When the dollar fluctuates against thekrona, Swedish purchasing prices areadjusted much faster than before.LIQUIDITY AND FINANCING<strong>The</strong> <strong>Group</strong>’s external financing is securedthrough capital markets and the bankingsystem. Previous bilateral financing hasbeen replaced by syndicated credit agreementswith longer expirations. <strong>The</strong> syndicateincludes six major Nordic banks withoperations in the countries where the <strong>Stena</strong><strong>Metall</strong> <strong>Group</strong> is established and has a needfor banking services. For financing purposes,the basic rule is that no assets belonging tothe <strong>Group</strong>’s core businesses may be used ascollateral.Agreements have been reached with ourbanks on certain covenants and periodicinformation updates as a condition forfinancing.ENVIRONMENTAL INSURANCEAs in previous years, the <strong>Group</strong> has allocatedthe necessary provisions for environmentalinsurance to cover future remediation costsfor contaminated soil.Exchange rates*131197508/09 09/10 10/11Morgan Stanley World Index, USD*1,4001,2001,000800600Stockholm Stock Exchange’sOMXS30 Index*1,4001,2001,00080008/09 09/10 10/11EUR/SEKUSD/SEK60008/09 09/10 10/11VIX, Volatility Index*Maturing bond loans (SEK million)1,50070501,200309001008/09 09/10 10/1160030002011 20121 year20132 years20143 years20154 years20165 years20176 years* All graphs on this page refer to prices during theperiod September 1, 2008 through September26, 2011. All graphs refer to monthly figures.Sources: Reuters, MBR and <strong>Stena</strong> <strong>Metall</strong>27
THE STENA SPHEREBUSINESS AREA *STENA ABSTENA SESSAN ABSTENA METALL ABFERRY LINESSales SEK 9,092 millionProfit SEK –380 million<strong>Stena</strong> LineSHIPPINGSales SEK 3,220 millionProfit SEK –305 million<strong>Stena</strong> Bulk<strong>Stena</strong> RoRo<strong>Stena</strong> TeknikNorthern MarineManagementConcordia Maritime (52%)RoPaxvesselsOFFSHORE DRILLINGSales SEK 7,777 millionProfit SEK 1,233 million<strong>Stena</strong> DrillingShuttle tankersShuttle tankersREAL ESTATESales SEK 2,380 millionProfit SEK 1,422 million<strong>Stena</strong> Fastigheter<strong>Stena</strong> RealtyADACTUMSales SEK 4,630 millionProfit SEK 232 million<strong>Stena</strong> AdactumFINANCE/OTHERSales SEK 7 millionProfit SEK 687 million<strong>Stena</strong> Finans MEDA (22%)Beijer Electronics (30%)<strong>Stena</strong> <strong>Metall</strong> FinansRECYCLING, ENVIRONMENTALSERVICES AND TRADINGSales SEK 28,977 millionProfit SEK 525 million<strong>Stena</strong> <strong>Metall</strong><strong>The</strong> <strong>Stena</strong> Sphere is comprised of three parentcompanies wholly owned by the Sten A. Olssonfamily – <strong>Stena</strong> AB (publ), <strong>Stena</strong> Sessan AB and <strong>Stena</strong><strong>Metall</strong> AB – in addition to their wholly or partlyowned subsidiaries.<strong>The</strong> partly owned company Concordia Maritime AB(publ), which is listed on NASDAQ OMX Stockholm,is 52 percent owned by <strong>Stena</strong> Sessan AB.Total sales for the <strong>Stena</strong> Sphere amounted toSEK 53,637 million*.28Number of employees in <strong>Stena</strong> Sphere20,00015,00010,0005,00002007 2008 2009 2010 2011Net sales (SEK M)*30,00022,50015,0007,5000<strong>Stena</strong>AB<strong>Stena</strong><strong>Metall</strong>AB<strong>Stena</strong> ConcordiaSessan MaritimeAB AB*<strong>Stena</strong> <strong>Metall</strong>’s figures cover the period September 1,2010 – August 31, 2011. For other companies, theperiod is January 1, 2010 – December 31, 2010.
Peter Birgersson works as a machinist and Anna Friborg as asales representative at <strong>Stena</strong> Recycling’s branch in Skövde.29
FINANCIAL REVIEWDirectors’ report 32<strong>Group</strong>Income statement 35Shareholders’ equity 35Balance sheet 36Statement of cash flows 38Accounting andvaluation principles 39Notes to thefinancial statements 42Parent CompanyIncome statement 53Shareholders’ equity 53Balance sheet 54Statement of cash flows 56Notes to thefinancial statements 57Shares and participationsin <strong>Group</strong> companies 60Proposed distributionof earnings 62Auditors’ report 63Board of Directors 64Addresses 6431
DIRECTORS’ REPORT<strong>The</strong> Board of Directors and the President of <strong>Stena</strong> <strong>Metall</strong> Aktiebolag,corporate identity number 556138-8371, with its registeredaddress in Göteborg, Sweden, herewith present their report for thefinancial year September 1, 2010 to August 31, 2011.About <strong>Stena</strong> <strong>Metall</strong><strong>The</strong> <strong>Stena</strong> <strong>Metall</strong> <strong>Group</strong> is an innovative recycling leader thatcollects, processes and recycles all types of waste. <strong>The</strong> <strong>Group</strong> alsoincludes the production of recycled aluminium, the supply of steelproducts, financial operations and international trading in ferrousand non-ferrous metals and oil. At the end of the financial year2010/2011 the <strong>Group</strong> had operations in around 250 locations inSweden, Norway, Denmark, Finland, Poland, Switzerland, Malta,Germany, Czech Republic, Austria, Italy, Romania, China and theU.S.During the financial year 2010/2011 business conditions faced bythe company’s operations fluctuated. A positive start to the financialyear turned into a long winter that adversely affected the market interms of both prices and volumes. Conditions improved during thespring, but the conclusion of the financial year was marked byincreased uncertainty in the financial market. Dedicated businessacumen and an expanded customer offering are two reasons whythe <strong>Group</strong> generated a profit before tax that increased by 16 percentcompared with the previous year.Despite financial conditions and stiff competition, volumes andmarket shares both increased in 2010/2011 for the large part of the<strong>Stena</strong> <strong>Metall</strong> <strong>Group</strong>’s operating areas.MarketRecycling operationsFor the recycling operations, 2010/2011 produced volume growthand higher market shares. Sales and profit amounted to SEK13,456.0 million (10,911.9) and SEK 567.1 million (395.1), respectively.Today all types of material (ferrous and non-ferrous metals,plastics, paper, hazardous waste and other waste) are processed atthe <strong>Group</strong>’s recycling markets in Sweden, Denmark, Poland, Finlandand Norway. During the financial year the offering was expandedto include new products and services. Today the <strong>Group</strong> can offerindustry-specific and customized solutions for every industry andsector of society under the name <strong>Stena</strong> Solutions.In Sweden, an expanded offering, coupled with an increasedfocus on efficiency, contributed to continued positive results.Many collaborations and initiatives were launched during the year.In the Stockholm area, a new concept was introduced for buildingcontractors, and in Kristianstad the <strong>Group</strong> acquired a businesscomprised of a recycling branch and a recycling center for the public.In Poland, focused business acumen, combined with customizedtotal waste management solutions, contributed to a significantimprovement in the recycling operations during the year. <strong>The</strong> companynow has a strong foundation for continued growth in the Polishmarket.<strong>The</strong> Norwegian recycling business had its best year ever. In early2011/2012 Norsk <strong>Metall</strong>retur, Norway’s leading ferrous and nonferrousscrap recycler, was acquired, complementing the <strong>Group</strong>’scurrent operations. This gives the Norwegian business a solidfoundation for continued growth in the Norwegian market.<strong>The</strong> Danish recycling operations continue to develop well andgain market share. As part of the efforts to further strengthen itspositions in the Danish recycling market and complement thecurrent production structure, the <strong>Group</strong> acquired a shredding plantin Grenaa, on Jylland, at the start of 2011/2012.In Finland, the company continued to broaden its offering, andboth hazardous waste and other waste performed well. <strong>The</strong> crisis in2008/2009 continues to have an impact in Finland, however, whichhas affected the company’s operations and results.Trading & Sales<strong>The</strong> <strong>Stena</strong> <strong>Metall</strong> <strong>Group</strong> trades scrap, pig iron, HBI (hot briquettediron) and finished steel products.<strong>Stena</strong> Metal Inc. serves as a link between raw material suppliersand steel mills around the world. As a whole, the company had agood year and reported satisfactory profit.<strong>Stena</strong> Metal International is the sales company responsible forthe volumes of ferrous, non-ferrous and stainless scrap collectedand processed in the <strong>Group</strong>. <strong>The</strong> company is working to improvesales value and reduce risk exposure.<strong>The</strong> business area’s sales and profit amounted to SEK 1,866.8million (1,906.9) and SEK 20.9 million (48.6), respectively.WEEE (Waste Electric and Electronic Equipment)With operations in ten countries, the <strong>Stena</strong> <strong>Metall</strong> <strong>Group</strong> isEurope’s leading electronics recycler, with 28 facilities. <strong>Stena</strong> isthe principal or recommended partner for the largest nationwidecollection schemes in a number of countries. <strong>The</strong> <strong>Group</strong>’s electronicrecycling operations had a tough year distinguished bystiff competition, fluctuating volumes and price volatility in manymarkets. In spite of this, it was able to improve its position in anumber of locations, including the Nordic region and Italy.Sales and profit amounted to SEK 849.1 million (715.2) and SEK4.1 million (36.2), respectively.AluminiumUtilizing strong business acumen, <strong>Stena</strong> Aluminium was able toimprove its earnings as well as its offering. Sales and profitamounted to SEK 928.6 million (761.5) and SEK 49.7 million (28.9),respectively. <strong>The</strong> emphasis on technical support and training forcustomers has proven successful. At the end of the financial year32
environmental approval was received to expand production from50,000 to 90,000 tons per year in exchange for certain environmentalinvestments.Steel<strong>Stena</strong> Stål is Sweden’s third largest steel supplier and offers asteadily expanding range of products and services. Among otherthings, it is the leader in flame cutting and CNC processing ofheavy plate. In 2010/2011 <strong>Stena</strong> Stål developed well and strengthenedits profitability in a changeable market.<strong>The</strong> company has increased its range of products and services inpart through the acquisition of AHAB Steel in Storfors, which isactive in the thin plate and sheet segment.<strong>The</strong> business area’s sales and profit amounted to SEK 1,939.7million (1,427.5) and SEK 78.8 million (24.7), respectively.Oil<strong>Stena</strong> Oil is Scandinavia’s leading supplier of bunker oil, supplyingships in the Skagerrak, Kattegatt, North Sea region and outside thecoast of West Africa. <strong>Stena</strong> Oil continues to report good volumesand improved market shares, primarily in the new market outsideWest Africa, a venture that was launched during the previousfinancial year.<strong>The</strong> company also offers full-service marine solutions and tradesinternationally in bunker oil.Sales and profit amounted to SEK 7,878.3 million (5,594.9) andSEK 50.6 million (11.4), respectively.Finance operationsDuring the year SEK 1.6 billion in bond financing, net after repurchases,was arranged.Changes in the <strong>Group</strong>’s compositionOn November 30 the WEEE business area acquired the Italianelectronics recycler SIRA srl, now giving <strong>Stena</strong> five plants in Italy,from Milan in the west to Venice in the east.In early 2011 <strong>Stena</strong> Stål AB acquired AHAB Steel AB (sincerenamed <strong>Stena</strong> Stål Storfors AB), thereby entering a new productarea: thin plate and sheet.In the recycling business area, <strong>Stena</strong> Recycling AS acquired theNorwegian recycling company Aanerød AS on May 31. On the samedate <strong>Stena</strong> Recycling AB acquired the remaining shares in the previouslypartly owned company Kretsloppsparken Kristianstad AB.<strong>The</strong> sales company <strong>Stena</strong> Recycling GmbH was establishedduring the year in Germany and a company was formed in HongKong, <strong>Stena</strong> Metal Asia Ltd.Environmental information<strong>The</strong> large part of the <strong>Group</strong>’s operations is subject to permitrequirements. Six of the <strong>Group</strong>’s Swedish companies are engagedin activities that require environmental notification or permitsfrom the government in accordance with chapter 9 section 6 of theEnvironmental Code (1999:808). In total, the companies have 117facilities subject to notification or permit requirements. <strong>The</strong>secompanies are engaged in the recycling of ferrous and non-ferrousscrap, paper, electronics and the production of aluminium alloys.Operations also comprise the collection, storage and treatment ofwaste, including hazardous waste, as well as steel pretreatment.Four of the six companies are currently revising or renewing theirpermits due to increased production volumes or the addition ofnew operations. <strong>The</strong> largest environmental impact from their operationsis from noise and soil, air and water emissions. To protect theenvironment, <strong>Group</strong> companies comply with an environmentalpolicy and utilize established control system. During the year therewere fire incidents in operating facilities. <strong>The</strong> <strong>Group</strong> has a specialfunction to continuously improve safety work.During the year <strong>Stena</strong> Recycling received two environmentalawards: Göteborg Oil Port’s award for safety improvements and theGrand Logistics & Transportation Award (“Stora Logistik- ochTransportpriset”) for the year’s best mobility solution. <strong>The</strong> majorityof the <strong>Group</strong>’s companies are ISO 14001 certified.Certain <strong>Group</strong> companies conduct operations on land which hasor may have been contaminated. Through environmental insurance,the <strong>Stena</strong> <strong>Metall</strong> <strong>Group</strong> has transferred the risk to remediate contaminatedsoil to an insurance company. <strong>The</strong> insurance company’scommitment applies as long as the insurance premium is paid.Since the insurance company reinsures part of the risk with aninsurance company owned by the <strong>Group</strong>, the estimated liability forall companies that are part of the <strong>Group</strong> is reported in the consolidatedaccounts. <strong>The</strong> insurance covers the estimated remediationcosts, assuming the most likely outcome, for all the <strong>Group</strong>’s operatinglocations. <strong>The</strong> premium is paid annually and is reported underthe heading Cost of goods sold.Research and development<strong>The</strong> <strong>Group</strong> conducts a number of environmental technologyprojects, some on its own and some in cooperation with institutesof technology, universities, public authorities, organizations andother businesses. During the financial year SEK 39 million (32) wasinvested in research and development.33
DIRECTORS’ REPORTAccounting principles<strong>The</strong> accounting and valuation principles are unchanged from theprevious year’s annual report. <strong>The</strong> <strong>Group</strong>’s accounting principlesare explained on pages 39–41.Future outlook, significant risks and uncertaintiesIncreasingly widespread pessimism about the global economy isnot yet evident in the <strong>Stena</strong> <strong>Metall</strong> <strong>Group</strong>’s waste collection volumes.Uncertainty gives us reason to be cautious going into thenew financial year, however.<strong>The</strong> <strong>Stena</strong> <strong>Metall</strong> <strong>Group</strong> is exposed to a number of risk factorsthat are outside its control, wholly or in part, but which couldimpact the <strong>Group</strong>’s income and working capital. <strong>The</strong> companyregularly monitors trends in order to quickly adjust its operations.See Note 37 Financial instruments/risks.Events after the balance sheet dateOn September 1 <strong>Stena</strong> <strong>Metall</strong> AB acquired Norsk <strong>Metall</strong>retur AS,one of Norway’s leading ferrous and non-ferrous scrap recyclers.<strong>The</strong> acquisition represents a major expansion in the Norwegianmarket. <strong>The</strong> company has twelve plants located from Tönsberg inthe southeast to Trondheim in the north. <strong>The</strong> Norsk <strong>Metall</strong>returgroup has around 130 employees.On September 1 <strong>Stena</strong> Recycling AB acquired Göran ÅströmsÅkeri AB in Lidköping, including the subsidiary Lidköpings SlamsugningAB. <strong>The</strong> company has around 30 employees and offers wastesolutions as well as transportation services in Skaraborg.Parent CompanyDuring the latter part of the financial year the part of the ParentCompany’s operations related to <strong>Group</strong> functions was transferredto the new company <strong>Stena</strong> <strong>Metall</strong> Service AB. What now remainsin the Parent Company are primarily management functions andthe leasing of properties to subsidiaries.PersonnelIn 2010/2011 the number of employees increased in pace withrising volumes and market shares.<strong>The</strong> <strong>Group</strong> has increased its focus on competence and developmentissues through a number of initiatives, including in sales aswell as product and material expertise.A one-year trainee program was launched for the second timewith over 25 participants, nearly half of whom are women. <strong>The</strong> aimof the program is to guarantee access to competent future employees.<strong>The</strong> <strong>Group</strong>’s single largest project was in the area of safety,where it has invested broadly and with an eye on the long term tosignificantly raise the level of safety in all its companies.Sick leave absences continue to decline, primarily in Sweden,probably as a result of the <strong>Group</strong>’s wellness project, A Healthier<strong>Stena</strong>.Sales and income<strong>The</strong> <strong>Group</strong>’s sales amounted to SEK 28,976.9 million (23,160.5) anincrease of 25.1 percent compared with the previous financial year.<strong>The</strong> Parent Company’s sales were SEK 74.9 million (62.9), of whichintra-<strong>Group</strong> transactions accounted for SEK 61.8 million (50.6).<strong>The</strong> <strong>Group</strong>’s income before tax amounted to SEK 525.1 million(451.4). <strong>The</strong> Parent Company’s income before tax amounted toSEK 34.1 million (40.0).34
GROUPINCOME STATEMENTSeptember 1–August 31, SEK million Note 2010/2011 2009/2010Net sales 3 28,976.9 23,160.5Cost of goods sold 4 –26,796.3 –21,247.5Gross income 2,180.6 1,913.0Sales expenses 4 –645.9 –574.6Administrative expenses 2, 4 –823.7 –775.5Income from investments in associated companies 5 5.7 4.5Other operating income 6 13.7 46.9Other operating expenses –8.1 –10.8Operating income 1, 7 722.3 603.5Interest income and similar credits 8 103.3 105.3Interest expenses and similar charges 9 –300.5 –257.4Income before tax 525.1 451.4Taxes 10 –189.8 –38.7Minority interests in income 11 1.3 5.9Net income for the year 336.6 418.6GROUPSTATEMENT OF CHANGESIN SHAREHOLDERS’ EQUITYShare capitalRestrictedreservesUnrestrictedreservesNet income/lossTotalshareholders’quityOpening balance, September 1, 2009 13.0 321.3 3,894.7 –512.8 3,716.2Transfer of previous year’s income –512.8 512.8 —Transfer between restricted and unrestricted equity 17.1 –17.1 —Translation differences, etc. –26.4 6.9 –19.5Net income for the year 418.6 418.6Closing balance, August 31, 2010 13.0 312.0 3,371.7 418.6 4,115.3Transfer of previous year’s income 418.6 –418.6 —Dividend –49.5 –49.5Transfer between restricted and unrestricted equity 28.4 –28.4 —Translation differences, etc. –20.0 24.2 4.2Net income for the year 336.6 336.6Closing balance, August 31, 2011 13.0 320.4 3,736.6 336.6 4,406.6Specification of restricted reserves Aug. 31, 2011 Aug. 31, 2010Equity portion of untaxed reserves 46.6 102.1Other restricted reserves 286.8 209.9Total 333.4 312.035
GROUPBALANCE SHEETAugust 31, SEK million Note 2011 2010ASSETSFixed assetsIntangible fixed assetsGoodwill 12 591.2 571.7Other intangible assets 13 12.7 14.2Total intangible fixed assets 603.9 585.9Tangible fixed assetsBuildings 14 960.8 981.8Land and other real estate 15 575.7 551.8Plant and machinery 16 1,529.0 1,549.2Equipment 17, 36 92.8 86.6Construction in progress 18 94.8 44.8Total tangible fixed assets 3,253.1 3,214.2Financial fixed assetsShares and participations in associated companies 19 5.4 11.0Other long-term securities 3.7 0.7Deferred tax assets 20 34.3 —Other long-term receivables 21 140.2 96.8Total financial fixed assets 183.6 108.5Total fixed assets 4,040.6 3,908.6Current assetsInventories 22 3,304.8 2,458.5Current receivablesAccounts receivable 2,617.0 2,171.1Prepaid tax 7.1 69.1Other receivables 23 318.0 205.4Prepaid expenses and accrued income 24 530.9 381.8Total current receivables 3,473.0 2,827.4Cash and bank balances 2,527.5 1,642.1Total current receivables 9,305.3 6,928.0TOTAL ASSETS 13,345.9 10,836.636
August 31, SEK million Note 2011 2010SHAREHOLDERS’ EQUITY AND LIABILITIESShareholders’ equityShare capital, 130,000 shares 13.0 13.0Restricted reserves 320.4 312.0Unrestricted reserves 3,736.6 3,371.7Net income for the year 336.6 418.6Total shareholders’ equity 4,406.6 4,115.3Minority interests 25 8.9 3.8ProvisionsProvisions for deferred taxes 20 — 4.3Provisions for pensions 26 25.1 19.5Other provisions 27 578.8 556.0Total provisions 603.9 579.8Long-term liabilitiesBond loans 28 4,813.8 3,200.0Loans from credit institutions 29 39.1 39.6Other liabilities 12.5 9.3Total long-term liabilities 4,865.4 3,248.9Current liabilitiesLoans from credit institutions 30 217.2 196.6Commercial paper 31 — 228.0Advances from customers 22.4 20.9Accounts payable 1,799.1 1,328.6Tax liability 165.6 26.8Other liabilities 32 271.8 241.5Accrued expenses and prepaid income 33 985.0 846.4Total current liabilities 3,461.1 2,888.8TOTAL SHAREHOLDERS’ EQUITY AND LIABILITIES 13,345.9 10,836.6Assets pledged 34 134.6 103.1Contingent liabilities 34 331.2 377.637
GROUPSTATEMENT OF CASH FLOWSSeptember 1–August 31, SEK million Note 2010/2011 2009/2010Operating activitiesIncome before tax 525.1 451.4Adjustments for non-cash items, etc. 749.6 820.21,274.7 1,271.6Taxes paid 13.3 16.7Cash flow from operating activities before changes in working capital 1,288.0 1,288.3Cash flow from changes in working capitalIncrease(–)/decrease (+) in inventories –896.2 300.4Increase (–)/decrease (+) in current receivables –739.9 –90.0Increase (+)/decrease (–) in current liabilities 595.4 179.5Cash flow from operating activities 247.3 1,678.2Investing activitiesAcquisition of subsidiaries and assets/liabilities 35 –234.4 –42.8Disposal of assets/liabilities — 10.4Acquisition of intangible fixed assets –2.5 —Disposal of intangible fixed assets — 3.6Acquisition of tangible fixed assets –478.8 –194.0Disposal of tangible fixed assets 14.4 37.8Increase (–)/decrease (+) in financial assets –49.8 727.0Cash flow from investing activities –751.1 542.0Financing activitiesLoan proceeds 2,213.8 963.0Amortization of loan liabilities –773.4 –2,134.8Share dividend –45.0 —Donation to foundation –4.5 —Cash flow from financing activities 1,390.9 –1,171.8Cash flow for the year 887.1 1,048.4Liquid assets, September 1 1,642.1 596.9Translation difference in liquid assets –1.7 –3.2Liquid assets, August 31 35 2,527.5 1,642.1Supplemental disclosure to statement of cash flows 35Adjustments for non-cash items, etc.Income from investments in associated companies –5.7 –4.5Depreciation and impairment losses on assets 614.3 831.0Unrealized translation differences 111.9 62.9Capital gain/loss on sale of fixed assets 1.4 –4.6Withdrawals from/provisions for pensions 3.4 –2.1Other provisions 24.3 –62.5Total 749.6 820.238
GROUPACCOUNTING ANDVALUATION PRINCIPLESAmounts stated in the annual report are in millions of Swedish kronor(SEK million) unless indicated otherwise.General accounting principles<strong>The</strong> annual report has been prepared in accordance with the<strong>Annual</strong> Accounts Act, the recommendations and pronouncementsof the Swedish Financial Accounting Standards Council and thepronouncements of the Swedish Financial <strong>Report</strong>ing Board.<strong>The</strong> company’s shares are not publicly traded. For this reason,it does not apply RR 18 Earnings per Share and RR 25 Segment<strong>Report</strong>ing.Consolidated accounts<strong>The</strong> consolidated accounts have been prepared in accordance withthe Swedish Financial Accounting Standards Council’s recommendationRR 1:00 Consolidated Financial Statements.<strong>The</strong> consolidated financial statements comprise <strong>Stena</strong> <strong>Metall</strong> ABand all companies in which the Parent Company at the end of thefiscal year directly or indirectly owns more than 50 percent of thevoting rights or otherwise exercises a decisive influence. Companiesacquired during the year have been included in the consolidatedincome statement as of their date of acquisition.Intra-<strong>Group</strong> receivables and liabilities as well as transactionsbetween companies in the <strong>Group</strong> and internal gains are eliminatedupon consolidation.<strong>The</strong> consolidated accounts have been prepared according to thepurchase method of accounting. <strong>The</strong> accounts of foreign subsidiarieshave been translated to Swedish kronor according to the SwedishFinancial Accounting Standards Council’s recommendation RR 8,which calls for use of the current method. According to this method,all assets, provisions and liabilities are translated at closing dayexchange rates, while all income statement items are translated atthe average exchange rates for the year. Translation differences areposted directly to shareholders’ equity.Associated companiesShareholdings in associated companies, in which the <strong>Group</strong> ownsat least 20 percent but not more than 50 percent of the votingrights or otherwise exercises a significant influence over operationaland financial management, are normally reported according to theequity method in accordance with the Swedish Financial AccountingStandards Council’s recommendation RR 13.<strong>The</strong> equity method means that the book value of shares in associatedcompanies is carried by the <strong>Group</strong> as its share of these companies’equity plus any residual surplus or deficit value.In the consolidated income statement, the <strong>Group</strong>’s share of theincome before tax of associated companies is reported as “Incomefrom investments in associated companies.” <strong>The</strong> <strong>Group</strong>’s share ofthe reported taxes of associated companies is included in the<strong>Group</strong>’s tax expenses. Profit shares earned after the acquisitionof associated companies and which have not yet been realizedthrough dividends or distributions are included in the <strong>Group</strong>’srestricted equity.MergerMergers are reported in accordance with BFNAR 1999:1 Merger ofwholly owned subsidiaries. <strong>The</strong> consolidated value method hasbeen applied, whereby the acquiring company reports the assetsand liabilities of the merged subsidiary at the values reported inthe consolidated accounts.ClassificationFixed assets, long-term liabilities and provisions largely consist ofthe amounts that are expected to be recovered or paid more thantwelve months after the closing day. Current assets and liabilitiesessentially consist of the amounts that are expected to be recoveredor paid within twelve months of the closing day.Valuation principles, etc.Assets, provisions and liabilities have been valued at acquisitionvalue unless indicated otherwise.Foreign currenciesReceivables and liabilities in foreign currency are valued at closingday rates in accordance with the Swedish Financial AccountingStandards Council’s recommendation RR 8. Where forwardcontracts have been used as a currency hedge, the forward rateis applied.Financial instrumentsA financial asset or financial liability is reported in the balancesheet when the company becomes party to the instrument’s contractualterms. Accounts receivable are reported in the balancesheet when an invoice is sent. Accounts payable are reported whenan invoice is received.A financial asset is removed from the balance sheet when therights in the agreement are realized, expire or the company lossescontrol over them. A financial liability is removed from the balancesheet when the commitment in the agreement is fulfilled or hasotherwise been discharged.39
GROUP, ACCOUNTING AND VALUATION PRINCIPLES<strong>The</strong> <strong>Group</strong> uses several different financial instruments to minimizecurrency risks from financial flows as well as assets and liabilities.Moreover, various fixed income instruments are used to ensure anappropriate interest rate level.To apply hedge accounting and accrual of unrealized resultsfrom financial instruments, they must be classified as hedges offinancial risks and at the same time match the underlying asset orliability or the anticipated payment flow. Financial instrumentsthat do not meet the requirements for hedge accounting are markedto market and recognized through profit or loss. Unrealized gainsare reported when realized, while unrealized losses are recognizedin net income for the period<strong>The</strong> result from all financial derivatives that meet the requirementsfor hedge accounting are reported either as an adjustmentto the value of the underlying asset/liability or as an adjustment tothe revenue/expense for the period and the transaction the contractis designed to hedge.Management periodically reviews the effectiveness of financialinstruments and their correlation with the underlying exposure.See Note 37 to the consolidated financial statements.DerivativesDerivatives include forward contracts, options and swaps used tocover the risk of changes in exchange rates and exposure to interestrate risks. Derivatives are classified as either hedging instrumentsor holdings for trading purposes.Derivatives held for trading purposes are valued at the lower ofcost and fair value. <strong>The</strong> valuation is made at the portfolio level forsimilar instruments. This means that positive changes in value arereported when the instrument is realized and that unrealized negativechanges in value are reported to the extent they are not offsetby unrealized positive changes in value.Currency risksTranslation differences from the exposure of net assets in foreignsubsidiaries are posted directly to the <strong>Group</strong>’s shareholders’ equity.Exchange rate differences from the revaluation of foreign exchangecontracts or funding in foreign currency designed to hedge foreignassets are also posted directly to the <strong>Group</strong>’s shareholders’ equityand matched against the translation differences in such foreign netassets.<strong>The</strong> <strong>Group</strong> hedges anticipated future payment flows. Realizedresults from foreign exchange contracts or currency option contracts,including paid or received premiums from option contracts,are accrued and reported as an adjustment in the underlyingtransaction when it occurs.Interest rate risksInterest rate swaps are used to hedge future interest payments.Interest income or expenses according to these contracts isaccrued and reported as an adjustment to the interest expensefrom the underlying liability.Fixed assets and depreciation<strong>The</strong> branch network is considered part of production and its costsare included in their entirety in the cost of goods sold. As a result,all depreciation of fixed assets in the branch network is classifiedas cost of goods sold.Other equipment relates to sales and administrative expenses.Amortization of goodwill is classified as sales expenses.Depreciation/amortization according to plan is booked on buildingsand land improvements, machinery and equipment, andgoodwill, and is based on original acquisition values less anyestimated residual value. Depreciation/amortization schedulesare based on the estimated useful lives of the assets.Plant and machinery and equipment are generally depreciatedover 3–20 years and buildings over 25–50 years, while the depreciationschedule for land improvements and trains is 20 years.Goodwill (both consolidated goodwill and goodwill from assetacquisitions) exceeding SEK 5 million is amortized over a period of10 years (materiality principle). Goodwill of less than SEK 5 millionfor an individual acquisition is amortized directly against income.<strong>The</strong> difference between the above-mentioned depreciation andtax depreciation is reported by the individual companies as accelerateddepreciation, which is included in untaxed reserves.Impairment lossesIf there is an indication of an impairment loss, the recoverablevalue of the assets in question is estimated as the higher of valuein use and net realizable value. Impairment losses are recognizedif the recoverable value is less than the net carrying value.Construction in progress<strong>The</strong> acquisition value of construction in progress is estimated onthe same basis as acquired assets. Each asset is reclassified onceit can be taken into use.Other long-term securities and investmentsSecurities held by companies that are engaged in trading arereported as inventory. Security trades are reported in net salesand cost of goods sold.In other companies, shareholdings are reported as fixed assetsat acquisition value, where appropriate after writedowns.InventoriesInventories, valued according to RR 2:02, have been reported at thelower of cost and net realizable value, with the risk of obsolescencetaken into consideration. In the case of semi-finished and finishedgoods produced in-house, cost is comprised of direct manufacturingcosts and a reasonable share of indirect manufacturing costs. Normalcapacity utilization is assumed in the valuation.ReceivablesAccounts receivable and other receivables have been reported atthe amounts that are expected to be received after an individualvaluation. A large part of the <strong>Group</strong>’s accounts receivable is creditinsured.40
Liquid assetsFor a definition of liquid assets, see Note 35 to the consolidatedfinancial statements.ProvisionsA provision is reported in the balance sheet when there is a formalor informal commitment resulting from an incident that occurredand it is likely that an outflow of resources will be needed to settlethe commitment and a reliable estimate of the amount can be made.Employee benefitsPost-employment compensation such as pensions is disbursed inlarge part through periodic payments to independent authoritiesor institutions, which thereby assume the commitment to employees,i.e., through defined contribution plans. <strong>The</strong> <strong>Group</strong>’s income ischarged as the benefits are vested. <strong>The</strong> remainder is fulfilledthrough defined benefit plans, where the commitments areretained by the <strong>Stena</strong> <strong>Metall</strong> <strong>Group</strong>. For defined benefit plans, thecompany’s costs and the value of outstanding commitments as ofthe closing day are estimated with the help of actuarial calculationsdesigned to determine the present value of outstanding commitments.See Note 26.<strong>The</strong> accounting principle described above is applied only in theconsolidated accounts. Individual legal entities report definedbenefit pension plans according to local rules and regulations ineach country.Revenue recognitionRevenue is recognized when performance is rendered and the economicbenefits and risks associated with ownership are transferredto the buyer. In cases where the <strong>Group</strong> has performed a serviceand payment has been received before the material has been processedas agreed with the customer, the revenue is reported as aliability until the service is completed.Research and developmentExpenditures for research and development are expensed directlyin the consolidated income statement.LeasingIn the consolidated accounts, leasing is classified as either financeor operating. A lease where the economic risks and benefits areessentially transferred to the lessee is defined as a finance lease.Assets obtained through finance leases are reported as fixed assetsin the consolidated balance sheet. <strong>The</strong> assets are depreciatedaccording to plan, while lease payments are reported as interestand amortization of liabilities. Other leases are reported as operating,which means that the lease fee is expensed over the leaseterm on the basis of utilization.In the Parent Company and subsidiaries, all leases are reportedaccording to the rules for operating leases.Loan expensesLoan expenses have been charged against income in the period towhich they refer regardless of how the borrowed funds have beenused.Taxes<strong>The</strong> <strong>Group</strong> reports taxes according to the Swedish FinancialAccounting Standards Council recommendation RR 9, with theexception of deferred tax assets. Total tax consists of current taxand deferred tax. Current tax is tax that will be paid or credited forthe current year. This includes any adjustments to current taxattributable to earlier periods. Deferred tax is calculated accordingto the balance sheet method on the basis of temporary differencesbetween the net carrying value of assets and liabilities and theirvalue for tax purposes. Temporary differences are not taken intoaccount in consolidated goodwill or in any differences attributableto participations in subsidiaries and associated companies that arenot expected to be taxed in the foreseeable future.In the consolidated accounts, untaxed reserves are dividedbetween deferred tax liabilities and restricted equity. Deferred taxassets in deductible temporary differences are reported only to theextent it is likely they will result in lower tax payments in thefuture. Deferred tax assets attributable to tax loss carryforwardsgenerated in the operation are not reported as assets despite thatthey can reduce future tax payments.<strong>Group</strong> contributions and shareholders’ contributions<strong>Stena</strong> <strong>Metall</strong> reports <strong>Group</strong> contributions and shareholders’ contributionsin accordance with pronouncement UFR 2 of the SwedishFinancial <strong>Report</strong>ing Board.<strong>Group</strong> contributions are based on financial implication, i.e., tominimize the <strong>Group</strong>’s total tax. Since <strong>Group</strong> contributions thereforedo not constitute consideration for services rendered, theyare reported directly against retained earnings after deductingtheir tax effect.Shareholders’ contributions are posted directly to the shareholders’equity of the recipient and capitalized in the shares andparticipations of the contributor, to the extent writedowns are notrequired.Contingent liabilitiesA contingent liability is reported when a potential commitmentarises as a result of events that have occurred and whose occurrenceis confirmed only by one or more uncertain future events or whenthere is a commitment that is not reported as a liability or provisionbecause it is not likely that an outflow of resources will berequired.41
GROUPNOTES TO THE FINANCIALSTATEMENTS1 Personnel2010/2011 2009/2010Average number of employees Total Of whom men Total Of whom menParent companySweden 91 55 92 56Subsidiaries and representative officesSweden 1,686 1,379 1,557 1,291Denmark 403 346 378 311Norway 156 141 108 94Finland 130 101 128 103Germany 221 197 185 162Switzerland 3 1 4 2Austria 34 31 34 30Italy 161 142 62 60Poland 551 397 542 388Czech Republic 14 10 15 13Romania 28 24 55 46Russia — — 16 2USA 4 3 4 3Brazil 3 3 3 3Thailand 1 1 1 1<strong>Group</strong> total 3,486 2,831 3,184 2,565<strong>The</strong> average number of employees has been calculated based on the company’s paid working hours during the year in relation to the normal number of annual working hours in thecompany. <strong>The</strong> Board of Directors consists exclusively of men. Of <strong>Stena</strong> <strong>Metall</strong>’s senior executives. 0 percent is women.2010/2011 2009/2010Salaries. remuneration and social insurance contributionsSalariesand otherremunerationSocial insurancecontributions (ofwhich pensions)Salariesand otherremunerationSocial insurancecontributions (ofwhich pensions)Parent Company 85.1 59.6 99.2 68.1(31.9) (36.1)Subsidiaries 1,295.8 364.3 1,166.7 345.2(101.3) (93.8)<strong>Group</strong> total 1,380.9 423.9 1,265.9 413.3(133.2) (129.9)42
Note 1 Personnel. continued2010/2011 2009/2010Salaries and other remuneration by countryBoard andPresidentOf whichbonusesOtheremployeesOf whichbonusesBoard andPresidentOf whichbonusesOtheremployeesOf whichbonusesParent companySweden 20.2 7.2 64.9 8.9 20.7 8.5 78.5 15.2Subsidiaries and representative officesSweden 22.7 5.7 714.1 35.0 19.0 5.2 643.6 38.7Denmark 10.4 2.5 219.6 6.3 9.9 1.4 221.2 6.2Norway 1.8 0.4 74.8 4.9 1.7 0.2 55.0 1.0Finland 2.6 0.3 43.6 0.6 2.9 0.3 46.2 0.7Germany 1.6 0.1 53.2 1.6 1.1 0.2 46.5 1.3Switzerland — — 2.6 — 2.8 — 1.7 0.1Austria — — 13.6 0.7 — — 14.2 0.8Italy 8.9 0.5 46.5 2.3 1.4 0.2 11.6 —Poland — — 67.4 6.8 — — 64.7 —Czech Republic 0.5 0.2 2.1 0.6 0.5 — 2.4 0.5Romania — — 1.5 — 0.4 — 3.9 —Russia — — — — 0.3 — 3.2 —USA 3.6 1.5 3.2 1.1 3.7 1.5 5.7 1.3Brazil — — 1.4 — — — 2.9 0.7Thailand — — 0.1 — — — 0.2 —<strong>Group</strong> total 72.3 18.4 1,308.6 68.8 64.4 17.5 1,201.5 66.5Salaries and other remuneration paid to the Parent Company’s President. Vice Presidents and the Board of Directors amounted to 20.2 (20.7) during the year.Corresponding pension costs amount to 8.3 (7.9), while outstanding pension commitments total 52.8 (45.8).An agreement has been reached with the President entitling him to 24 months’ severance pay.Pension commitments to the company’s founder amount to 3.5 (3.7).<strong>The</strong> <strong>Stena</strong> <strong>Metall</strong> <strong>Group</strong> is covered by the collectively negotiated ITP plan (a Swedish pension plan), including an alternative ITP pension for salaried employees with salaries exceedingten times the income base amount. <strong>The</strong> alternative ITP applies the alternative Alecta premium, with the exception of senior executives in Executive Management positions. where thepremium is 30 percent of pensionable salary.43
NOTES TO THE FINANCIAL STATEMENTS2 Fees to auditors4 Operating expenses2010/2011 2009/2010Audit feesKPMG 9.6 10.2Revisionstjänst Andrésen & Ljungberg AB 0.1 0.1Other 2.8 0.8Total 12.5 11.1Tax adviceKPMG 0.7 0.9Other 0.6 0.2Total 1.3 1.1Other servicesKPMG 0.7 0.8Other 0.4 0.4Total 1.1 1.2Audit assignments refer to the review of the annual report and accounts and the administrationby the Board of Directors and the President. Also included are other duties thatare the responsibility of the company’s auditors as well as consulting or other assistanceresulting from observations during such reviews or the implementation of such otherduties. All other work is considered other services.3 Net salesBy business area 2010/2011 2009/2010Recycling 13,456.0 10,911.9Aluminium 928.6 761.5WEEE 849.1 715.2Oil 7,878.3 5,594.9Steel 1,939.7 1,427.5Trading 1,866.8 1,906.9Finance 2,006.7 1,779.8Other 51.7 62.8Total 28,976.9 23,160.52010/2011 2009/2010Amortization/depreciationaccording to plan by itemCost of goods sold –438.8 –452.9Sales expenses –133.7 –140.4Administrative expenses –41.8 –46.1Total –614.3 –639.4Amortization/depreciationaccording to plan by assetGoodwill –115.4 –117.0Other intangible assets –7.8 –7.1Buildings –65.1 –65.3Land improvements –5.8 –6.6Plant and machinery –391.8 –413.7Equipment –28.4 –29.7Total –614.3 –639.4Operating expenses include a provision to cover future expenses for soil remediation.<strong>The</strong> provision, which was allocated in accordance with the requirements of the EnvironmentalCode, was made to an environmental insurance policy. See Note 27 Otherprovisions.Impairment lossesPlant and machinery was written down by 3.6 in 2009/2010. <strong>The</strong> amount has affectedthe cost of goods sold.5Income from investmentsin associated companies2010/2011 2009/2010Returpapperscentralen i Uppsala HB 3.1 2.7Kretsloppsparken Kristianstad AB 2.6 1.8Total 5.7 4.5<strong>The</strong> remaining shares in Kretsloppsparken Kristianstad AB were acquired during the year.As of June 1, 2011 the company is included as a wholly owned subsidiary of the <strong>Stena</strong><strong>Metall</strong> <strong>Group</strong>.By geographical market 2010/2011 2009/2010Europe 22,503.2 17,674.1Rest of world 6,473.7 5,486.4Total 28,976.9 23,160.5By significant revenue category 2010/2011 2009/2010Goods 25,576.4 20,105.3Services 1,390.5 1,274.4Security trading 2,006.7 1,779.8Other 3.3 1.0Total 28,976.9 23,160.56 Other operating income2010/2011 2009/2010Insurance compensation 6.1 3.5Grants received 2.0 2.8Gain on sale of tangible fixed assets 1.2 25.0Rental income 0.4 3.0Other 4.0 12.6Total 13.7 46.9Excise duties of 0.1 (0.1) are included in sales.44
7 Operating income10 TaxesBy business area 2010/2011 2009/2010Recycling 567.1 395.1Aluminium 49.7 28.9WEEE 4.1 36.2Oil 50.6 11.4Steel 78.8 24.7Trading 20.9 48.6Finance –30.6 30.3Other –18.3 28.3Total 722.3 603.52010/2011 2009/2010Current tax –189.7 –123.3Deferred tax –0.1 84.6Total –189.8 –38.7Current taxCurrent tax for the period –191.0 –112.8Tax attributable to equity method –0.5 –0.6Adjustment of previous years’ tax 1.8 –9.9Total –189.7 –123.3By geographical marketEurope 682.0 554.9Rest of world 40.3 48.6Total 722.3 603.5Net exchange rate differences reported in operating income amount to 30.6 (-9.9).8 Interest income and similar credits2010/2011 2009/2010Interest income 62.8 85.8Exchange rate differences 40.6 19.4Other — 0.1Total 103.3 105.39 Interest expenses and similar charges2010/2011 2009/2010Interest expenses –162.7 –152.6Exchange rate differences –39.3 –39.0Other –98.5 –65.8Total –300.5 –257.4Deferred taxRelated to temporary differences 4.1 72.0Related to tax loss carryforwards –3.6 –1.2Related to tax attributable to previous years –0.6 13.8Total –0.1 84.6Reconciliation of reported tax chargeIncome before tax 525.1 451.4Tax according to Parent Company’scurrent tax rate (26.3%) –138.1 –118.7Effect of other tax rates for foreignsubsidiaries –6.7 25.3Effect of changes in tax rates — 0.2Amortization of consolidated goodwill –19.4 –18.8Other non-deductible expenses –15.2 –24.3Tax-exempt revenue 1.5 11.0Utilized tax loss carryforwards 4.6 94.3Unreported tax assets on net lossfor the year –19.1 –7.6Tax attributable to previous years 1.2 3.9Other 1.4 –4.0Redovisad skattekostnad –189.8 –38.711 Minority interests in incomeRefers to the minority owners’ interests in the income of SC <strong>Stena</strong> DTM SRL (25%), 1.4(2.8); <strong>Stena</strong> S.I.A.T. srl (30%) –0.2 (–0.8); <strong>Stena</strong> Technoworld Asia Pacific Co Ltd (49%),0.0 (0.2); and Refero-Bilretur AB (49%), 0.1 (—). <strong>The</strong> previous year included the minorityinterest in <strong>Stena</strong> Technoworld a.s (formerly <strong>Stena</strong> Safina a.s.). This company is now100% owned.45
NOTES TO THE FINANCIAL STATEMENTS12 Goodwill14 BuildingsAug. 31, 2011 Aug. 31, 2010Acquisition value, opening balance 1,054.3 1,107.8Acquisitions of subsidiariesand assets/liabilities 143.8 56.3Disposal of fully amortized goodwill –19.3 –45.1Translation differences –16.9 –53.3Other 7.5 –11.4Acquisition value, closing balance 1,169.4 1,054.3Accumulated amortization,opening balance –482.6 –429.7Accumulated amortization in acquiredcompanies, opening balance — –6.9Amortization for the year –115.4 –117.0Disposal of fully amortized goodwill 19.3 45.1Translation differences 8.2 22.2Övrigt –7.7 3.7Accumulated amortization,closing balance –578.2 –482.6Net carrying value 591.2 571.7Aug. 31, 2011 Aug. 31, 2010Acquisition value, opening balance 1,544.7 1,557.0Acquired companies 57.2 24.7Acquisitions during the year 25.6 11.3Reclassification 9.1 16.5Sales and disposals –3.4 –11.0Translation differences –20.1 –52.9Other –0.6 –0.9Acquisition value, closing balance 1,612.5 1,544.7Accumulated depreciation,opening balance –593.6 –554.6Accumulated depreciation in acquiredcompanies, opening balance –22.8 –4.3Reclassifications –8.1 1.1Sales and disposals 1.3 8.0Depreciation for the year –62.0 –61.8Translation differences 6.1 17.7Other 0.8 0.3Accumulated depreciation,closing balance –678.3 –593.613 Other intangible assetsAug. 31, 2011 Aug. 31, 2010Acquisition value, opening balance 39.6 29.0Acquisitions during the year 8.1 15.5Disposal of fully amortized assets — –2.0Translation differences –1.5 –2.2Other 15.9 –0.7Acquisition value, closing balance 62.1 39.6Accumulated amortization,opening balance –25.4 –21.9Amortization for the year –7.8 –7.1Disposal of fully amortized assets — 2.0Translation differences 1.0 1.3Other –17.2 0.3Accumulated amortization,closing balance –49.4 –25.4Net carrying value 12.7 14.2Revaluations, opening balance 50.1 65.5Disposal of fully depreciatedrevaluations — –15.4Reclassification –1.1 —Depreciation of revaluated amount,opening balance –19.3 –31.2Disposal of fully depreciatedrevaluations — 15.4Depreciation of revaluated amountfor the year –3.1 –3.5Reclassification 0.1 —Accumulated revaluations,net, closing balance 26.7 30.8Accumulated impairment losses –0.1 –0.1Net carrying value 960.8 981.846
15 Land and other real estate16 Plant and machineryAug. 31, 2011 Aug. 31, 2010Acquisition value, opening balance 588.6 594.9Acquired companies 37.1 0.4Acquisitions during the year 6.2 20.1Reclassification 5.1 0.3Sales and disposals –0.8 –9.8Translation differences –9.3 –17.3Other –1.7 —Acquisition value, closing balance 625.2 588.6Aug. 31, 2011 Aug. 31, 2010Acquisition value, opening balance 4,908.6 4,921.6Acquired companies 109.7 110.1Acquisitions during the year 270.2 113.4Reclassification 92.7 40.4Sales and disposals –167.0 –140.1Translation differences –53.1 –125.9Other 19.0 –10.9Acquisition value, closing balance 5,180.1 4,908.6Accumulated depreciation,opening balance –65.3 –62.6Accumulated depreciation in acquiredcompanies, opening balance –15.5 —Reclassification 6.2 —Sales and disposals 0.7 3.4Depreciation for the year –5.8 –6.6Translation differences 0.4 0.7Other 1.3 –0.2Accumulated depreciation,closing balance –78.0 –65.3Accumulated depreciation,opening balance –3,338.8 –3,073.2Accumulated depreciation in acquiredcompanies, opening balance –61.4 –58.5Reclassification 1.2 –8.5Sales and disposals 145.4 110.0Depreciation for the year –389.4 –407.1Translation differences 27.2 85.9Other –13.3 12.6Accumulated depreciation,closing balance –3,629.1 –3,338.8Revaluations, opening balance 28.5 33.9Disposal of fully depreciated revaluations — –5.5Depreciation of revaluations,opening balance — –5.5Disposal of fully depreciated revaluations — 5.5Accumulated revaluations,net, closing balance 28.5 28.5Net carrying value 575.7 551.8Revaluations, opening balance 64.1 64.1Disposal of fully depreciatedrevaluations –0.7 —Reclassification 1.1 —Depreciation of revaluations,opening balance –60.1 –53.5Depreciation of revaluated amountfor the year –2.4 –6.6Disposal of fully depreciatedrevaluations 0.7 —Reclassification –0.1 —Accumulated impairment losseson revaluated amount –1.8 –1.8Accumulated revaluations, net,closing balance 0.8 2.2Accumulated impairment losses,opening balance –22.8 –19.2Impairment losses for the year — –3.6Accumulated impairment losses,closing balance –22.8 –22.8Net carrying value 1,529.0 1,549.247
NOTES TO THE FINANCIAL STATEMENTS17 EquipmentAug. 31, 2011 Aug. 31, 2010Acquisition value, opening balance 234.8 260.5Acquired companies 3.6 5.8Acquisitions during the year 45.2 16.7Reclassification 0.5 –10.7Sales and disposals –31.4 –33.7Translation differences –1.4 –3.2Other –2.7 –0.6Acquisition value, closing balance 248.6 234.8Accumulated depreciation,opening balance –148.2 –156.5Accumulated depreciation in acquiredcompanies, opening balance –2.1 –2.3Reclassification 0.7 7.4Sales and disposals 21.0 30.2Depreciation for the year –28.4 –29.7Translation differences 0.9 2.1Other 0.3 0.6Accumulated depreciation,closing balance –155.8 –148.2Net carrying value 92.8 86.6With regard to leasing of fixed assets, see Note 36.18 Construction in progressAug. 31, 2011 Aug. 31, 2010Acquisition value, opening balance 44.8 57.4Acquired companies — 2.2Acquisitions during the year 162.3 48.5Reclassification –107.4 –46.5Translation differences –1.4 –1.7Other –3.5 –15.1Net carrying value 94.8 44.819Shares and participationsin associated companiesIndirectly ownedVotingrights, %Equityinterest, %Net carryingvalueReturpapperscentralen i Uppsala HB,corp. ID no. 916513-9313, Uppsala 50.0 50.0 5.2EARN Electroaltgeräte ServiceGmbH, Vienna 25.0 25.0 0.1Sp/f Gotship, Faroe Islands 25.0 49.0 0.1Total 5.4Accumulated acquisition values Aug. 31, 2011 Aug. 31, 2010Net carrying value, opening balance 11.0 26.4Acquired holdings 0.1 0.9Transferred to shares in subsidiaries –7.9 –17.7Share of net income for the year 5.2 3.9Distribution/withdrawal frompartnerships –3.0 –2.5Net carrying value, closing balance 5.4 11.0<strong>The</strong> remaining shares (75%) in Kretsloppsparken Kristianstad AB have been acquired,due to which the holding has been transferred to shares in subsidiaries.20Deferred tax assets/Provisions for deferred taxesAug. 31, 2011 Aug. 31, 2010Net carrying value, opening balance –4.3 –92.1Acquired companies 41.9 —Additional receivables/utilized provisions 41.8 122.6Settled receivables/provisions –41.9 –37.7Translation differences –3.2 2.9Net carrying value, closing balance 34.3 –4.3Provisions for deferred taxesTemporary differences arise when the net carrying values of assets and liabilities andtheir values for tax purposes differ. <strong>The</strong> <strong>Group</strong>’s temporary differences have resulted indeferred tax liabilities/tax claims for the following items:Aug. 31, 2011 Aug. 31, 2010Tangible assets –170.1 –164.6Inventories 7.7 —Receivables 55.2 81.2Tax allocation reserves –3.2 —Pension provisions 4.9 4.7Other provisions 61.9 49.8Liabilities 8.1 —Acquired tax loss carryforwards 47.8 —Older tax loss carryforwards 19.5 24.5Other 2.5 0.1Total 34.3 –4.3Deferred tax assets related to tax loss carryforwards which have not been recognized inthe income statement and balance sheet amount to 172.4 (161.7).48
21 Other long-term receivablesAccumulated acquisition values Aug. 31, 2011 Aug. 31, 2010Receivables from insurance companies 89.1 78.0Interest-bearing receivables 37.0 17.0Other 14.1 1.8Total 140.2 96.8Ackumulerade anskaffningsvärden Aug. 31, 2011 Aug. 31, 2010Net carrying value, opening balance 96.8 813.5Additional receivables 113.9 26.2Settled receivables –63.1 –732.3Translation differences –7.4 –10.5Net carrying value, closing balance 140.2 96.822 InventoriesAug. 31, 2011 Aug. 31, 2010Goods for resale, raw material 1,455.4 1,065.8Goods for resale, finished products 919.9 793.1Securities 929.5 599.6Total 3,304.8 2,458.526 Provisions for pensionsAug. 31, 2011 Aug. 31, 2010Net carrying value, opening balance 19.5 20.4Acquired companies 2.1 1.1Provisions during the period 4.1 0.6Utilized during the period –0.8 –0.3Change in accounting principle — –2.2Translation differences 0.2 –0.1Net carrying value, closing balance 25.1 19.5Post-employment compensation such as pensions is disbursed in large part throughperiodic payments to independent authorities or institutions, which thereby assume thecommitment to employees, i.e., through defined contribution plans. Pension commitmentsare secured in their entirety through company-owned endowment insurance.<strong>The</strong> remainder is fulfilled through defined benefit plans, where the commitments areretained by the <strong>Stena</strong> <strong>Metall</strong> <strong>Group</strong>. Defined benefit plans are used in Norway. For definedbenefit plans, the company’s costs and the value of outstanding commitments as of theclosing day are estimated with the help of actuarial calculations designed to determinethe present value of outstanding commitments. For actuarial calculations in Norway,a discount rate of 4.6% has been used and the anticipated salary increase has been estimatedat 4.0%. <strong>The</strong> pension liability for defined benefit plans amounts to 13.8 (13.4).Pension costs for the year Aug. 31, 2011 Aug. 31, 2010Defined contribution plans 109.4 103.8Defined benefit plans 4.1 3.7Total pension costs for the year 113.5 107.523 Other current receivablesAug. 31, 2011 Aug. 31, 2010Value-added tax 268.7 89.1Advance payments to suppliers 4.2 6.6Interest-bearing receivables 2.2 27.7Other 42.9 82.0Total 318.0 205.424Prepaid expensesand accrued incomeAs in previous years, this year’s reported amount consists primarily of goods that havebeen delivered but not invoiced,.27 Other provisionsAug. 31, 2011 Aug. 31, 2010Net carrying value, opening balance 556.0 620.6Acquired companies 0.5 1.3Provisions during the period 60.7 83.1Utilized during the period –38.8 –147.2Change in value of endowment insurance 2.8 1.8Translation differences –2.4 –3.6Net carrying value, closing balance 578.8 556.0Other provisions Aug. 31, 2011 Aug. 31, 201025 Minority interestsRefers to minority owners’ shares in <strong>Stena</strong> S.I.A.T. srl (30%), 8.6 (9.0); <strong>Stena</strong> TechnoworldAsia Pacific Co Ltd (49%), 0.2 (0.3); and Refero-Bilretur AB (49%), 0.1 (—). <strong>The</strong> minorityinterest in SC <strong>Stena</strong> DMT SRL has been written down to nil due to negative shareholders’equity in the company. <strong>The</strong> previous year included the minority owners’ share in <strong>Stena</strong>Technoworld a.s. (formerly <strong>Stena</strong> Safina a.s) in the amount of –2.3. This companies isnow 100% owned.Future soil remediation costs 321.7 315.7Unsecured pension commitments 107.0 95.3Other 150.1 145.0Total 578.8 556.049
NOTES TO THE FINANCIAL STATEMENTS28 Bond loans<strong>The</strong> loans are issued by AB <strong>Stena</strong> <strong>Metall</strong> Finans (publ) and guaranteed by the ParentCompany. <strong>The</strong> loans carry variable rates of interest.Bond loanRemainingmaturityAug. 31,2011Aug. 31,2010Series no. 101 2007-2014 3 years 600.0 800.0Series no. 102 2007-2015 4 years 300.0 300.0Series no. 103 2007-2014 3 years — 400.0Series no. 105 2007-2013 2 years 500.0 500.0Series no. 106 2007-2012 1 year 200.0 200.0Series no. 107 2010-2013 2 years 300.0 300.0Series no. 108 2010-2015 4 years 300.0 300.0Series no. 109 2010-2017 6 years 400.0 400.0Series no. 110 2011-2016 5 years 425.0 —Series no. 111 2011-2017 6 years 300.0 —Series no. 112 2011-2017 6 years 200.0 —Series no. 113 2011-2017 6 years 400.0 —Series no. 114 2011-2016 5 years NOK 750 888.8 —Summa 4,813.8 3,200.032 Other current liabilitiesAug. 31, 2011 Aug. 31, 2010Capitalized leasing commitments 73.7 66.9Employee salaries and withholding taxes 58.8 59.5Value-added tax 83.6 50.0Property tax 3.3 2.8Excise duties 0.2 0.1Other 52.2 62.2Total 271.8 241.533Accrued expensesand prepaid incomeAug. 31, 2011 Aug. 31, 2010Accrued cost of goods sold 434.3 329.3Accrued salaries and payroll overhead 314.1 293.4Interest 44.6 11.8Incineration and sludge reserve 53.5 2.3Other 138.5 209.6Total 985.0 846.429 Long-term loans from credit institutions<strong>The</strong> <strong>Group</strong> has credit commitments of 913.8, of which 913.8 has not been utilized.<strong>The</strong> agreement contains financial covenants.30 Short-term loans from credit institutionsAug. 31, 2011 Aug. 31, 2010Utilized bank overdraft facilities 210.9 185.5Loans 6.3 11.1Total 217.2 196.6<strong>The</strong> <strong>Group</strong> has credit commitments of 1,000.0, of which 789.1 has not been utilized.<strong>The</strong> agreement contains financial covenants.34 Assets pledged and contingent liabilitiesAug. 31, 2011 Aug. 31, 2010Assets pledged to credit institutionsReal estate mortgages 20.2 14.8Chattel mortgages 21.7 5.8Total 41.9 20.6Assets pledged for other liabilities, etc.Liquid assets 3.9 4.2Other long-term receivables 88.7 78.0Other 0.1 0.3Total 92.7 82.5Total assets pledged 134.6 103.131 Commercial paper<strong>The</strong> loans mature between 1 and 365 days. Back-stop agreements are in place.Contingent liabilitiesSureties 48.0 47.0Guarantees and other contingentliabilities 277.2 324.4Import letters of credit — 1.7Obligations for partnerships 6.0 4.5Total contingent liabilities 331.2 377.650
35 Cash flowIn the statement of cash flow, the effects of acquired subsidiaries and business units havebeen excluded from other changes in the balance sheet. <strong>The</strong> sum of payments for theseacquisitions after deducting liquid assets in the acquired units is reported on a separate linein the statement of cash flows. <strong>The</strong> effect of changes in exchange rates on the translationof foreign <strong>Group</strong> companies is also excluded, since it does not impact cash flow.Liquid assets consist of cash, bank balances and other money market instruments withan original term of less than three months.Interest paid during the year amounted to –178.2 (–187.4) and interest received to 88.9(123.8). Dividends received amounted to 12.4 (20.4).During the fiscal year companies and assets were acquired for an aggregate of 255.9(73.3). For these companies, the total value of the acquired assets and liabilities, purchaseprices and the effect on the <strong>Group</strong>’s liquid assets were as follows:Aug. 31, 2011 Aug. 31, 2010Intangible fixed assets 147.9 54.7Tangible fixed assets 93.9 78.2Inventories 21.9 9.6Other assets 111.8 92.5Minority interests –2.4 –8.7Provisions –9.9 –3.0Liabilities –128.8 –180.5Assets and liabilities, net 234.4 42.8Purchase price paid 255.9 73.3Cash and bank balancesin acquired companies –21.5 –30.5Effect on the <strong>Group</strong>’s liquid assets 234.4 42.836 Leasing<strong>Group</strong> as lesseeOperating leases relate primarily to time chartered vessels. Properties are leased as well.<strong>The</strong> cost of operating leases for the year amounted to 153.0 (135.5).<strong>The</strong> <strong>Group</strong>’s finance leases cover company cars and equipment. <strong>The</strong>ir acquisitionvalue as of the closing day was 164.1 (149.0), while their net carrying value was 73.7(69.0).Future minimum lease fees as of the closing day amounted to:37 Financial instruments/risks<strong>The</strong> <strong>Stena</strong> <strong>Metall</strong> <strong>Group</strong>’s operations are exposed to various types of financial risks.<strong>The</strong> <strong>Group</strong> uses financial instruments in accordance with the rules of its financial policyto reduce the risk of a major impact on income from these risks.Fixed assets are financed in local currency. Working capital is financed in localcurrency or in the currency in which the sales proceeds are expected to be paid. Tothe extent assets and liabilities in each currency cannot be matched, the net positionis adjusted with the help of financial instruments.Currency risks arise in part through the translation of income and balance sheetitems in foreign currency to Swedish kronor and in part through the translation of cashflows in foreign currency. <strong>The</strong>se currency risks are reduced by hedging exchange rateswith forward exchange contracts or currency option contracts.<strong>The</strong>se financial risks are managed in accordance with the authorization limits statedin the <strong>Group</strong>’s financial policy by the finance department through the units in Swedenand Switzerland, as well as through operating units with regard to inventory risks.All financial instruments are traded with counterparties that are considered to havesatisfactory creditworthiness and where the terms and settlement routines are welldocumented. Normally no collateral is pledged by either party for any credit risks infi n a n c i a li n s t r u m e n t s .Currency risksCurrency risks in <strong>Stena</strong> <strong>Metall</strong>’s operations are related to changes in the value of contractedand anticipated future payment flows, changes in the value of loans and investments,and changes in the value of assets and liabilities in foreign subsidiaries.<strong>The</strong> <strong>Group</strong>’s policy is to hedge a large part of anticipated future payment flows basedon the transactions it enters into. Shareholders’ equity in foreign subsidiaries is hedged ona case-to-case basis. <strong>The</strong> same applies to income in local currency.<strong>The</strong> following table shows the <strong>Group</strong>’s forward contracts as per the closing day.Forward contracts, value in SEK million Bought SoldCHF 61.5DKK 56.4EUR 42.8NOK 29.1PLN 9.7SEK 555.0USD 487.7Nominal amountCurrency option contracts —OperatingleasesFinanceleases<strong>The</strong> following table summarizes the contracts entered into to hedge the <strong>Group</strong>’s loanportfolio:Within one year 118.6 13.9Later than one year but within five years 395.5 12.3Later than five years 77.8 —Total minimum lease fees 591.9 26.2Interest rate swapsCurrencyNominalamount SEK million MaturityAUD 1.0 6.4 2011-12-30CZK 28.0 10.7 2011-12-30DKK 470.0 578.4 2011-12-30EUR 118.5 1,089.5 2011-12-30GBP 0.6 6.7 2011-12-30HKD 1.8 1.5 2011-12-30NOK 97.6 114.3 2011-12-30PLN 179.0 391.9 2011-12-30USD 189.0 1,207.2 2011-12-3051
NOTES TO THE FINANCIAL STATEMENTSNote 37 Financial instruments/risks. continuedTradingAs a minor part of its operations, the Finance business area trades currency and fixedincome instruments. All trades take place within the guidelines of the <strong>Group</strong>’s authorizationlimits. All trading positions are marked to market in the closing accounts, andthe change in value is posted against income for the period.Interest rate risksInterest rate risks refer to risks that changes in interest rate levels will affect the <strong>Group</strong>’sincome and cash flow or the fair value of financial assets and liabilities. <strong>The</strong> goal is tominimize interest rate risks in the form of imbalances between interest-bearing items inthe balance sheet with variable and fixed interest rates and the fixed interest rate periodson a significant share of net cash (cash and bank balances less interest-bearing liabilities).By matching the fixed interest period of financial assets and liabilities, the exposure tointerest rate risks is reduced. Interest rate swaps are used to change the fixed interestperiod of the <strong>Group</strong>’s financial assets and liabilities.Credit risks<strong>The</strong> <strong>Group</strong>’s receivables from counterparties are managed according to established routines.Each counterparty is assigned a limit based on its estimated solvency and profitmargins.Liquidity risksTo meet the <strong>Group</strong>’s need for liquid assets, agreements have been entered into with severalmajor banks on credit facilities amounting to SEK 1.9 billion, of which SEK 1.7 billion hasnot been utilized. <strong>The</strong> agreements contain financial covenants.Inventory risksTo minimize the risk of a price drop for inventory assets, the financial policy specifies thelowest and highest allowable inventory levels. Any price drops are reported as incurredagainst income.Oil risks<strong>Stena</strong> Oil consumes about 12,000 tons of bunker oil per year. <strong>The</strong> price exposure isreduced through forward contracts covering approximately 50% of its consumption.<strong>The</strong>se contracts are valued at approximately USD 824,000 as of August 31, 2011. Otherforward contracts held on behalf of customers are backed by satisfactory collateral.Other financial agreements<strong>The</strong> <strong>Stena</strong> <strong>Metall</strong> <strong>Group</strong>’s net electricity consumption is approximately 81 GWh per year.To reduce its exposure to fluctuations in the price of electricity, the <strong>Group</strong> hedges its purchasesby buying forward contracts on the Nordic Electricity Exchange. Forward contractsare purchased according to a predetermined rolling schedule over a four-year period. As ofAugust 31, 2011, 88% of purchases were hedged for the coming financial year. About 78%of purchases are hedged for 2012-2013 and 56% of purchases for 2013-2014.Market valuation Book value Market valueAssetsListed securities 929.5 1.003.1Current receivables 2,935.0 2,935.0LiabilitiesLoans from credit institutions 256.3 256.3Bond loans 4,813.8 4,813.8Accounts payable 1,799.1 1,799.1Holdings for hedging purposesInterest risk management — –17.4Currency risk management 10.9 3.1Oil risk management 7.0 –5.1Metal risk management –2.4 –6.138 Related party information<strong>Stena</strong> AB<strong>Stena</strong> <strong>Metall</strong>’s subsidiary <strong>Stena</strong> Oil AB sells bunker oil for ships to the <strong>Stena</strong> AB <strong>Group</strong>.<strong>The</strong> value of these sales amounted to 2,420.7 (2,059.1).<strong>The</strong> <strong>Stena</strong> <strong>Group</strong> also performs certain services for <strong>Stena</strong> <strong>Metall</strong>, for which 2.1 (0.8)has been paid.<strong>Stena</strong> Line IT Services AB and <strong>Stena</strong> Line Scandinavia AB have been paid 6.8 (5.6) forthe <strong>Stena</strong> <strong>Metall</strong> <strong>Group</strong>’s portion of shared costs. In addition, 0.2 (0.3) has been paid to<strong>Stena</strong> Fastigheter AB for rents and property management.Olsson family<strong>Stena</strong> <strong>Metall</strong> rents offices from the family. Rents paid amounted to 7.8 (7.8).<strong>Stena</strong> <strong>Metall</strong> has pledged to pay a lifetime, indexed pension to Sten A. Olsson.Financial instruments – market valuation<strong>The</strong> table below indicates the market value of financial instruments in the balance sheetand financial derivatives outside the balance sheet. When determining market value,listed prices as of August 31 have primarily been used when available. For certain instrumentswith short terms, such as liquid assets, accounts receivable, accounts payable andshort-term loan liabilities, book value has been used instead. Estimations of the marketvalue of listed financial instruments are based on closing values, i.e., the market valuethat would be obtained or paid for the instrument in question.<strong>The</strong> following table shows the market value of financial instruments:52
PARENT COMPANYINCOME STATEMENTSeptember 1–August 31, SEK million Note 2010/2011 2009/2010Net sales 74.9 62.9Cost of goods sold 4 –31.2 –28.5Gross income 43.7 34.4Administrative expenses 1, 2, 3, 4 –23.9 –8.9Other operating income 1.3 2.8Operating income 21.1 28.3Interest income and similar credits 5 24.6 18.7Interest expenses and similar charges 6 –11.1 –7.8Income after financial items 34.6 39.2Appropriations 7 –0.5 0.8Income before tax 34.1 40.0Taxes 8 –10.0 4.7Net income for the year 24.1 44.7PARENT COMPANYSTATEMENT OF CHANGESIN SHAREHOLDERS’ EQUITYShare capitalRestricted reservesUnrestrictedreservesNet income/lossTotalshareholders’equityOpening balance, September 1, 2009 13.0 2.6 819.7 1,015.8 1,851.1Transfer of previous year’s income 1,015.8 –1,015.8 —<strong>Group</strong> contributions 164.1 164.1Tax effect of <strong>Group</strong> contributions –43.2 –43.2Merger of wholly owned subsidiaries –7.6 –7.6Net income for the year 44.7 44.7Closing balance, August 31, 2010 13.0 2.6 1,948.8 44.7 2,009.1Transfer of previous year’s income 44.7 –44.7 —Dividend –49.5 –49.5<strong>Group</strong> contributions 526.5 526.5Tax effect of <strong>Group</strong> contributions –138.4 –138.4Net income for the year 24.1 24.1Closing balance, August 31, 2011 13.0 2.6 2,332.1 24.1 2,371.853
PARENT COMPANYBALANCE SHEETAugust 31, SEK million Note 2011 2010ASSETSFixed assetsTangible fixed assetsBuildings 9 266.4 279.0Land and other real estate 10 224.0 218.3Plant and machinery 11 4.9 5.9Equipment 12 10.8 9.2Construction in progress 13 12.2 0.5Total tangible fixed assets 518.3 512.9Financial fixed assetsReceivables from <strong>Group</strong> companies 89.9 57.5Shares and participations in <strong>Group</strong> companies 14 494.6 494.5Other long-term securities holdings 3.0 —Other long-term receivables 15 96.0 82.4Total financial fixed assets 683.5 634.4Total fixed assets 1,201.8 1,147.3Current assetsCurrent receivablesAccounts receivable 1.5 1.6Receivables from <strong>Group</strong> companies 1,516.6 1,088.2Other receivables 4.8 6.7Prepaid expenses and accrued income 7.4 7.6Total current receivables 1,530.3 1,104.1Cash and bank balances 25.0 6.3Total current receivables 1,555.3 1,110.4TOTAL ASSETS 2,757.1 2,257.754
August 31, SEK million Note 2011 2010SHAREHOLDERS’ EQUITY AND LIABILITIESShareholders’ equityRestricted equityShare capital, 130,000 shares 13.0 13.0Restricted reserves 2.6 2.6Total restricted shareholders’ equity 15.6 15.6Unrestricted equityUnrestricted reserves 2,332.1 1,948.8Net income for the year 24.1 44.7Total unrestricted equity 2,356.2 1,993.5Total shareholders’ equity 2,371.8 2,009.1Untaxed reserves 16 9.3 8.8ProvisionsProvisions for deferred taxes 1.7 1.8Other provisions 17 88.8 80.3Total provisions 90.5 82.1Long-term liabilitiesLoans from <strong>Group</strong> companies 64.2 32.9Total long-term liabilities 64.2 32.9Current liabilitiesAdvances from customers 1.4 —Accounts payable 7.5 8.4Loans from <strong>Group</strong> companies 15.4 —Tax liability 151.0 53.0Other liabilities 6.8 6.3Accrued expenses and prepaid income 18 39.2 57.1Total current liabilities 221.3 124.8TOTAL SHAREHOLDERS’ EQUITY AND LIABILITIES 2,757.1 2,257.7Assets pledged 19 74.5 64.7Contingent liabilities 19 9,347.9 8,009.455
PARENT COMPANYSTATEMENT OF CASH FLOWSSeptember 1–August 31, SEK million Note 2010/2011 2009/2010Operating activitiesIncome after financial items 34.6 39.1Adjustments for non-cash items, etc. 33.9 11.068.5 50.1Taxes repaid/paid –55.1 45.9Cash flow from operating activities before changes in working capital 13.4 96.0Cash flow from changes in working capitalIncrease (–)/decrease (+) in current receivables –51.6 –28.3Increase (+)/decrease (–) in current liabilities –1.5 1.2Cash flow from operating activities –39.7 68.9Investing activitiesAcquisition of subsidiaries –0.1 –0.1Acquisition of tangible fixed assets –38.6 –36.4Disposal of tangible fixed assets 7.8 8.6Loans to <strong>Group</strong> companies –31.3 –32.9Acquisition of financial assets –3.0 —Cash flow from investing activities –65.2 –60.8Financing activitiesLoan proceeds 31.3 32.9Share dividend –49.5 —<strong>Group</strong> contributions received 163.1 —<strong>Group</strong> contributions paid –21.3 –34.8Cash flow from financing activities 123.6 –1.9Cash flow for the year 18.7 6.2Liquid assets, September 1 6.3 0.1Liquid assets, August 31 25.0 6.3Supplemental disclosure to statement of cash flows 20Adjustments for non-cash items, etc.Depreciation and impairment losses on assets 24.9 25.9Capital gain/loss on sale of fixed assets 0.4 –0.1Other provisions 8.6 –14.8Total 33.9 11.056
PARENT COMPANYNOTES TO THE FINANCIALSTATEMENTS1 PersonnelFor information on the number of employees, salary, other compensation and socialinsurance contributions for employees, see Note 1 to the consolidated financial statements.2 Fees to auditors2010/2011 2009/2010Audit feesKPMG 2.0 2.2Revisionstjänst Andrésen & Ljungberg AB 0.1 0.1Total 2.1 2.3Other servicesKPMG 0.1 0.1Total 0.1 0.1Audit assignments refer to the review of the annual report and accounts and the administrationby the Board of Directors and the President. Also included are other duties thatare the responsibility of the company’s auditors as well as consulting or other assistanceresulting from observations during such reviews or the implementation of such otherduties. All other work is considered other services.5 Interest income and similar credits2010/2011 2009/2010Interest income, external 0.3 0.2Interest income, <strong>Group</strong> companies 17.5 16.0Exchange rate gains 6.8 2.5Total 24.6 18.76 Interest expenses and similar charges2010/2011 2009/2010Interest expenses, <strong>Group</strong> companies –1.5 –3.7Exchange rate losses –9.6 –4.1Total –11.1 –7.87 Appropriations2010/2011 2009/2010Provision for/Reversal of accumulatedaccelerated depreciation –0.5 0.8Total –0.5 0.83 Leasing<strong>The</strong> year’s leasing expense for assets owned via operating leases, including leases onpremises, amounted to 10.2 (10.7).4 Operating expenses2010/2011 2009/2010Depreciation accordingto plan by itemCost of goods sold –20.5 –20.8Administrative expenses –4.3 –5.1Total –24.8 –25.9Depreciation accordingto plan by assetBuildings –16.4 –16.6Land improvements –3.2 –3.3Plant and machinery –1.0 –1.1Equipment –4.2 –4.9Total –24.8 –25.957
PARENT COMPANY NOTES TO THE FINANCIAL STATEMENTS8 Taxes10 Land and other real estate9 Buildings2010/2011 2009/2010Current tax –14.6 –12.5Deferred tax 4.6 17.2Total –10.0 4.7Current tax is distributed as follow:Current tax for the period –14.6 –12.1Adjustment of tax for previous years — –0.4Total –14.6 –12.5Reconciliation of reportedtax charge/tax claimIncome before tax 34.1 40.0Tax according to current tax rate(26.3%) –9.0 –10.5Non-deductible expenses –3.8 –6.4Tax-exempt revenue 0.1 7.5Tax attributable to previous years — 14.1Other 2.7 —<strong>Report</strong>ed tax claim/charge –10.0 4.7Tax items reported directly againstshareholders’ equityCurrent tax in <strong>Group</strong> contributionsreceived/paid –138,4 –43,2Total –138,4 –43,2Aug. 31, 2011 Aug. 31, 2010Acquisition value, opening balance 453.0 441.0Merged companies — 5.2Acquisitions from <strong>Group</strong> companies 3.8 0.5Acquisitions during the year 0.1 9.3Reclassification 0.4 2.5Sales and disposals –0.5 –5.5Acquisition value, closing balance 456.8 453.0Aug. 31, 2011 Aug. 31, 2010Acquisition value, opening balance 245.5 229.2Merged companies — 2.6Acquisitions during the year 6.9 14.4Reclassifications 2.1 0.3Sales and disposals –0.1 –1.0Acquisition value, closing balance 254.4 245.5Accumulated depreciation,opening balance –27.2 –23.8Accumulated depreciation in mergedcompanies, opening balance — –0.2Depreciation for the year –3.2 –3.2Accumulated depreciation,closing balance –30.4 –27.2Residual value according to plan 224.0 218.3Accelerated depreciation –0.1 –0.1Net carrying value 223.9 218.211 Plant and machineryAug. 31, 2011 Aug. 31, 2010Acquisition value, opening balance 40.5 40.1Acquisitions during the year — 0.4Acquisition value, closing balance 40.5 40.5Accumulated depreciation,opening balance –34.6 –33.5Depreciation for the year –1.0 –1.1Accumulated depreciation,closing balance –35.6 –34.6Residual value according to plan 4.9 5.9Accelerated depreciation –4.0 –5.3Net carrying value 0.9 0.6Accumulated depreciation,opening balance –174.0 –158.3Accumulated depreciation in mergedcompanies, opening balance — –2.3Sales and disposals — 3.2Depreciation for the year –16.4 –16.6Accumulated depreciation,closing balance –190.4 –174.0Residual value according to plan 266.4 279.0Accelerated depreciation –2.9 –3.4Net carrying value 263.5 275.658
12 EquipmentAug. 31, 2011 Aug. 31, 2010Acquisition value, opening balance 70.5 73.5Acquisitions during the year 5.8 1.4Sales and disposals –0.5 –4.4Acquisition value, closing balance 75.8 70.5Accumulated depreciation,opening balance –61.3 –60.8Sales and disposals 0.5 4.4Depreciation for the year –4.2 –4.9Accumulated depreciation,closing balance –65.0 –61.3Residual value according to plan 10.8 9.2Accelerated depreciation –2.4 —Net carrying value 8.4 9.216 Untaxed reservesOpeningbalanceAllocation/dissolution forthe yearNet carryingvalueAccelerated depreciation:Buildings 3.4 –0.5 2.9Land improvements 0.1 — 0.1Plant and machinery 5.3 1.0 6.3Total 8.8 0.5 9.3Of the untaxed reserves, 2.4 (2.3) refers to deferred tax.17 Other provisionsAug. 31, 2011 Aug. 31, 2010Unsecured pension commitments 88.8 76.9Other — 3.4Total 88.8 80.313 Construction in progressAug. 31, 2011 Aug. 31, 2010Acquisition value, opening balance 0.5 3.4Acquisitions during the year 22.0 5.2Reclassification –2.5 –2.8Sold to <strong>Group</strong> companies –7.8 –5.3Net carrying value 12.2 0.518Accrued expensesand prepaid incomeAug. 31, 2011 Aug. 31, 2010Accrued salaries 19.8 31.1Accrued social insurance contributions 9.4 11.7Other 10.0 14.3Total 39.2 57.114Shares and participationsin <strong>Group</strong> companies<strong>The</strong> <strong>Group</strong>’s holdings of shares and participations are specified on pages 60-61.During the year the following acquisitions and changes affected companies in the<strong>Group</strong>.On November 30, 2010 <strong>Stena</strong> Technoworld AB’ s Italian subsidiary, <strong>Stena</strong> Technoworldsrl, acquired all the shares in SIRA srl. On January 1, 2011 <strong>Stena</strong> Stål AB acquired AHABSteel AB (now <strong>Stena</strong> Stål Storfors AB).<strong>Stena</strong> Recycling AS acquired the Norwegian recycling company Aanerød AS onMay 31, 2011 and on the same date purchased <strong>Stena</strong> Recycling AB 100% of the sharesin the former partly owned company Kretsloppsparken Kristianstad AB. <strong>Stena</strong> RecyclingAB also established Refero-Bilretur AB together with Sveriges Bilskrotares RiksförbundService. <strong>Stena</strong> Recycling AB’s ownership interest is 51%.SMG Glava AB was acquired on March 31, 2011. A sales company – <strong>Stena</strong> RecyclingGmbH – was established during the year in Germany. Moreover, a company was formedin Hong Kong, <strong>Stena</strong> Metal Asia Ltd.As of September 1, 2010 <strong>Stena</strong> Miljö AB was merged with <strong>Stena</strong> Recycling AB.15 Other long-term receivables19 Assets pledged and contingent liabilitiesAug. 31, 2011 Aug. 31, 2010Assets pledgedOther long-term receivables 74.5 64.7Total assets pledged 74.5 64.7Contingent liabilitiesSureties for subsidiaries 9,300.3 7,958.7Other sureties 44.0 47.0Pension commitments 3.6 3.7Total contingent liabilities 9,347.9 8,009.420 Cash flowExternal interest received and paid amounted to 0.3 (0.2) and –0.1 (0.0), respectively.Aug. 31, 2011 Aug. 31, 2010Receivables from insurance companies 74.5 64.7Deferred tax claims 21.5 17.0Other — 0.7Total 96.0 82.459
PARENT COMPANYSHARES AND PARTICIPATIONSIN GROUP COMPANIESShares in Swedish <strong>Group</strong> companies Corp. ID number Registered office Holding, %Net carryingvalue SEK 0008/31/11Net carryingvalue SEK 0008/31/10<strong>Stena</strong> Fragmentering AB 556012-5691 Göteborg 100 250,528 250,528<strong>Stena</strong> Aluminium AB 556039-3075 Älmhult 100 71,400 71,400<strong>Stena</strong> Recycling AB 556132-1752 Göteborg 100 45,325 45,325<strong>Stena</strong> Regalia AB 556236-0841 Göteborg 100 30,050 30,050<strong>Stena</strong> Miljöteknik AB 556139-0922 Göteborg 100 12,200 12,200Förmasten AB 556308-1396 Göteborg 100 7,570 7,570<strong>Stena</strong> Metal International AB 556732-2895 Göteborg 100 5,000 5,000Adactum AB 556628-8246 Göteborg 100 5,000 5,000<strong>Stena</strong> Oil AB 556236-0288 Göteborg 100 2,350 2,350AB <strong>Stena</strong> <strong>Metall</strong> Finans 556008-2561 Göteborg 100 1,200 1,200<strong>Stena</strong> Stål AB 556077-5925 Göteborg 100 500 500<strong>Stena</strong> <strong>Metall</strong> Service AB 556732-2903 Göteborg 100 100 —<strong>Stena</strong> Resurs 1 AB 556732-2887 Göteborg 100 100 100<strong>Stena</strong> Technoworld AB 556443-2184 Göteborg 100 5 5Brattholmen AB 556809-9146 Göteborg 100 50 50Ormudden Invest AB 556809-9112 Göteborg 100 50 50KB Pinnen i Göteborg 916835-1493 Göteborg 50 — —<strong>Stena</strong> Stål HB 916557-4246 Göteborg 50 — —Total 431,428 431,328Shares in foreign <strong>Group</strong> companies<strong>Stena</strong> Recycling Oy Finland 100 41,452 41,452<strong>Stena</strong> Recyling AS Norway 100 11,415 11,415<strong>Stena</strong> Metal Inc. USA 100 10,315 10,315OOO <strong>Stena</strong> Trading Russia 100 — 2Subtotal 63,182 63,184Total 494,609 494,512<strong>Group</strong> companies’ holdings of shares and participations Corp. ID number Registered office Holding, %<strong>Stena</strong> Fragmentering ABSMG Glava AB 556610-2231 Göteborg 100<strong>Stena</strong> <strong>Metall</strong> A/S Denmark 100<strong>Stena</strong> Recycling Sp. z o.o. Poland 100OOO Chermet Invest Russia 100<strong>Stena</strong> Recycling ABAB Skandinaviska Oljecentralen 556198-2744 Jönköping 100Kretsloppsparken Kristianstad AB 556530-2816 Kristianstad 100Refero-Bilretur AB 556814-7457 Göteborg 51<strong>Stena</strong> Scanpaper GmbH Germany 100<strong>Stena</strong> Regalia AB<strong>Stena</strong> Stål HB 916557-4246 Göteborg 50Wockatz & Co i Göteborg AB 556155-3974 Göteborg 100Safe Regalias Intressenter HB 916835-0727 Göteborg 50Wockatz & Co i Göteborg ABSafe Regalias Intressenter HB 916835-0727 Göteborg 5060Förmasten ABKB Pinnen i Göteborg 916835-1493 Göteborg 50
<strong>Group</strong> companies’ holdings of shares and participations Corp. ID number Registered office Holding, %<strong>Stena</strong> Metal International AB<strong>Stena</strong> Metal Asia Limited Hong Kong 100AB <strong>Stena</strong> <strong>Metall</strong> Finans<strong>Stena</strong> Resurs 4 AB 556732-2911 Göteborg 100Sten Met Insurance AG Switzerland 100<strong>Stena</strong> <strong>Metall</strong> Holding Limited Malta 100<strong>Stena</strong> <strong>Metall</strong> Holding Limited<strong>Stena</strong> <strong>Metall</strong> Limited Malta 100<strong>Stena</strong> Stål AB<strong>Stena</strong> Stål Molkom AB 556065-0359 Karlstad 100<strong>Stena</strong> Stål Nybro AB 556179-4628 Nybro 100<strong>Stena</strong> Stål Oskarshamn AB 556348-1455 Oskarshamn 100<strong>Stena</strong> Stål Storfors AB (fd AHAB Steel AB) 556396-8295 Filipstad 100Söderberg & Björk AB 556394-2662 Göteborg 100<strong>Stena</strong> Stål Moss AS Norway 100<strong>Stena</strong> Technoworld AB<strong>Stena</strong> Nera AB 556719-5465 Göteborg 100<strong>Stena</strong> <strong>Metall</strong> Holding GmbH Germany 100<strong>Stena</strong> Technoworld GmbH Austria 100<strong>Stena</strong> Technoworld srl Italy 100<strong>Stena</strong> Technoworld, a.s. (fd <strong>Stena</strong> Safina, a.s.) Czech Republic 100SC <strong>Stena</strong> DTM SRL Romania 75<strong>Stena</strong> Technoworld Asia Pacific Co Ltd Hong Kong 51<strong>Stena</strong> <strong>Metall</strong> Holding GmbHGriag Glasrecycling AG Germany 100<strong>Stena</strong> Technoworld GmbH Germany 100<strong>Stena</strong> Technoworld GmbHSTENA Technoworld International GmbH Austria 100<strong>Stena</strong> Technoworld srl<strong>Stena</strong> S.I.A.T. srl Italy 70S.I.R.A.srl Italy 100MP Ambiente S.p.A. Italy 100MP Ambiente S.p.A.R.P.S. Ambiente srl Italy 100Elettro Recycling srl Italy 100Videorecycling srl Italy 100<strong>Stena</strong> Recycling ASAanerød AS Norway 100<strong>Stena</strong> Recycling Oy<strong>Stena</strong> Technoworld Oy Finland 100<strong>Stena</strong> <strong>Metall</strong> A/SAverhoff & Co A/S Denmark 100<strong>Stena</strong> Jern & Metal A/S Denmark 100<strong>Stena</strong> Miljø A/S Denmark 100<strong>Stena</strong> Technoworld A/S Denmark 100<strong>Stena</strong> Jern & Metal A/SDansk Genbrug aps. Denmark 100Nordic Sea Service aps. Denmark 100<strong>Stena</strong> Recycling GmbH Germany 10061
PROPOSED DISTRIBUTIONOF EARNINGS<strong>Group</strong>According to the consolidated balance sheet as of August 31, 2011,the <strong>Group</strong>’s unrestricted earnings amounted to SEK 4,073.2 million,of which SEK 336.6 million was net income for the year.Parent company<strong>The</strong> Board of Directors and the President propose that the unappropriatedearnings in the Parent Company at the disposal of the<strong>Annual</strong> General Meeting:SEK thousandsRetained earnings 2,332,063Net income for the year 24,091Unrestricted equity 2,356,154be distributed as follows:To the shareholders, a dividend ofSEK 346.15 per share 52,500To the Sten A. Olsson Foundation forResearch and Culture, a donation of 5,000To be carried forward 2,298,654Total 2,356,154Göteborg, October 19, 2011Dan Sten Olsson Sten Jakobsson Lennart JeanssonChairmanMårten Hulterström John Lindqvist M Johan WiderbergPer KaufmannAnders JanssonPresident and CEOTonny FogelqvistEmployee representativeStig-Göran SvenssonEmployee representativeOur auditors’ report was submitted on October 19, 2011Cronie WallquistAuthorized Public AccountantUlf AndrésenAuthorized Public Accountant62
AUDITORS’ REPORTTo the <strong>Annual</strong> General Meeting of <strong>Stena</strong> <strong>Metall</strong> ABCorporate identity number 556138-8371We have audited the annual accounts, the consolidated accounts,the accounting records and the administration of <strong>Stena</strong> <strong>Metall</strong> ABby the Board of Directors and the President for the fiscal yearSeptember 1, 2010–August 31, 2011. <strong>The</strong> annual accounts and theconsolidated accounts are included on pages 32–62 of the printedversion of this document. <strong>The</strong>se accounts and the administrationof the company and the application of the <strong>Annual</strong> Accounts Actwhen preparing the annual accounts and the consolidatedaccounts are the responsibility of the Board of Directors and thePresident. Our responsibility is to express an opinion of the annualaccounts, the consolidated accounts and the administration basedon our audit.We conducted our audit in accordance with generally acceptedauditing standards in Sweden. Those standards require that we planand perform the audit to obtain high but not absolute assurancethat the annual accounts and the consolidated accounts are freeof material misstatement. An audit includes examining, on a testbasis, evidence supporting the amounts and disclosures in theaccounts. An audit also includes assessing the accounting principlesand their application by the Board of Directors and the Presidentand significant estimates made by the Board of Directors and thePresident when preparing the annual accounts and the consolidatedaccounts as well as evaluating the overall presentation of informationin the annual accounts and the consolidated accounts. As a basisfor our opinion concerning discharge from liability, we have examinedsignificant decisions, actions taken and the circumstances of thecompany in order to be able to determine the liability, if any, tothe company of any Board member or the President. We have alsoexamined whether any Board member or the President has, in anyother way, acted in contravention of the Swedish Companies Act,the <strong>Annual</strong> Accounts Act or the Articles of Association. We believethat our audit provides a reasonable basis for our opinion set outbelow.<strong>The</strong> annual accounts and the consolidated accounts have beenprepared in accordance with the <strong>Annual</strong> Accounts Act and give atrue and fair view of the company’s and the <strong>Group</strong>’s financial positionand results of operations in accordance with generally acceptedauditing standards in Sweden. <strong>The</strong> statutory administration reportis consistent with the other parts of the annual accounts and theconsolidated accounts.We recommend to the annual meeting of shareholders that theincome statements and balance sheets of the Parent Company andthe <strong>Group</strong> be adopted, that the profit of the Parent Company bedealt with in accordance with the proposal in the administrationreport and that the members of the Board of Directors and thePresident be discharged from liability for the fiscal year.Göteborg, October 19, 2011Cronie WallquistAuthorized Public AccountantUlf AndrésenAuthorized Public Accountant63
BOARD OF DIRECTORSFrom left:ANDERS JANSSON President & CEO, Göteborg DAN STEN OLSSON Chairman, Executive, Göteborg LENNART JEANSSON Executive, GöteborgM JOHAN WIDERBERG Executive, Göteborg MÅRTEN HULTERSTRÖM Attorney, Göteborg JOHN LINDQVIST EVP, GöteborgADDRESSESSWEDEN<strong>Stena</strong> <strong>Metall</strong> Service ABFiskhamnsgatan 8Box 4088SE-400 40 GöteborgSwedenPhone +46 10 445 00 00<strong>Stena</strong> <strong>Metall</strong> ABFiskhamnsgatan 8Box 4088SE-400 40 GöteborgSwedenPhone +46 10 445 00 00AB <strong>Stena</strong> <strong>Metall</strong>Finans (publ)Fiskhamnsgatan 8Box 4088SE-400 40 GöteborgSwedenPhone +46 10 445 00 00<strong>Stena</strong> MetalInternational ABFiskhamnsgatan 8Box 4088SE-400 40 GöteborgSwedenPhone +46 10 445 00 0064<strong>Stena</strong> Recycling ABFiskhamnsgatan 8Box 4088SE-400 40 GöteborgSwedenPhone +46 10 445 00 00<strong>Stena</strong> Aluminium ABGotthards Gata 5Box 44SE-343 21 ÄlmhultSwedenPhone +46 10 445 95 00<strong>Stena</strong> Technoworld ABFiskhamnsgatan 8Box 4054SE-400 40 GöteborgSwedenPhone +46 10 445 00 00<strong>Stena</strong> Oil ABFiskhamnsgatan 8Box 4088SE-400 40 GöteborgSwedenPhone +46 10 445 00 00<strong>Stena</strong> Stål ABFiskhamnsgatan 8Box 4088400 40 GöteborgSwedenPhone +46 10 445 00 00<strong>Stena</strong> Miljöteknik ABFiskhamnsgatan 8Box 4088SE-400 40 GöteborgSwedenPhone +46 10 445 00 00DENMARK<strong>Stena</strong> Recycling A/SBanemarksvej 40DK-2605 BrøndbyDenmarkPhone +45 56 67 95 50<strong>Stena</strong> Technoworld A/SBanemarksvej 40DK-2605 BrøndbyDenmarkPhone +45 44 91 44 00NORWAY<strong>Stena</strong> Recycling ASTretjerndalsveien 70Postboks 63NO-2016 FrognerNorwayPhone +47 63 86 86 00Aanerød ASTretjerndalsveien 70Postboks 63NO-2016 FrognerNorwayPhone +47 63 86 86 00<strong>Stena</strong> Stål Moss ASÅrvollskogen 79Postboks 2098NO-1521 MossNorwayPhone + 47 69 23 54 00FINLAND<strong>Stena</strong> Recycling OyÄyritie 8 CFIN-01510 VantaaFinlandPhone +358 10 802 323<strong>Stena</strong> Technoworld OyÄyritie 8 CFIN-01510 VantaaFinlandPhone +358 108 0188
From left:PER KAUFMANN Executive, Feucherolles, France STEN JAKOBSSON Executive, VästeråsEmployee representatives: TONNY FOGELQVIST Oskarshamn STIG-GÖRAN SVENSSON GöteborgPETER ERNSTRÖM Deputy, Göteborg RONNY PERSSON Deputy, HalmstadAuditors: CRONIE WALLQUIST Authorized Public Accountant ULF ANDRÉSEN Authorized Public AccountantPOLAND<strong>Stena</strong> Recycling Sp. z o.o.Ul. Ogrodowa 58PL-00-876 WarsawPolandPhone +48 22 520 27 00USA<strong>Stena</strong> Metal Inc.1 Landmark SquareSuite 720Stamford, CT 06901USAPhone +1 203 357 0111SWITZERLAND<strong>Stena</strong> <strong>Metall</strong> Limited,Zug branchBahnhofplatzCH-6300 ZugSwitzerlandPhone +41 417 28 81 21AUSTRIA<strong>Stena</strong> Technoworld GmbHAlbert Schweitzer-Gasse 11A-1140 ViennaAustriaPhone +43 1 78 64 60 3GERMANY<strong>Stena</strong> Technoworld GmbHLangenhorner Chaussee 40D-22335 HamburgGermanyPhone +49 402 800 670GRIAG Glasrecycling AGTemnitz-Park-Chaussee 41D-168 18 WerderGermanyPhone +49 33 92 05 08 0<strong>Stena</strong> Recycling GmbhAm Kaiserkai 1D-20457 HamburgGermanyPhone: +49 40 808074 569CZECH REPUBLIC<strong>Stena</strong> Technoworld a.s.a.s PolnÍ 460CZ-252 29 Lety u DobřichovicCzech RepublicPhone +420 246 089 234ITALY<strong>Stena</strong> Technoworld srlViale Certosa, 247IT-20151 MilanItalyPhone +39 02 30 70 21ROMANIASC <strong>Stena</strong> DTM SRLStr. Prelungirea Soselei Giurgiului, Nr33A Jilava, Jud IlfovCod Postal 077120RomaniaPhone +40 31 824 76 80/81/82CHINA<strong>Stena</strong> Metal Asia Ltd20th Floor, Central Tower28 Queen’s Road, CentralHong KongPhone: +852 2159 9689<strong>Stena</strong> Technowold Asia PacificCompany LtdRoom 1511, Ocean CentreNo 5. Canton ToadTsim Sha Tsui, KowloonHong KongThanks to all our customers, partners and employeeswho participated in the annual report.Photography: Pontus Almén, Wolfgang Amri, Hartwall, Mick Olsen,Nicklas Rudfell, Mats SamuelssonPrinting: Göteborgstryckeriet. Paper/ink: Printed on paperwith 100% recycled fibers and with vegetable-based ink.Produced by the <strong>Stena</strong> <strong>Metall</strong> <strong>Group</strong> in cooperation with Solberg.
Printed on100% recycledpaper<strong>Stena</strong> <strong>Metall</strong> AB • Fiskhamnsgatan 8 • Box 4088 • SE-400 40 Göteborg, Sweden • Phone +46-10-445 00 00www.stenametall.com