Mesick Merced Extinction - California Sportfishing Protection Alliance
Mesick Merced Extinction - California Sportfishing Protection Alliance
Mesick Merced Extinction - California Sportfishing Protection Alliance

You also want an ePaper? Increase the reach of your titles
YUMPU automatically turns print PDFs into web optimized ePapers that Google loves.
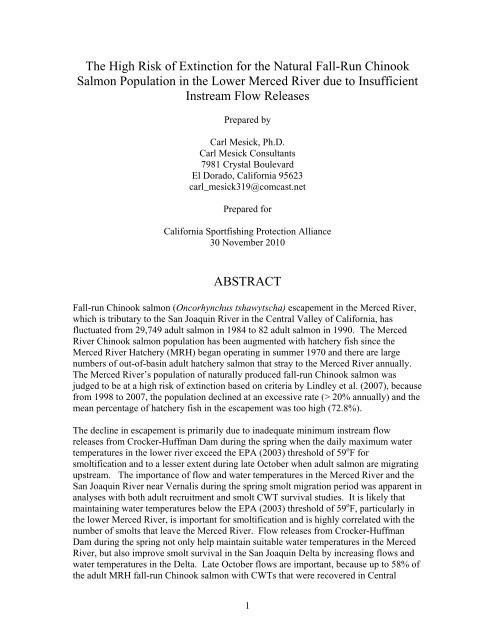
The High Risk of <strong>Extinction</strong> for the Natural Fall-Run ChinookSalmon Population in the Lower <strong>Merced</strong> River due to InsufficientInstream Flow ReleasesPrepared byCarl <strong>Mesick</strong>, Ph.D.Carl <strong>Mesick</strong> Consultants7981 Crystal BoulevardEl Dorado, <strong>California</strong> 95623carl_mesick319@comcast.netPrepared for<strong>California</strong> <strong>Sportfishing</strong> <strong>Protection</strong> <strong>Alliance</strong>30 November 2010ABSTRACTFall-run Chinook salmon (Oncorhynchus tshawytscha) escapement in the <strong>Merced</strong> River,which is tributary to the San Joaquin River in the Central Valley of <strong>California</strong>, hasfluctuated from 29,749 adult salmon in 1984 to 82 adult salmon in 1990. The <strong>Merced</strong>River Chinook salmon population has been augmented with hatchery fish since the<strong>Merced</strong> River Hatchery (MRH) began operating in summer 1970 and there are largenumbers of out-of-basin adult hatchery salmon that stray to the <strong>Merced</strong> River annually.The <strong>Merced</strong> River’s population of naturally produced fall-run Chinook salmon wasjudged to be at a high risk of extinction based on criteria by Lindley et al. (2007), becausefrom 1998 to 2007, the population declined at an excessive rate (> 20% annually) and themean percentage of hatchery fish in the escapement was too high (72.8%).The decline in escapement is primarily due to inadequate minimum instream flowreleases from Crocker-Huffman Dam during the spring when the daily maximum watertemperatures in the lower river exceed the EPA (2003) threshold of 59 o F forsmoltification and to a lesser extent during late October when adult salmon are migratingupstream. The importance of flow and water temperatures in the <strong>Merced</strong> River and theSan Joaquin River near Vernalis during the spring smolt migration period was apparent inanalyses with both adult recruitment and smolt CWT survival studies. It is likely thatmaintaining water temperatures below the EPA (2003) threshold of 59 o F, particularly inthe lower <strong>Merced</strong> River, is important for smoltification and is highly correlated with thenumber of smolts that leave the <strong>Merced</strong> River. Flow releases from Crocker-HuffmanDam during the spring not only help maintain suitable water temperatures in the <strong>Merced</strong>River, but also improve smolt survival in the San Joaquin Delta by increasing flows andwater temperatures in the Delta. Late October flows are important, because up to 58% ofthe adult MRH fall-run Chinook salmon with CWTs that were recovered in Central1
Valley rivers during the fall-run Chinook salmon escapement surveys from 1979 to 2007(<strong>Mesick</strong> et al. 2009a) strayed to the Sacramento River Basin when the 10-day mean flowin the San Joaquin River at Vernalis in late October was less than 3,500 cfs. Otherfactors that put the population at a high risk of extinction include unusually unfavorableocean conditions for the survival of juvenile salmon, such as occurred during spring 2005and 2006 (Lindley et al. 2009).2
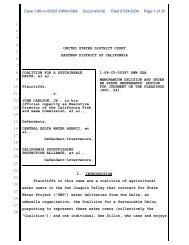
INTRODUCTIONThe escapement of fall-run Chinook salmon (Oncorhynchus tshawytscha) population inthe <strong>Merced</strong> River, which is a tributary to the San Joaquin River in the Central Valley of<strong>California</strong>, was usually less than 500 fish until minimum instream flows were establishedunder the Davis-Grunsky Act in October 1966 and the <strong>Merced</strong> River Hatchery beganoperating in summer 1970 (Fig. 1). The total escapement increased to a high of 29,749 infall 1984 following prolonged flood control releases during the spring of 1982 and 1983.However, total escapement declined to an average of about 500 fish in fall 2007, 2008,and 2009 in spite of high flows in spring 2005 and 2006, presumably as a result ofabnormally poor ocean conditions (Lindley et al. 2009).Escapement35,00030,00025,00020,00015,00010,0005,00001950 1960 1970 1980 1990 2000Year4,0003,5003,0002,5002,0001,5001,0005000Flow (cfs)EscapementFlowFig. 1. Total escapement of fall-run Chinook salmon in the <strong>Merced</strong> River and <strong>Merced</strong>River Hatchery from 1954 to 2009 and the mean streamflow in the <strong>Merced</strong> Rivernear Cressy (rivermile 27.75) from 1 February to 15 June two years prior to theescapement estimate. Escapement estimates from 1954 to 2007 were published inthe <strong>California</strong> Department of Fish and Game GrandTab file in March 2010 whichis available at www.CalFish.org.The <strong>Merced</strong> River Chinook salmon population has been augmented with hatchery fishsince the <strong>Merced</strong> River Hatchery (MRH) began operating in summer 1970. Initially, thehatchery consisted of an artificial spawning channel and off-river ponds for raisingjuvenile salmon to a yearling size. The artificial spawning channel was 4,372 feet longwith 3,830 feet of spawning gravels interspersed with 6 resting pools that were used bynaturally spawning fish. During fall 1970, 38 female salmon spawned in the channel andapproximately 59,127 juvenile salmon migrated from the channel (Menchen 1971). The3
spawning channel was used until the fall of 1980, when artificial spawning was first usedat the hatchery (Poe 1982). An off-channel rearing pond with a capacity to hold about100,000 juvenile salmon was used in summer 1971 to rear juveniles to a yearling size forfall releases in the <strong>Merced</strong> River. Three off-channel rearing ponds were operational byspring 1974, with a total capacity of about 450,000 yearlings (Chase 1978). From 1971to 1973, the fish reared in the ponds were the progeny of adult salmon that were trappedin the Stanislaus River near the Orange Blossom Bridge (Menchen 1971). Yearlingswere reared in the ponds through October 1991; whereas subyearling smolts werereleased during April through May thereafter. In 1991, the hatchery was modernized toinclude a permanent hatchery building with the capacity to incubate 3,000,000 eggs, 2nursery tanks with the capability to start feeding of approximately 100,000 swim-up sizesalmon each, 10 nursery tanks that hold up to 90,000 fingerlings each, 1,000 linear feet ofconcrete raceways consisting of ten 100 foot-long ponds, larger water supply lines, andultraviolet treatment for the water supply (Cozart 2005).To assess the viability of the <strong>Merced</strong> River fall-run Chinook salmon population, it isnecessary to determine number of hatchery reared fish in the escapement. This has notbeen previously been done, because many of the MRH fish are not marked foridentification and it is likely that unmarked fish from other Central Valley hatcheries,such as the Coleman National Fish Hatchery (CNFH) on Battle Creek, Feather RiverHatchery (FRH), Nimbus Fish Hatchery (NFH) on the American River, and theMokelumne River Fish Installation (MRFI), migrated into the <strong>Merced</strong> River to spawn.Estimates of the number of naturally produced and hatchery produced salmon in the<strong>Merced</strong> River escapements from 1980 to 2007 are provided here. The estimates ofhatchery reared fish were derived from 28 years of coded-wire-tag (CWT) studies thatprovide data on the rates that adult hatchery salmon were recovered in the <strong>Merced</strong> Riverrelative to habitat conditions that affected the survival of the juvenile fish, ocean harvestrates of the adult fish, and habitat conditions that would have affected the homing successof the adults returning to spawn.The estimates of the number of naturally produced fish in the <strong>Merced</strong> River escapementare used in this report to show that the population is at a high risk of extinction based onthe population level criteria developed by Lindley et al. (2007). Lindley et al. (2007)characterized Chinook salmon populations with a high risk of extinction (greater than 20percent chance of extinction within 20 years) as those with a total escapement that is lessthan 250 spawners in three consecutive years (mean of 83 fish per year), a precipitousdecline in escapement, a catastrophe defined as an order of magnitude decline within onegeneration occurring within the last 10 years, and a high hatchery influence. Populationswith a low risk of extinction (less than 5 percent chance of extinction in 100 years) have aminimum total escapement of 2,500 spawners in three consecutive years (mean of 833fish per year), no apparent decline in escapement, no catastrophic declines occurringwithin the last 10 years, and a low hatchery influence. Populations with a moderate riskof extinction are those at intermediate levels to the low and high risk criteria (e.g., totalescapement in three consecutive years between 250 and 2,500 spawners. The overall riskfor the population is determined by the criterion indicating the highest risk of extinction.These criteria are slight modifications of those used by Allendorf et al. (1997).4
This study further demonstrates that there is a strong relationship between the number ofnaturally produced adult salmon that return to the <strong>Merced</strong> River and the magnitude offlow and water temperature during the winter and spring that affect the survival of thejuvenile fish. Therefore, the high risk of extinction for the naturally produced populationin the <strong>Merced</strong> River is primarily due to the combined effects of inadequate flow releasesin the <strong>Merced</strong> River and periodically poor ocean conditions, such as occurred in spring2005 and 2006 (Lindley et al. 2009), that negatively affect the survival of juvenilesalmon.METHODSThe methods used to estimate the number of adult salmon with CWTs recovered in the<strong>Merced</strong> River are described in <strong>Mesick</strong> et al. (2009a). Assessing trends in the escapementof naturally produced fish requires estimates of recruitment, which is defined as thenumber of salmon in the same cohort (same age) that survive to Age 2. The methodsused estimate the number of naturally produced adult recruits in the <strong>Merced</strong> Riverpopulation are described in <strong>Mesick</strong> et al. (2009b). Described below are the methods usedto estimate the number of untagged hatchery produced Chinook salmon releases thatreturned to the lower <strong>Merced</strong> River in the adult escapement.Untagged Hatchery Salmon EstimatesThe estimated numbers of unmarked hatchery fish that returned to the <strong>Merced</strong> River asadult salmon from 1980 to 2007 are based on the assumption that the unmarked hatcheryfish would have returned to the <strong>Merced</strong> River at the same rates that the marked hatcheryfish returned to the <strong>Merced</strong> River if they were released in the same general location undersimilar habitat conditions. The number of unmarked fish released was obtained from theCDFG annual reports for the FRH, NFH, MRFI, and MRH and from the Regional MarkInformation System for the CNFH. Some of the MRH release data was obtained fromplanting release records.If there were a sufficient number of CWT releases of hatchery reared juvenile salmonover a range of habitat conditions, separate logistic models were developed for the CWTrecovery rate in the <strong>Merced</strong> River and important habitat conditions for Age 2, Age 3, andAge 4 salmon. The coefficients for the habitat variables and the model’s constant werethen used to compute the logit value of the estimated CWT return rate, whichcorresponded to the number of adults that migrated to the <strong>Merced</strong> River divided by thenumber of juveniles released. The logit value was converted into a return rate using thestandard formula:Probability of Return = 1.0 / (1.0 + EXP (-LOGIT))5
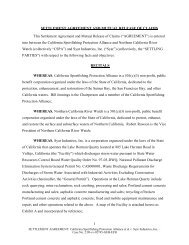
Separate models were developed for hatchery releases of juvenile salmon from the MRH,MRFI, and the Sacramento Basin hatcheries because the tendency to migrate to the<strong>Merced</strong> River differed between them. Based on the CWT recoveries, the MRH releasesreturn to the <strong>Merced</strong> River at the highest rates because these fish would naturally home tothe <strong>Merced</strong> River (<strong>Mesick</strong> et al 2009a). The MRFI releases return to the <strong>Merced</strong> River atmoderate rates because the Mokelumne and <strong>Merced</strong> rivers are both tributaries to the SanJoaquin River so the MRFI fish would home to the Mokelumne River with a tendency tostray to other San Joaquin tributaries, particularly the <strong>Merced</strong> River (<strong>Mesick</strong> et al.2009a). The Sacramento Basin hatchery releases return to the <strong>Merced</strong> River at the lowestrates, because most would home to the Sacramento River (<strong>Mesick</strong> et al. 2009a).Separate models were also developed for different release locations because the fartherdownstream the juvenile fish are trucked from the hatchery, the greater the likelihood thatthe adults would stray to a non-natal river. Almost all of the recoveries of adult CWTsalmon from the Sacramento Basin hatcheries, which include the Coleman National FishHatchery (CNFH), Nimbus Fish Hatchery (NFH), and the Feather River Hatchery (FRH),were from juvenile releases in the West Delta. I define the West Delta where the flowfrom the Sacramento and San Joaquin rivers mix. This includes the release sites nearCollinsville on the Sacramento River and Jersey Point on the San Joaquin River and allothers in the Bay to the west. The MRFI releases were segregated into Tributary,Mainstem, East Delta, and West Delta regions. Tributary releases were upstream of theconfluence with the Delta Cross Channel. The East Delta releases were made in theMokelumne River between the confluence with the Delta Cross Channel and the mouthof the Mokelumne River, which includes releases at New Hope Landing. The Mainstemreleases were made in the Sacramento River near Rio Vista and West Sacramento. TheMRH releases were segregated into 3 regions: (1) tributary which includes releasesthroughout the <strong>Merced</strong> River; (2) mainstem San Joaquin River releases upstream fromJersey Point; and (3) West Delta releases that included Jersey Point.The initial steps of the analysis were to make two comparisons: (1) compare variousindices of ocean conditions to identify the best one that reflects the survival of juvenilesalmon as they entered the ocean at the Gulf of Farallones; and 2) determine whether themonth of juvenile release affected adult recovery rates. First, logistic models were usedto evaluate different indices of ocean conditions on an index of survival. An index ofsurvival, which was the rate that each CWT release group was recovered in all CentralValley rivers combined as well as the sport and commercial ocean harvest, was used tofocus the evaluation on juvenile survival by eliminating the effect of straying and oceanharvest. The survival indices included the CWT data on West Delta releases for theCNFH, FRH, NFH, and MRFI hatcheries that were primarily made at Benicia, WicklandOil Net Pens, Crockett, and Port Chicago. The logistic models were computed for thesurvival indices separated by the month of release for April through November. Theresults indicated that the Coastal Upwelling Index (CUI) that corresponds to the Gulf ofFarallones (37.5 o N, 123.5 o W) for the month of April was most highly correlated withthe West Delta survival indices for CWT releases made in April through August (Fig. 2)than were CUI estimates for the months of May through August. The CUI for the monthof April was also more highly correlated with the West Delta survival indices than were6
spring (mean for March, April, and May) estimates of curl and sea surface temperatures(Wells et al. 2007) as well as estimates of production of zooplankton, shortbelly rockfish(Sebastes jordani), and a top Predator, the common murre (Uria aalge, Wells et al.2008). Therefore, the April CUI index was used as the sole index of ocean conditions forthe spring and summer releases of hatchery fish. The CUI database is developed anddistributed by the Pacific Fisheries Environmental Laboratory, National Marine FisheriesService’s Southwest Fisheries Science Center, Pacific Grove, <strong>California</strong>.Fig. 2. Survival rates for each coded-wire-tag code of juvenile Central Valley hatcheryfall-run Chinook salmon released in the West Delta from April through Augustfrom 1980 to 2004 relative to the mean coastal upwelling index for Aprilcorresponding to the Gulf of Farallones. Survival rates were computed as thenumber of adults recovered during inland escapement surveys and in the oceanfisheries divided by the total number of juveniles released. The line represents alinear regression generated by Excel 2010. A linear regression was the best fit tothe observed estimates compared to logistic or polynomial regressions.A similar analysis was conducted for West Delta releases made in September, October,and November. The results indicated that the November CUI was more highly correlatedwith the West Delta survival indices than were CUI indices for all the months betweenthe April prior to the CWT release and the February following the CWT release.Therefore, the November CUI index was used as the sole index of ocean conditions forthe fall releases of hatchery fish.To determine whether the month when juvenile releases were made affected adultrecovery rates (i.e., juvenile survival rates), a conditional variable was added to the WestDelta release dataset that identified the month of release and comparisons were madeusing Analysis of Covariance that included the April CUI index as a covariable. A TukeyHSD all-pairwise comparison test indicated that there were no significant differences inthe survival index between releases made in April, May, June, and August. The mean7
survival indices for May, June, and August ranged between 0.023 and 0.027; whereas, themean of the survival index for April was 0.017. Although, the survival index for releasesmade in July was significantly higher (P < 0.05, mean 0.036) than the other spring andsummer months based on the comparison test, most of the July releases were madeduring a few years when the April CUI was unusually high. Therefore, it was assumedthat the effect of different release dates could be accounted for in the logistic model byincluding a variable of the mean weight of the juvenile salmon for the West Deltareleases or a variable on maximum water temperature for the tributary and mainstemreleases. The mean weights for the West Delta Sacramento Basin releases were 6.5 g, 9.7g, and 14.8 g, for the months of April, May-June-Aug, and July, respectively, and it islikely that the high survival rates for July were a function of the large size of the fishreleased.Inland Habitat Variables and Smolt Migration RatesThe CWT recovery rate models were developed by using step-wise procedures with avariety of habitat and biological variables including streamflow, maximum daily watertemperature, Delta export rates, adult harvest rates in the ocean, rates that MRH adultsstrayed to the Sacramento River Basin, the April or November CUI index, the meanweight of the juveniles at the time of their release, and the total number of juvenilesreleased in each CWT group (Table 1).The time periods used to estimate the mean estimates for the habitat variables describedin Table 1 were based on the mean number of days for CWT juvenile salmon released inthe upper <strong>Merced</strong> River between the <strong>Merced</strong> River Hatchery and Shaffer Bridge andrecovered at the Hagaman rotary screw trap near the mouth of the <strong>Merced</strong> River (RM13), the Mossdale trawl, Chipps Island trawl, and National Marine Fisheries Servicetrawls in the Bay and ocean. Generally, the average migration rates were slowest in theriver and during high flow releases in the <strong>Merced</strong> River, when water temperatures werelow from 1994 to 2006:<strong>Merced</strong> River Flows Hagaman Park Mossdale Chipps Island2,000 cfs 7.4 days 20.4 days 24.0 daysMiles Traveled 50.6 114.4 170.1The average migration rate for MRH juveniles released near the mouth of the <strong>Merced</strong>River, which was typically at Hatfield Park (RM 1.3), was 6.8 days and 5.9 days when<strong>Merced</strong> River flows were below and above 2,000 cfs, respectively. Trawling by theNational Marine Fisheries Service (MacFarlane and Norton 2002) recaptured 3 MRH fishthat were released at Hatfield State Park, Dos Reis Park, and Mossdale and thenrecovered in the trawl between Carquinez Strait and the Gulf of Farallones after anaverage of 17 days (12 to 28 days) from the date of release in spring 1997. One MRFICWT juvenile released at Woodbridge Dam in the Mokelumne River was recaptured atthe Golden Gate Bridge after 11 days from the date of release in 1997 (MacFarlane andNorton 2002). These results suggest that although the entire group of fish slowly8
migrated downstream in the <strong>Merced</strong> River, those that survived were migrating at a fasterrate compared to those that died.To simplify the analysis, it was assumed that the migration rates observed when <strong>Merced</strong>River flows were less than 2,000 cfs would accurately reflect the habitat conditions thataffected the survival of all CWT release groups regardless of flow level. This assumptionis reasonable because habitat conditions would be relatively stable during wet year floodcontrol releases and so the precise time period would be less important for computing themean habitat conditions during high flows. For example, daily water temperatures do notvary as much at high flows as they do at low flows.The time periods for the habitat variables (Table 1) were intended to track the majority ofthe release group as they migrated downstream to the ocean. For example, it wasassumed that the survival of a group of fish released at the MRH would be primarilyaffected by the mean habitat conditions (e.g., maximum daily water temperature) near themouth of the <strong>Merced</strong> River from day 3 to day 6 after their release. Then it was assumedthat they would be affected by the mean conditions in the San Joaquin River nearVernalis, including water temperature, flow, installation of the Head of the Old RiverBarrier, and export rates, from day 6 to day 15 after their release. Finally, they would beaffected by the mean conditions in the Bay west of Chipps Island from day 13 to day 19after their release.Age Specific Model DevelopmentIt was assumed that the Age 3 CWT recovery models were more accurate than the Age 2or Age 4 models, particularly for the recovery rates of CWT Sacramento Basin hatcheryfish in the <strong>Merced</strong> River, because Age 3 fish return to spawn in the highest numbers andtherefore there is a higher likelihood that rare CWTs would be recovered as Age 3 fish.Furthermore, it was assumed that the factors that affected the juvenile stage would havethe same effect on the recovery rates of Age 2, Age 3, and Age 4 fish, because they allbelong to the same cohort. Therefore, the Age 3 models were developed first and thenthe coefficient of the most highly correlated juvenile habitat variable in the Age 3 modelwas inserted into the Age 2 and Age 4 models. This was done in the Statistix program byusing an “Offset Variable” that subtracted the coefficient of the most highly correlatedjuvenile habitat variable from the linear predictor (Analytical software 2008).9
RESULTSThe results are presented in two sections. The first presents the logistic models of CWTrecovery rates and the estimated number of hatchery salmon in the <strong>Merced</strong> Riverescapement. The second pertains to the risk of extinction analysis.CWT Recovery Rates and Hatchery Salmon in the <strong>Merced</strong> River EscapementThe coefficients of the logistic regression models used to estimate the CWT recoveryrates are presented in Tables 2a-e. The models were moderately predictive of the meanCWT recovery rates for most years when a substantial amount of CWT recovery datawere available (Appendix 1). However, the models were not predictive of the observedrecovery rates during some years, presumably when the indices used to represent oceanconditions (April and November CUI) did not accurately reflect low rates of survival ofjuvenile salmon. For example, none of the indices of ocean conditions tested herepredicted the unusually low survival rate of 0.08% for the hatchery juveniles released inthe West Delta in spring 2005. Survival rates were based on the total CWT recoveries inthe ocean fisheries and inland escapements and so only ocean conditions (i.e, not adultharvest or straying) should have affected the survival of West Delta releases.When the models were used to predict the recoveries of untagged salmon for all years inthe preliminary analyses, the total estimated hatchery escapement of tagged and untaggedfish exceeded the total observed escapement of naturally produced and hatchery fish insome years. A comparison of the observed to the estimated recovery rates based on thepreliminary models indicated that the preliminary models were overestimating the CWTrecovery rates during the same years when total estimated hatchery escapementsexceeded the total observed escapement estimates. Therefore, the unusually lowobserved recovery rates (i.e., model outliers) are probably accurate whereas thepreliminary models probably did not include all the habitat variables needed to predictthe unusually low recovery rates. Some of the missing habitat variables in the model mayinclude factors such as whether the tagged fish were impaired by disease or highpredation rates at the site of release. Many factors, such as disease and predation, that arenot routinely monitored cannot be empirically modeled.To develop the final models used to estimate the total number of untagged hatchery fishin the escapement, the unusually low CWT recovery rates were not used in modeldevelopment. Instead, the models were used for years when the model was fairlypredictive compared to the observed data, whereas when CWT recovery rates wereunusually low compared to the model prediction, the mean annual CWT recovery ratewas used to expand the untagged releases made in the same year (Tables 2a-e). It isassumed that this method overcame the weakness of the final model caused by missinghabitat variables, such as disease or predation at the specific release site.10
CWT recovery rate models were also not used when there were too few data for some ofthe release groups. For example, MRH CWT yearling releases during the fall in the SanJoaquin River near Mossdale were made only during 5 years (brood years 1980 to 1984)and there was insufficient variation in the habitat variables to construct a meaningfulmodel with those data. So whenever there were too few recovery data to develop amodel, the mean annual CWT recovery rate was used to expand the untagged releasesmade in the same year, and it was assumed that no fish were recovered in the <strong>Merced</strong>River during years when there were no observed data.None of the logistic regression models of CWT recovery rates, which were based onindividual CWT code releases, were statistically significant. The coefficients for thevariables used (Tables 2a-e) had probabilities of at least 0.74 and typically greater than0.90. A partial explanation is that there was a high level of variability in recovery ratesamong replicate CWT releases. For example on 26 April 2001, three replicate CWTgroups (codes 064419-21) of about 25,000 fish each were released at the Hatfield StatePark and the fish in each group were similarly sized (average of 6.9 grams per fish).Although these 3 CWT groups were exact replicates, the recovery rate of the Age 3 adultsin the <strong>Merced</strong> River escapement ranged between 0.0237% and 0.237% (10-folddifference) between the three different CWT groups. A high level of variance amongCWT replicate groups primarily reflects the problem that recovering individual CWTs inthe escapement is like looking for a needle in a haystack. The total number of CWTs inthe escapement is low because very few juvenile fish are tagged and mortality rates to theadult stage are high. In addition, only a portion of the adult carcasses in the escapementare examined for tags and so the potential for sampling error is high. On the other hand,the effect of this sampling error is reduced by the models, which reflect the average of allthe observed recovery rates. The plots of the mean observed values versus the predictedvalues shown in Appendix 1 suggest that the models are moderately predictive.The estimated numbers of naturally produced, tagged hatchery salmon with CWTs, anduntagged hatchery salmon in the <strong>Merced</strong> River escapement from 1980 to 2007 aresummarized in Table 3 and presented by untagged release group in Appendix 2. Theestimates of untagged hatchery salmon are probably conservative because no estimateswere made for some release groups in years that lacked observed data. For example,MRH yearling releases in the <strong>Merced</strong> River in fall 1987, 1988, 1989, and 1991 wereassumed to produce no returns to the <strong>Merced</strong> River due to a lack of CWT recovery data.Risk Of <strong>Extinction</strong> AnalysisThe <strong>Merced</strong> River fall-run Chinook salmon population would be considered to be at ahigh risk of extinction based on the criteria by Lindley et al. (2007) because there was ahigh percentage of hatchery fish in the escapement from 1998 to 2007 and there was aprecipitous decline in escapement from 1998 to 2008. The overall risk for the populationis determined by the criterion indicating the highest risk of extinction (Lindley, FisheryBiologist, National Marine Fisheries Service, personal communication) and the highpercentage of hatchery strays from the MRFI, FRH, and NFH and the precipitous declinein escapement both indicate that the population is at a high risk of extinction.11
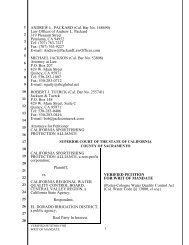
Based on the other risk of extinction criteria (Lindley et al. 2007), the population wouldbe considered to be at a moderate risk of extinction from 1981 to 2007: (1) the minimumpopulation size was at least 250 adults over a three year period; and (2) there was nocatastrophic decline in escapement over a generation. My analyses are based onestimates of the number of naturally produced and hatchery produced adult fall-runChinook salmon that have returned to the <strong>Merced</strong> River between 1981 and 2007 (Table3).Effective Population SizeThe effective population size criteria relates to the loss of genetic diversity (Lindley et al.2007). The effective population consists of individuals that are reproductivelysuccessful, including grilse (Allendorf et al. 1997). In Chinook salmon populations, notall individuals are reproductively successful and the mean ratio of the effectivepopulation size to total escapement over a three year period (N e /N) has been estimated tobe 0.20 based on spawner-recruit evaluations of over 100 salmon populations from<strong>California</strong> to British Columbia (Waples et al. 2004 as cited in Lindley et al. 2007). A fewexamples of why adult salmon may not reproduce successfully in the <strong>Merced</strong> Riverinclude: (1) redd superimposition that destroys eggs; (2) spawning in habitats withexcessive levels of fines; and (3) low survival rates for juveniles that migrate late whenhigh water temperatures in the lower <strong>Merced</strong> River are unsuitable for survival. Thereforebased on effective population size (Ne), the <strong>Merced</strong> River could be considered to be athigh risk if annual escapement (N) drops below a mean of 83 fish for three consecutiveyears and at low risk if escapement remains above a mean of 833 fish for threeconsecutive years.The escapement estimates of naturally produced fish over a three year period dropped tolows of 284 adults from 1989 to 1991, 1,254 adults from 2003 to 2005, and 1,309 adultsfrom 2005 to 2007 (Table 3). Population levels of 284 to 1,309 adults over three yearsare categorized as a moderate risk of extinction based on the Lindley et al. (2007)criterion. However, the method used to estimate the number of untagged hatchery fish inthe escapement was very conservative and it is highly likely that the true numbers ofnaturally produced fish are lower than those presented in Table 3. Although it is possibleto obtain relatively accurate estimates of the number of hatchery reared salmon in theescapement using microchemical analyses of otoliths (Barnett-Johnson et al. 2007),specific analyses have not been done for the <strong>Merced</strong> River. Therefore, until these studieshave been conducted, it would be prudent to consider that the <strong>Merced</strong> River escapementsof naturally produced fish have at least approached the Lindley et al. (2007) definition ofa high risk of extinction since 1989.Population DeclineAnother serious threat to the viability of natural salmonid populations identified byLindley et al. (2007) is a precipitous decline in escapement. Lindley et al. (2007) definea precipitous decline as a decline within the last two generations (6 years) to an annual12
un size of 500 spawners or fewer or a run size greater than 500 spawners but declining ata rate of at least 10% per year. Lindley et al. (2007) recommend that the populationdecline rate should be computed as the slope of the natural log of the escapement versustime multiplied by 100 over a ten year period.The escapement of natural spawners in the Tuolumne River meets both of these criteria.First, the natural escapement declined to fewer than 500 spawners in fall 2003, 2005, and2007 (Table 3). Second, the population declined at an average rate of 23.7% per yearfrom 1998 to 2007 (Fig. 4).Fig. 4. The natural log (Ln) of the natural escapement of fall-run Chinook salmon in the<strong>Merced</strong> River from 1999 to 2008. The slope of the regression indicates that thepopulation decline was 23.7% per year.CatastropheCatastrophes are defined by Lindley et al. (2007) as instantaneous declines in populationsize due to events that occur randomly in time that reflect a sudden shift from a low riskstate to a higher one. They view catastrophes as singular events with an identifiablecause and only negative immediate consequences, as opposed to normal environmentalvariation which can produce very good as well as very bad conditions. Some examples ofcatastrophes include disease outbreaks, toxic spills, or volcanic eruptions. A high risksituation is created by an order of magnitude (90%) decline in population size over onegeneration.The <strong>Merced</strong> River natural escapement declined by about 82% when the 1999-2001generation declined from a total of 7,732 fish to a total 1,392 fish for the 2002-2004generation. The likely cause of this decline is the extended drought conditions and lowinstream flow releases in the <strong>Merced</strong> River from 2001 to 2004, which probably resulted13
in high juvenile mortality rates (see section below titled “Juvenile Survival in the <strong>Merced</strong>River”).Hatchery InfluenceThe estimated percentages of hatchery fish in the <strong>Merced</strong> River escapement exceed theLindley et al. (2007) high risk criterion of less than 10% (3 generations) to 15% (1 to 2generations) hatchery fish. Since 1998, the mean percentage of hatchery fish in the<strong>Merced</strong> River escapement is estimated to be 72.8% (range 34.1% to 98.4%, Table 3). Itis likely that the mean percentage of hatchery fish in the <strong>Merced</strong> River escapement isactually higher than 72.8%, because the methods used to estimate the number ofuntagged hatchery salmon in the escapement were conservative.Environmental Factors That Affect Salmon RecruitmentThe production of <strong>Merced</strong> River salmon is primarily determined by the instream flowreleases from Crocker-Huffman Dam as they affect juvenile survival in the <strong>Merced</strong>River and provide attraction flows for migrating adult salmon to navigate back to the<strong>Merced</strong> River. The salmon population is also affected by conditions that affect salmonsurvival in the San Joaquin Delta and the ocean, although these effects are relativelysmall or infrequent compared to the importance of instream flow releases. The followingdescribes the factors that affect salmon escapement and/or recruitment relative to adultupstream migration, spawner abundance, spawning habitat and fry production, juvenilesurvival in the <strong>Merced</strong> River, Delta, and ocean, and the harvest of adult salmon in theocean.Adult Upstream MigrationUp to 58% of the adult MRH fall-run Chinook salmon with CWTs that were recovered inCentral Valley rivers during the fall-run Chinook salmon escapement surveys from 1979to 2007 (<strong>Mesick</strong> et al. 2009a) strayed to the Sacramento River Basin when San JoaquinRiver flows were low or Delta exports at the State and Federal pumping facilities werehigh during the October and November migratory period. From 1996 to 2006, the meanstray rate was 13.9% (range 0% in 2006 to 42.5% in 1999). The relationships betweenthe MRH stray rates and the 10-day mean flow in the San Joaquin River at Vernalis inlate October (Fig. 5), the mean October and November Vernalis flows (Fig. 6), and themean ratio of Delta Exports to Vernalis flows for October and November (Fig. 7) arenearly identical. Adult salmon home to their natal streams in part by following olfactorycues from their natal stream (Quinn 2005) and presumably a minimum flow from each ofthe three San Joaquin River tributaries, including the <strong>Merced</strong> River, must pass throughthe Delta for the salmon to home successfully. Therefore, it should be possible tominimize the percentage of adult San Joaquin Basin salmon that stray to the SacramentoRiver Basin using a combination of flow and export management. An efficient use ofwater would be to provide a 10-day pulse flow in late October of 3,600 cfs at Vernalis,when high water temperatures might delay migrating salmon, and then rely on a14
combination of base flows and Delta export restrictions throughout the remainder of themigratory period to provide suitable conditions for spawning and egg incubation in thetributaries as well as minimum flows through the Delta for homing cues. For example, a10-day pulse of 1,200 cfs from each of the Stanislaus, Tuolumne, and <strong>Merced</strong> rivers inlate October, October and November base flows of at least 275 cfs for each tributary forspawning and egg incubation, and a maximum Delta export rate of 250% of Vernalisflows during October and November should keep stray rates at or below 6% based on therelationships shown in Figures 5 and 7. If these actions are successful, San Joaquin RiverBasin stray rates should decrease from the mean of 13.9% for the 1996 to 2006 period toa mean of about 4.8% (maximum of 6% per year).Fig. 5. Adult <strong>Merced</strong> River Hatchery Chinook salmon stray rates relative to themagnitude of 10-day pulse flows as measured in the San Joaquin River atVernalis (Dayflow estimates) during late October. Stray rates are computed asthe percentage of <strong>Merced</strong> River Hatchery fall-run Chinook salmon with CWTs(<strong>Mesick</strong> et al. 2009a) that were released in the San Joaquin River Basin upstreamfrom Jersey Point as juveniles and then recovered as adults in the SacramentoRiver Basin relative to the adult recoveries in the Central Valley from 1983 to1988 and from 1995 to 2003. Estimates for 1989 to 1994 were not used becausethere were less than an estimated total of 1,000 MRH adults with CWTs thatreturned to all Central Valley rivers during each year and so there was a highdegree of uncertainty for these stray rate estimates. The mean Vernalis flows(USGS gauge 11303500) were computed for the 10-day period in mid to lateOctober with the highest flows.15
Fig. 6. Adult <strong>Merced</strong> River Hatchery Chinook salmon stray rates relative to the meanflow in the San Joaquin River at Vernalis (Dayflow estimates) during October andNovember. Stray rates are computed as the percentage of <strong>Merced</strong> River Hatcheryfall-run Chinook salmon with CWTs (<strong>Mesick</strong> et al. 2009a) that were released inthe San Joaquin River Basin upstream from Jersey Point as juveniles and thenrecovered as adults in the Sacramento River Basin relative to the adult recoveriesin the Central Valley from 1983 to 1988 and from 1995 to 2003. Estimates for1989 to 1994 were not used because there were less than an estimated total of1,000 MRH adults with CWTs that returned to all Central Valley rivers duringeach year and so there was a high degree of uncertainty for these stray rateestimates. The mean Vernalis flows (USGS gauge 11303500) were computed forthe 10-day period in mid to late October with the highest flows.16
Fig. 7. Adult <strong>Merced</strong> River Hatchery Chinook salmon stray rates relative to the meanratio of Delta Exports at the State, Federal, and Contra Costa pumping facilities(Dayflow estimates) to the flow in the San Joaquin River at Vernalis (Dayflowestimates) during October and November. Stray rates are computed as thepercentage of <strong>Merced</strong> River Hatchery fall-run Chinook salmon with CWTs(<strong>Mesick</strong> et al. 2009a) that were released in the San Joaquin River Basin upstreamfrom Jersey Point as juveniles and then recovered as adults in the SacramentoRiver Basin relative to the adult recoveries in the Central Valley from 1983 to1988 and from 1995 to 2003. Estimates for 1989 to 1994 were not used becausethere were less than an estimated total of 1,000 MRH adults with CWTs thatreturned to all Central Valley rivers during each year and so there was a highdegree of uncertainty for these stray rate estimates. The mean Vernalis flows(USGS gauge 11303500) were computed for the 10-day period in mid to lateOctober with the highest flows.Spawner AbundanceSpawner abundance can affect juvenile salmon production in two ways. First, too fewspawners results in low production of juveniles due to a lack of eggs. On the other hand,the limited availability of spawning habitat in the <strong>Merced</strong> River could result in high ratesof redd superimposition when spawner abundance is high. Redd superimposition couldresult in egg mortality for early spawners when late spawners dig up the redds of theearly spawners.The <strong>Merced</strong> River spawner-recruit analysis suggests that recruitment increases asspawner abundance increases; however, the relationship appears to be driven primarily by17
the data associated with high flows and the relationship with spawner abundance is notstatistically significant (Fig. 8). Spawner abundance has no affect on recruitment duringdry and normal water year types, which are the majority of observations, as evidenced bya nearly flat relationship from about 500 spawners to 10,500 spawners for the low andmedium flow estimates (Fig. 9). This suggests that during dry and normal water yeartypes when only the minimum required flows are released (mean March 20 to April 20flows < 1,262 cfs), the capacity of the juvenile habitat is so constrained that a smallnumber of spawners can saturate the habitat with juvenile salmon.Fig. 8. The observed and modeled relationships between the number of natural recruitsand the number of Age 3 equivalent spawners in the <strong>Merced</strong> River. The model isa 2 nd order polynomial regression for adult <strong>Merced</strong> River recruitment thatincludes the mean flow at the river’s mouth from March 20 to April 20, thenumber of Age 3 equivalent spawner, which includes both hatchery and naturaladults, and a 1 st order interaction term for flow and spawner abundance. Theplotted model line in the figure represents the stock-recruitment relationship at anaverage flow of 900 cfs at the mouth of the <strong>Merced</strong> River. The model wassignificant (P = 0.00), the adjusted R 2 was 0.74, and the probabilities for thespawner variables were 0.09 and 0.97 for the first and second order terms,respectively. The high flow data occurred when the mean March 20 to April 20flow was at least 2,500 cfs. The low flow data occurred when the mean March 20to April 20 flow was less than 275 cfs. The methods used to estimate naturalrecruitment and Age 3 spawner abundance are described in (<strong>Mesick</strong> et al. 2009b).18
Fig. 9. The number of natural recruits relative to the number of Age 3 equivalentspawners in the <strong>Merced</strong> River at low and medium flows at the <strong>Merced</strong> River’smouth from March 20 to April 20. The medium flow data occurred when themean March 20 to April 20 flow ranged between 618 and 1,272 cfs. The lowflow data occurred when the mean March 20 to April 20 flow was less than 325cfs. The line represents the linear regression for the low flow data. The methodsused to estimate natural recruitment and Age 3 spawner abundance are describedin (<strong>Mesick</strong> et al. 2009b).Juvenile Survival in the <strong>Merced</strong> RiverThe survival of juvenile fall-run Chinook salmon that migrate from the <strong>Merced</strong> River intothe San Joaquin River and Delta is thought to be relatively low for fry that must rear for aprolonged period before completing their migration to the ocean compared to therelatively high survival rates for smolt-sized juveniles. The mean recovery rates in theescapement for Coleman National Fish Hatchery (CNFH) fall-run Chinook salmon withCWTs that were released in the Sacramento River range between 0.29% to 0.45% forreleases in January through April whereas the mean recovery rate is 1.98% for Mayreleases, when the size of the CNFH juveniles is comparable to the size of the TuolumneRiver smolts (methods described in <strong>Mesick</strong> et al. 2009a). The survival of fry sizedjuveniles is low during dry and normal water years in the Central Delta, where the<strong>Merced</strong> River smolts migrate, compared to the North Delta based on ocean recovery ratesof CNFH fry with CWTs (Brandes and McLain 2001). The low survival rates ofjuveniles rearing in the Delta in dry and normal water years may be caused by acombination of factors such as predation, entrainment at numerous small, unscreened19
diversions, unsuitable water quality, high water temperatures, disease, and directmortality at the state and federal pumping facilities in the Delta.The <strong>Merced</strong> River recruitment of naturally produced adult salmon is strongly correlatedwith spring flows and water temperatures during the early spring when parr and smoltsare migrating from the <strong>Merced</strong> River. The R 2 values are highest for relationshipsbetween recruitment and the mean Vernalis flow during April (Fig. 10), followed by themean flow at the mouth of the <strong>Merced</strong> river from March 20 to April 20 (Fig. 11), and themean daily maximum water temperature from March 20 to April 20 (Fig. 12). Therelationship with maximum water temperatures indicates that juvenile survival declinesrapidly as water temperatures approach about 59 o F. This 59 o F threshold corresponds tothe upper water temperature threshold for the smoltification process that has beenrecommended by the EPA (2003). Smoltification is a reversible process such that whenconditions are not suitable for smoltification (e.g., water temperatures exceed 59 o F), thejuveniles can revert to a freshwater or parr stage (Hoar 1988 as summarized in Myrickand Cech 2001). The strong relationship between recruitment and water temperaturesduring March and April suggest that when maximum daily temperatures exceed 59 o F,smoltification ceases and mortality rates are high for the juveniles that do not smoltduring the early spring.The number of <strong>Merced</strong> River natural recruitments was strongly correlated with thenumber of days when the maximum water temperatures at the river’s mouth were lessthan 59 o F (Fig. 13). An increase in recruitment was not observed until the duration withlow temperatures reached at least 23 days (1980); whereas recruitment was highest forthe spring 1983 cohort when there were 55 days of maximum temperatures below 59 o F(Fig. 13). Exceptions occurred for 1995, when there 54 days of low temperatures (Fig.14), and 2005, when there were 47 days of low temperatures. In 2005, ocean conditionswere unusually poor for juvenile survival (Lindley et al. 2009). The reason for the lowrecruitment for the spring 1995 cohort is unknown, although it is likely that poor oceanconditions also caused the low recruitment for the 1995 cohort. The April CUI in 1995was 91, which indicates that conditions were worse for juvenile survival in the ocean thanoccurred in 2005, when the April CUI was 121. However, the April CUI does notconsistently indicate when ocean conditions were poor for the survival of juvenile salmon(Fig. 14).20
Fig. 10. The number of natural adult recruits relative to the average flow in the SanJoaquin River at Vernalis during April from when the cohorts migrated asjuveniles toward the ocean from 1980 to 2004. The 2 nd order polynomialregression (line) and R 2 value were generated with Excel 2010.Fig. 11. The number of natural adult recruits relative to the average flow at the <strong>Merced</strong>River mouth from March 20 to April 20 when the cohorts migrated as juvenilestoward the ocean from 1980 to 2004. The 2 nd order polynomial regression (line)and R 2 value were generated with Excel 2010.21
Fig. 12. The number of natural adult recruits relative to the average daily maximumwater temperature at the <strong>Merced</strong> River mouth from March 20 to April 20 whenthe cohorts migrated as juveniles toward the ocean from 1980 to 2004. The 4 ndorder polynomial regression (line) and R 2 value were generated with Excel2010.Fig. 13. The number of natural adult recruits relative to the number of days that themaximum water temperature at the <strong>Merced</strong> River mouth was less than 59 o Ffrom March 20 to June 15 when the cohorts migrated as juveniles toward theocean from 1980 to 2004. The 2 nd order polynomial regression (line) and R 2value were generated with Excel 2010.22
Juvenile Survival In The DeltaCWT smolt survival studies have been conducted in the San Joaquin River to evaluate theeffects of flow, Delta export rates, and the installation of a barrier at the head of the OldRiver which had the objective of minimizing the diversion of flow and juvenile salmoninto the Old River, which led to the Federal and State pumping facilities in the Delta,from 1985 to 2004 (SJGRA 2007, Newman 2008). The results indicated that smoltsurvival was positively correlated with the flow in the San Joaquin River at Dos Reis andthe installation of the Old River Barrier (Newman 2008). However, associations betweenthe pumping rates at the State and Federal facilities and smolt survival were weak tonegligible (Newman 2008). Therefore, flow releases in the <strong>Merced</strong> River improve smoltsurvival in the Delta as well as in the <strong>Merced</strong> River.Juvenile Survival In The OceanThe survival of Central Valley smolts entering the ocean during May and June(MacFarlane and Norton 2002) is probably the most critical phase for salmon in theocean (Pearcy 1992, Mantua et al. 1997, Quinn 2005). Smolt survival in the ocean ishighly correlated with food availability as affected by freshwater outflow from theestuary and coastal upwelling (Casillas 2007). The coastal areas provide abundant foodresources for salmon smolts particularly when coastal upwelling provides cold, nutrientrich water and when high freshwater flows create a large interface area betweenfreshwater and saltwater (Casillas 2007). Long-term records indicate that there are 15- to25-year cycles of warm and cool periods that strongly correlate with marine ecosystemproductivity (Mantua et al. 1997; Hollowed et al. 2001). However, more recent cycleshave been relatively short with a cool productive cycle from July 1998 to July 2002, awarm unproductive cycle from August 2002 to July 2006, followed by cool productivecycle through at least July 2009 (Ocean Ecosystem Indicators 2008, web site provided bythe Northwest Fisheries Science Center, NOAA Fisheries Service). Ocean productivitywas particularly poor for the Gulf of the Farallones in 2005 and 2006 as indicated by theabandonment of nests on the Farallon Islands by Cassin’s auklets, which have a similardiet compared to juvenile Chinook salmon, because of poor food availability (Sydeman etal. 2006; Wolf et al. 2009). The Pacific Decadal Oscillation is a basin-scale index ofNorth Pacific sea surface temperatures and provides a good index of sea surfacetemperatures and has been correlated with Chinook salmon landings in <strong>California</strong>(Mantua et al. 1997).An important local process that affects plankton production along the Oregon coast iscoastal upwelling (Peterson et al. 2006). Upwelling is caused by northerly winds fromApril to September that transport offshore surface water southward and away from thecoastline. This offshore, southward transport of surface waters is balanced by onshorenorthward transport of typically cool, high-salinity, nutrient-rich water that drives themarine food-web. The Coastal Upwelling Index (CUI) is based on the wind speed thatdrives coastal upwelling (Bakun 1973) and the CUI database is developed and distributedby the Pacific Fisheries Environmental Laboratory, National Marine Fisheries Service’sSouthwest Fisheries Science Center, Pacific Grove, <strong>California</strong>. The survival of juvenilecoho salmon (O. kisutch) is positively correlated with the April and mean April-May CUI23
values for Oregon coho salmon (Petersen et al. 2006), the mean June to August curldrivenupwelling indices are positively correlated with growth rates of Chinook salmon ina tributary to the Smith River near the <strong>California</strong>-Oregon border (Wells et al. 2007), andthe mean April CUI are positively correlated with the survival to adulthood of CentralValley hatchery salmon released in the San Francisco Bay based on the result presentedin the Methods section here. However, strong upwelling is not always correlated withhigh plankton productivity because the deep source waters for upwelling can be warmand nutrient poor (Peterson et al. 2006).<strong>Merced</strong> River fall-run Chinook salmon adult recruitment is poorly correlated with themean April CUI values for the Gulf of Farallones. For example, the relationship betweenmean April CUI values and <strong>Merced</strong> River recruitment (Fig. 14) shows the lowrecruitment for spring 2005 at low CUI values as expected, but also indicates thatrecruitment was high in 1986 and 1998 at even lower CUI values. When incorporatedinto a multiple regression model with the mean La Grange flow from 1 February to 15June and 2 nd order polynomial Age 3 equivalent spawner abundance variables, the CUIhad negative coefficients for all periods from April through August, which is contrary tothose reported for Oregon coho salmon (Peterson et al. 2006) and the Chinook salmon inthe Smith River tributary (Wells et al. 2007). One explanation is that <strong>Merced</strong> River fallrunChinook salmon are primarily affected by instream flows in the <strong>Merced</strong> River whenthe juveniles are rearing and migrating downstream, whereas ocean conditions wouldonly have an effect during wet years, such as 2005 and 2006, when ocean conditionswere unusually unproductive. On the other hand, the survival of hatchery raised salmonthat are trucked to the Bay and Chinook salmon migrating in undamed rivers withfrequent floodplain inundation such as the Smith River would be expected to be primarilyaffected by ocean conditions.Adult Harvest In The OceanThe decline in the <strong>Merced</strong> River escapement of naturally produced fall-run Chinooksalmon since 1999 (Fig. 4) cannot be explained by the sport and troll harvest rates ofadult salmon in the ocean. The Central Valley Index of Ocean Harvest (CVI), which isestimated each year by the Pacific Fishery Management Council (PFMC 2008) bydividing total harvest south of Point Arena by the total hatchery and natural escapementto all Central Valley rivers, averaged 67.2% from 1980 to 1998 and 42.1% from 1999 to2007 (Fig. 15). CWT based estimates of ocean harvest rates for Central Valley fall-runChinook salmon were computed by dividing the total number of all Central Valleyhatchery CWT salmon harvested in the ocean by the total number of Central Valleyhatchery CWT salmon in the ocean harvest and inland escapements for each year (Fig.15; <strong>Mesick</strong> et al. 2009a, 2009b). Since the CWT based estimates are not based on theassumption that they are only caught south of Point Arena, they are probably moreaccurate than the CVI estimates. There is no relationship between the escapement ofnaturally produced fall-run Chinook salmon in the <strong>Merced</strong> River from 1999 to 2007 andthe CWT based ocean harvest rates (Fig. 16).24
Fig. 14. The relationship between <strong>Merced</strong> River naturally produced adult fall-runChinook salmon recruitment and the mean Cumulative Upwelling Index at37.5 o N latitude (Gulf of the Farallones) for May and June from 1980 to 2005.Fig. 15. Estimated ocean harvest rates of Central Valley fall-run Chinook salmon from1980 to 2007 in the combined commercial (troll) and sport fisheries based onCWT recovery estimates (<strong>Mesick</strong> et al. 2009a, 2009b) and the Central ValleyIndex (PFMC 2008).25
Fig. 16. Escapement of naturally produced Chinook salmon relative to the CWT harvestrate estimates from 1999 to 2007.DISCUSSIONThe <strong>Merced</strong> River fall-run Chinook salmon population is at a high risk of extinctionprimarily due to inadequate instream flow releases from Crocker-Huffman Dam, duringthe spring when the daily maximum water temperatures in the lower river exceed theEPA (2003) threshold of 59 o F for smoltification and to a lesser extent during late Octoberwhen adult salmon are migrating upstream. The importance of flow and watertemperatures in the <strong>Merced</strong> River and the San Joaquin River near Vernalis was apparentin analyses with both adult recruitment and smolt CWT survival studies. It is likely thatmaintaining water temperatures below the EPA (2003) threshold of 59 o F, particularly inthe lower <strong>Merced</strong> River, is important for smoltification and the number of smolts thatleave the <strong>Merced</strong> River; whereas flows and water temperatures in the San Joaquin Riverare an important determinant of smolt survival in the Delta. The logistic model analysisof CWT return rates of juvenile MRH smolts released in the <strong>Merced</strong> River indicate thatDelta export rates, the presence of a physical barrier at the Head of the Old River, Deltaoutflow, and ocean conditions (April CUI) have little effect on smolt survival ratescompared to the effect of flow and water temperature.Other factors that put the population at a high risk of extinction include unusuallyunfavorable ocean conditions for the survival of juvenile salmon and the large numbersof out-of-basin hatchery fish that stray to the <strong>Merced</strong> River. Unusually unfavorableocean conditions occurred during spring 2005 and 2006 that caused an extensive failure26
of the Central Valley fisheries (Lindley et al. 2009). It is likely that these extremelyunfavorable ocean conditions were infrequent during the 1980 to 2005 period of studybecause adult recruitment for the 2005 cohort was unusually low considering that the2005 April CUI was moderate and high recruitments occurred at much lower April CUIlevels (e.g., 1983 and 1998; Fig. 12). The number of out-of-basin hatchery fish in the<strong>Merced</strong> River is primarily determined by the number of MRFI juvenile salmon that arereleased in the Delta. Substantially reducing the number of out-of-basin hatchery fishcould be accomplished by minimizing the number of juvenile salmon that are trucked tothe Delta for release.To maintain the <strong>Merced</strong> River fall-run Chinook salmon population at a low risk ofextinction, it will be necessary to increase the population in regard to all four of theLindley et al. (2007) risk of extinction criteria. First, it will be necessary to increase thedry water year flow releases to keep escapement above 833 fish. Second, it will benecessary to increase normal water year flow releases to double the escapements andthereby reduce the rate of decline between wet-year escapements and dry-yearescapements to below 10% or less annually. Increasing normal water year flow releaseswould also help reduce the percentage of hatchery fish. Third, it will be necessary tominimize the number of MRFI juvenile fish that are trucked to the Delta for release.To keep escapement above 833 fish during Critical and Dry water year types, when theSan Joaquin Water Year Index is 2.5 MAF or less, it will be necessary to implement aflow schedule that includes: (1) a 10-day, 1,200 cfs late October pulse flow release tominimize adult straying; and (2) flow management for Crocker-Huffman Dam releases tokeep water temperatures throughout the river below a threshold of 59 o F from 20 Marchthrough at least 20 April to improve smolt survival. The recommended 59-degreeFahrenheit threshold should be maintained from 20 March to 30 April in Below Normalwater year types and to at least 15 May in Above Normal and Wet water year types tohelp reduce the magnitude in population fluctuations and reduce the percentage ofhatchery fish.Another recommendation is to gradually ramp down the flood control releases duringearly summer to improve the recruitment of riparian tree species and thereby augment theamount of organic matter, shade, and woody debris and thereby improve the habitatquality for juvenile salmon. Research on a variety of cottonwood and willow speciessuggests that 1 to 1.5 inches/day is the maximum rate of water table decline for seedlingsurvival (McBride et al. 1989; Segelquist et al. 1993; Mahoney and Rood 1993, 1998;Amlin and Rood 2002). Ramping down is necessary so that the root growth of the treeseedlings can keep up with the decline in the groundwater table as flows recede.Ramping rates of 100 to 300 cfs/day in the San Joaquin Basin are thought to preventseedling desiccation under the assumed 1 inch/day maximum root growth rate.27
REFERENCESAD Consultants, Resource Management Associates, Inc., and Watercourse Engineering,Inc. 2009. San Joaquin River Basin water temperature modeling and analysis.Prepared for CALFED, ERP-06D-S20. Moraga, <strong>California</strong>. October 2009.Allendorf, F.W., D. Bayles, D.L Bottom, K.P. Currens, C.A. Frissell, D. Hankin, J.A.Lichatowich, W. Nehlsen, P.C. Trotter, T.H. Williams. 1997. Prioritizing Pacificsalmon stocks for conservation. Conservation Biology 11:140–152.Amlin, N.M. and S.B. Rood. 2002. Comparative tolerances of riparian willows andcottonwoods to water-table decline. Wetlands 22: 338.Bakun, A. 1973. Coastal upwelling indices, west coast of North America, 1946–Department of Commerce, NOAA Technical Report NMFS-SSRF-671.Barnett-Johnson, R., C.B. Grimes, C.F. Royer, and C.J. Donohoe. 2007. Identifying thecontribution of wild and hatchery Chinook salmon (Oncorhynchus tshawytscha)to the ocean fishery using otolith microstructure as natural tags. Canadian Journalof Fisheries and Aquatic Sciences 64:1683-1692.Brandes, P.L. and J.S. McLain. 2001. Juvenile Chinook salmon abundance, distribution,and survival in the Sacramento-San Joaquin Estuary. In: Brown, R.L., editor.Fish Bulletin 179: Contributions to the biology of Central Valley salmonids.Volume 2. Sacramento (CA): <strong>California</strong> Department of Fish and Game. Pages39-138.Casillas, E. 2007. Coastal and ocean ecosystems – current findings linking plume andocean conditions to salmon growth and survival. Oral presentation given at theScience Policy Exchange, Pacificorp Auditorium, Portland State University,Portland, Oregon, September 12-13, 2007. The exchange was part of theColumbia River Fish and Wildlife Program amendment process sponsored by theNorthwest Power and Conservation Council.http://www.nwcouncil.org/fw/program/2008amend/spe/agenda.htm.Chase, C.O. 1978. <strong>Merced</strong> River Fish Facility Annual Report. 1973-74. AnadromousFisheries Branch Administrative Report No. 78-3.Cozart, M.D. 2005. Annual Report, <strong>Merced</strong> River Hatchery, 2004-2005. Lands andFacilities Branch Administrative Report.[EPA] United States Environmental <strong>Protection</strong> Agency. 2003. EPA Region 10 Guidancefor Pacific Northwest State and Tribal Temperature Water Quality Standards.EPA 910-B-03-002. 49 pp. April.28
Hoar, W.S. 1988. The physiology of smolting salmonids. Pages 275-326 in W.S. Hoarand D.J. Randall, editors. Fish Physiology. Academic Press, New York.Hollowed, A. B., S. R. Hare, and W. S. Wooster. 2001. Pacific Basin climate variabilityand patterns of Northeast Pacific marine fish production. Progr. Oceanography49: 257-282.Lindley, S.T., R.S. Schick, E. Mora, P.B. Adams, J.J. Anderson, S. Greene, C. Hanson,B.P. May, D.R. McEwan, R.B. MacFarlane, C. Swanson, and J.G. Williams.2007. Framework for assessing viability of threatened and endangered salmon andsteelhead in the Sacramento- San Joaquin Basin. San Francisco Estuary andWatershed Science Volume 5, Issue 1 [February 2007], article 4. Available at:http://repositories.cdlib.org/jmie/sfews/vol5/iss1/art4Lindley, S.T., C.B. Grimes, M.S. Mohr, W. Peterson, J. Stein, J.T. Anderson, L.W.Botsford, , D.L. Bottom, C.A. Busack, T.K. Collier, J. Ferguson, J.C. Garza, A.M.Grover, D.G. Hankin, R.G. Kope, P.W. Lawson, A. Low, R.B. MacFarlane, K.Moore, M. Palmer-Zwahlen, F.B. Schwing, J. Smith, C. Tracy, R. Webb, B.K.Wells, and T.H. Williams. 2009. What caused the Sacramento River fallChinook stock collapse? Pre-publication report to the Pacific FisheryManagement Council. March 18, 2009Mantua, N.J., S. R. Hare, Y. Zhang, J.M. Wallace, and R.C. Francis. 1997. A Pacificinterdecadal climate oscillation with impacts on salmon production. BulletinAmerican Meteorological Society 78: 1069-1079.MacFarlane, R. B., and Norton, E. C. 2002. Physiological ecology of juvenile Chinooksalmon (Oncorhynchus tshawytscha) at the southern end of their distribution, theSan Francisco Estuary and Gulf of the Farallones, <strong>California</strong>. Fisheries Bulletin100: 244-257.Mahoney, J. M., and S. B. Rood. 1993. A model for assessing the effects of altered riverflows on the recruitment of riparian cottonwoods. B. Tellman, H. J. Cortner, M.G. Wallace, L. F. DeBano and R. H. Hamre, editors. Riparian management:common threads and shared interests. General Technical Report RM-226. USDAForest Service.Mahoney, J. M., and S. B. Rood. 1998. Streamflow requirements for cottonwoodseedling recruitment – an integrative model. Wetlands 18: 634-645.McBride, J. R., N. Sugihara, and E. Norberg. 1989. Growth and survival of threeriparian woodland species in relation to simulated water table dynamics.Environment, Health, and Safety Report No. 009.4-89.3. Prepared by Universityof <strong>California</strong>, Department of Forestry and Resource Management, Berkeley forPacific Gas and Electric Company, Department of Research and Development,San Ramon, <strong>California</strong>.29
Menchen, R.S. 1971. <strong>Merced</strong> River King (Chinook) salmon spawning channel annualreport for 1970-1971 season. Anadromous Fisheries Branch AdministrativeReport No. 72-6. Submitted October 1971.<strong>Mesick</strong>, C.F., D. Marston, and T. Heyne. 2009a. Estimating the total number of codedwire-taggedadult fall-run Chinook salmon (Oncorhynchus tshawytscha) in<strong>California</strong>’s Central Valley rivers. El Dorado, CA. Manuscript submitted to the<strong>California</strong> Fish and Game Scientific Journal, October 2009. Excel file database:CV Summary August 2009 Fall-Run Surveys Final.xls.<strong>Mesick</strong>, C.F., D. Marston, and T. Heyne. 2009b. Estimating recruitment for fall-runChinook salmon populations in the Stanislaus, <strong>Merced</strong>, and <strong>Merced</strong> rivers. ElDorado, CA. Manuscript submitted to the <strong>California</strong> Fish and Game ScientificJournal, October 2009.Myrick, C.A. and J.J. Cech, Jr. 2001. Temperature effects on Chinook salmon andsteelhead: a review focusing on <strong>California</strong>’s Central Valley populations. Reportproduced for the CalFed Science Program.Newman, K.B. An evaluation of four Sacramento-San Joaquin River Delta juvenilesalmon survival studies. Report prepared for the CalFed Science Program by theU.S. Fish and Wildlife Service, Stockton. 31 March 2008.Pearcy, W. G. 1992. Ocean ecology of north pacific salmonids. University ofWashington.Peterson, W.T., R.C. Hooff, C.A. Morgan, K.L. Hunter, E. Casillas, and J.W. Ferguson.2006. Ocean conditions and salmon survival in the northern <strong>California</strong> Current.Northwest Fisheries Science Center, NOAA Fisheries Service. Seattle.[PFMC] Pacific Fisheries Management Council. 2008. Preseason Report I: stockabundance analysis for 2007 ocean salmon fisheries. February 2008. Portland,OR.Poe, S.D. 1982. Annual Report, <strong>Merced</strong> River Fish Facility Annual Report 1980-1981.Anadromous Fisheries Branch Administrative Report No. 82-23. Submitted1982.Segelquist, C. A., M. L. Scott, and G. T. Auble. 1993. Establishment of Populusdeltoides under simulated alluvial groundwater decline. The American MidlandNaturalist 130: 274-285.Sydeman, W. J., R. W. Bradley, P. Warzybok, C. L. Abraham, J. Jahncke, K. D.Hyrenbach, V. Kousky, J. M. Hipfner, and M. D. Ohman. 2006. Planktivorousauklet Ptychoramphus aleuticus responses to ocean climate, 2005: Unusualatmospheric blocking? Geophysical Research Letters 33:L22S09.30
Quinn, T.P. 2005. The behavior and ecology of Pacific salmon & trout. AmericanFisheries Society in association with University of Washington, Press, Seattle.Wells, B.K, B. Churchill, B. Grimes, and J.B. Waldvogel. 2007. Quantifying the effectsof wind, upwelling, curl, sea surface temperature and sea level height on growthand maturation of a <strong>California</strong> Chinook salmon (Oncorhynchus tshawytscha)population. Fisheries Oceanography 16(4): 363–382.Wells, B.K, J.C. Field, J.A. Thayer, C.B. Grimes, S.J Bogad, W.J. Sydeman, F.B.schwing, and R. Hewitt. 2008. Untangling the relationships among climate, preyand top predators in an ocean ecosystem. Marine Ecology Progress Series. 364:15-29.Wolf, S. G., W. J. Sydeman, J. M. Hipfner, C. L. Abraham, B. R. Tershy, and D. A.Croll. 2009. Range-wide reproductive consequences of ocean climate variabilityfor the seabird Cassins Auklet. Ecology 90:742–753.31
Table 1. Habitat and biological variables evaluated in the development of logistic modelsestimating the recovery rate of adult fall-run Chinook salmon in the <strong>Merced</strong> River thatwere released as juvenile salmon reared at the Central Valley hatcheries and marked withcoded-wire-tags.<strong>Merced</strong> River Hatchery Releases in the <strong>Merced</strong> River in Spring and Fall1. Mean flow at the confluence (RM 0) for days 3 to 6 following the release date forreleases in the upper river and for the day of the release for releases made near theconfluence with the San Joaquin River. The flow estimates were generated fromthe San Joaquin River basin HEC5Q hydrodynamic and thermodynamic computermodel developed by AD Consultants et al. (2009).2. Mean maximum water temperature at the confluence (RM 0) for days 3 to 6following the release date for releases in the upper river and for the day of therelease for releases made near the confluence with the San Joaquin River. Thetemperature estimates were generated from the San Joaquin River basin HEC5Qhydrodynamic and thermodynamic computer model developed by ADConsultants et al. (2009).3. Mean flow in the San Joaquin River at Vernalis for days 6 to 15 following therelease date. The flow estimates were obtained from the <strong>California</strong> Department ofWater Resources’ (DWR) Dayflow output files, which are available athttp://www.water.ca.gov/dayflow/output/4. Mean maximum water temperature in the San Joaquin River at Vernalis for days6 to 15 following the release date. The source of the data was USGS gage11303500.5. Mean total export rate at the SWP, CVP and CCC for days 6 to 15 following therelease date. The export rate estimates were obtained from the DWR Dayflowoutput files, which are available at http://www.water.ca.gov/dayflow/output/6. The mean of a conditional variable indicating the presence of the Head of the OldRiver Barrier (HORB) for days 6 to 15 following the release date. The operationschedule for the HORB is posted athttp://baydeltaoffice.water.ca.gov/sdb/tbp/web_pg/tempbsch.cfm. The variablewas assigned a value of 1 when the HORB was completed, a value of 0 when theHORB was not installed, and a fraction of 1 during the construction of the barrierthat reflected the degree of construction. For example, if it took 10 days toconstruct the barrier, a value of 0.9 was given on the ninth day of construction.7. Mean Delta outflow (cfs) for days 13 to 19 following the release date. The Deltaoutflow estimates (QOut) were obtained from the <strong>California</strong> Department of WaterResources’ (DWR) Dayflow output files, which are available athttp://www.water.ca.gov/dayflow/output/8. Rate that MRH adult salmon strayed to the Sacramento River Basin. Stray rateswere computed as the estimated total adult CWT recoveries in the SacramentoRiver Basin divided by the total Central Valley inland CWT recoveries. TheCWT recovery database is described by (<strong>Mesick</strong> et al. 2009a).9. Age-specific rate that adult salmon with CWTs were harvested in the sport andcommercial ocean fisheries. Harvest rates were computed as the estimated total32
number of adult Central Valley hatchery salmon with CWTs caught in the oceanfisheries divided by the total number of adult salmon recovered in the oceanfisheries and the Central Valley inland escapements. Age-specific rates were usedfor each model. For example, the model of Age 3 CWT recoveries evaluated theeffect of ocean harvest rates of Age 3 salmon. The CWT recovery database isdescribed by (<strong>Mesick</strong> et al. 2009a).10. The mean weight of the juvenile fish at the time of their release. The source ofthe size estimates were obtained from the Regional Mark Information System(RMIS), which is an online database managed by the Regional Mark ProcessingCenter in Portland, Oregon.11. The Coastal Upwelling Index (CUI) for the month of April for juvenile CWTreleases from April through August and the CUI index for the month ofNovember for juvenile releases from September through November. The CUIdatabase is developed and distributed by the Pacific Fisheries EnvironmentalLaboratory, National Marine Fisheries Service’s Southwest Fisheries ScienceCenter, Pacific Grove, <strong>California</strong>.12. A conditional variable called “Reach” was used to segregate releases in the upperriver from those released near the confluence with the San Joaquin River. Avalue of zero was used for the upper releases, which were usually made near thehatchery; whereas a value of 1.0 was used for the confluence releases typicallymade at the Hatfield and Hagaman parks.<strong>Merced</strong> River Hatchery Releases in the San Joaquin River upstream of Jersey Point inSpring and Fall1. The 7-day mean flow in the San Joaquin River at Vernalis following the releasedate.2. The 7-day mean maximum water temperature in the San Joaquin River at Vernalisfollowing the release date.3. The 7-day mean total export rate at the SWP, CVP, and CCC following therelease date.4. The 7-day mean for the conditional variable indicating the presence of the Headof the HORB.5. Mean Delta outflow (cfs) for days 7 to 13 following the release date.6. The rate that MRH adult salmon strayed to the Sacramento River Basin.7. Age-specific ocean harvest rates.8. The mean weight of the juvenile fish at the time of their release.9. The Coastal Upwelling Index (CUI) for the month of April for juvenile CWTreleases from April through August and the CUI index for the month ofNovember for juvenile releases from September through November.33
<strong>Merced</strong> River Hatchery Releases in the West Delta at Jersey Point in Spring1. The 7-day mean Delta outflow (cfs) following the release date.2. The rate that MRH adult salmon strayed to the Sacramento River Basin.3. Age-specific ocean harvest rates.4. The mean weight of the juvenile fish at the time of their release.5. The Coastal Upwelling Index (CUI) for the month of April for juvenile CWTreleases made in April and May.Mokelumne River Fish Installation Releases in the Mokelumne River in Spring and Fall1. The 7-day mean flow at Woodbridge Dam in the Mokelumne River (USGS gage11325500) following the release date.2. Mean flow in the Mokelumne River at Woodbridge Dam (USGS gage 11325500)from October 16 to 31 when the adult fish would be migrating upstream in theDelta.3. The mean flow of water from the Sacramento River to the lower MokelumneRiver through Georgiana Slough and the Delta Cross Channel (XGEO) for days 6to 15 following the release date. The XGEO flow estimates were obtained fromthe DWR Dayflow output files, which are available athttp://www.water.ca.gov/dayflow/output/4. Mean total export rate at the SWP, CVP and CCC for days 6 to 15 following therelease date.5. Mean Delta outflow (cfs) for days 13 to 19 following the release date.6. Rate that MRH adult salmon strayed to the Sacramento River Basin.7. Age-specific rate that adult salmon with CWTs were harvested in the sport andcommercial ocean fisheries.8. The mean weight of the juvenile fish at the time of their release.9. The Coastal Upwelling Index (CUI) for the month of April for juvenile CWTreleases from April through August and the CUI index for the month ofNovember for juvenile releases from September through November.Mokelumne River Fish Installation Releases in the Sacramento River in Spring and Fall1. The 7-day mean flow in the Sacramento River following the release date. Theflow estimates were obtained from the DWR Dayflow output files, which areavailable at http://www.water.ca.gov/dayflow/output/2. Mean Delta outflow (cfs) for days 7 to 13 following the release date.3. Mean flow in the Mokelumne River at Woodbridge Dam (USGS gage 11325500)from October 16 to 31 when the adult fish would be migrating upstream in theDelta.4. The rate that MRH adult salmon strayed to the Sacramento River Basin.34
5. Age-specific rate that adult salmon with CWTs were harvested in the sport andcommercial ocean fisheries.6. The mean weight of the juvenile fish at the time of their release.7. The Coastal Upwelling Index (CUI) for the month of April for juvenile CWTreleases from April through August and the CUI index for the month ofNovember for juvenile releases from September through November.Mokelumne River Fish Installation Releases in the East Delta (Mokelumne Riverbetween Delta Cross Channel and its mouth) in Spring and Fall1. The 7-day mean flow of water from the Sacramento River to the lowerMokelumne River through Georgiana Slough and the Delta Cross Channel(XGEO) following the release date.2. Mean Delta outflow (cfs) for days 3 to 13 following the release date.3. Mean flow in the Mokelumne River at Woodbridge Dam (USGS gage 11325500)from October 16 to 31 when the adult fish would be migrating upstream in theDelta.4. The rate that MRH adult salmon strayed to the Sacramento River Basin.5. Age-specific rate that adult salmon with CWTs were harvested in the sport andcommercial ocean fisheries.6. The mean weight of the juvenile fish at the time of their release.7. The Coastal Upwelling Index (CUI) for the month of April for juvenile CWTreleases from April through August and the CUI index for the month ofNovember for juvenile releases from September through November.Mokelumne River Fish Installation Releases in the West Delta in Spring and Fall1. The 7-day Mean Delta outflow (cfs) following the release date.2. Mean flow in the Mokelumne River at Woodbridge Dam (USGS gage 11325500)from October 16 to 31 when the adult fish would be migrating upstream in theDelta.3. The rate that MRH adult salmon strayed to the Sacramento River Basin.4. Age-specific rate that adult salmon with CWTs were harvested in the sport andcommercial ocean fisheries.5. The mean weight of the juvenile fish at the time of their release.6. The Coastal Upwelling Index (CUI) for the month of April for juvenile CWTreleases from April through August and the CUI index for the month ofNovember for juvenile releases from September through November.35
Sacramento Basin Hatchery Releases in the West Delta in Spring1. The 7-day Mean Delta outflow (cfs) following the release date.2. The mean flow of water from the Sacramento River to the lower MokelumneRiver through Georgiana Slough and the Delta Cross Channel (XGEO) fromOctober 10 to 25 when adult fish would be migrating upstream in the Delta.3. Age-specific rate that adult salmon with CWTs were harvested in the sport andcommercial ocean fisheries.4. The mean weight of the juvenile fish at the time of their release.5. The total number of juvenile fish released in each CWT group.6. The Coastal Upwelling Index (CUI) for the month of April for juvenile CWTreleases from April through August.36
Table 2a. Coefficients of the logistic regression models used to predict CWT recovery rates to the <strong>Merced</strong> River. Models includeCWT releases of <strong>Merced</strong> River Hatchery (MRH) juvenile salmon into the <strong>Merced</strong> River (Trib) and San Joaquin River (Mainstem)during the spring and fall. The excluded brood years are those with observed recovery rates near zero that were substantially lowerthan the predicted estimates or those years without observed recovery rates and the model over predicted the observed escapement.“Pos” indicated that the coefficient was positive, whereas the expected response was negative and so the variable was omitted fromthe model.MRH Trib Spring (Apr-May) MRH Trib Fall (Sep-Nov) MRH Mainstem SpringModel Deviance 0.12 0.17 0.03 0 0.02 0 0.1 0.06 0.01Degrees of Freedom 120 135 138 7 7 9 88 79 88CoefficientsVariable Age 2 Age 3 Age 4 Age 2 Age 3 Age 4 Age 2 Age 3 Age 4Constant 10.4825 11.7777 -2.36988 -7.18501 -7.03883 -10.1657 -7.66714 -4.02061 -9.90351April Coastal Upwelling Index 0.007061 0.007061 0.007061Adult Harvest Pos -3.80361 Pos -4.41985 -1.34971 Pos -1.6662 -7.77867 -1.42525Adult MRH Stray Rate -9.14173 -2.98646 Pos -10.8257 -2.03314 -3.19962 -4.50147 -6.02739 -0.57462<strong>Merced</strong> Flow 0.0007511 0.000751 0.000751Vernalis Max Temperature -0.2726 -0.27466 -0.12151 PosVernalis Flow 0.00005351 0.00003628 0.000112 0.00005825 0.00003896 0.00002716Excluded Brood Years .1981 1981 1979 1979 1979 1987 1981 19871986 1986 1986 1985-1992 1985-1992 1985-1992 1989-1994 1987 1989-19941987 1987 1987 1994-2004 1994-2004 1994-2004 2003 1989-1994 20041989 1989 1989 2004 20031990 1990 1990 20041991 1991 19911992 1992 19921994 2003May-98 2004 2004Apr-02200437
Table 2b. Mean recovery estimates by brood year for CWT releases of <strong>Merced</strong> River Hatchery (MRH) juvenile salmon into the SanJoaquin River (Mainstem) during the fall, Sacramento Basin hatchery juvenile salmon into the West Delta in spring, and MokelumneRiver Fish Installation (MRFI) juvenile salmon into the West Delta in fall. A logistic regression model was developed only for therecovery of Age 3 adults from Sac Basin releases in the West Delta in spring. The coefficients of this logistic model were used topredict CWT recovery rates to the <strong>Merced</strong> River. The excluded brood years are those with observed recovery rates near zero thatwere substantially lower than the predicted estimates or those years without observed recovery rates and the model over predicted theobserved escapement. “Pos” indicated that the coefficient was positive, whereas the expected response was negative and so thevariable was omitted from the model.MRH Mainstem Fall Sac West Delta Spring (Apr-Aug) MRFI West Delta FallNo NoModel ModelModel Deviance Brood Year No Model No Model No Model No Model 0.01 No ModelDegrees ofFreedom 145Variables Age 2 Age 3 Age 4 Age 2 Age 3 Age 4 Age 2 Age 3 Age 4CoefficientsConstant 1977 no data no data no data 0.0000% -13.5669 0.0000% no data no data no dataApril CUI 1978 no data no data no data 0.0000% 0.006518 0.0000% no data no data no dataAdult Harvest 1979 no data no data no data 0.0000% Pos 0.0000% 0.0000% 0.0000% 0.0000%Total Released 1980 0.0397% 0.0212% 0.0000% 0.0000% 8.995E-07 0.0000% 0.0000% 0.0000% 0.0000%Mean Fish Weight 1981 0.0349% 0.0000% 0.0000% 0.0000% 0.02568 0.0000% 0.0000% 0.0000% 0.0000%October XGEO 1982 0.0000% 0.1405% 0.0000% 0.0000% 0.0002958 0.0000% no data no data no data1983 0.1035% 0.3813% 0.0000% 0.0000% 0.0000% no data no data no data1984 0.1132% 0.0000% 0.0000% 0.0000% 0.0000% no data no data no data1985 no data no data no data 0.0000% 0.0000% 0.0000% 0.0000% 0.0000%NoModelExcludedBrood Years 0.0000% no data no data no data1986 no data no data no data 0.0000%1987 no data no data no data 0.0000% 77, 78, 83 0.0000% no data no data no data1988 no data no data no data 0.0000% 86-89 0.0010% no data no data no data1989 no data no data no data 0.0000% 2004 0.0000% no data no data no data1990 no data no data no data 0.0000% 0.0027% no data no data no data1991 no data no data no data 0.0000% 0.0000% no data no data no data38
MRH Mainstem Fall Sac West Delta Spring (Apr-Aug) MRFI West Delta FallNo NoModel ModelModel Deviance Brood Year No Model No Model No Model No Model 0.01 No ModelDegrees ofFreedom 145Variables Age 2 Age 3 Age 4 Age 2 Age 3 Age 4 Age 2 Age 3 Age 41992 no data no data no data 0.0000% 0.0000% no data no data no data1993 no data no data no data 0.0021% 0.0001% no data no data no data1994 no data no data no data 0.0000% 0.0002% no data no data no data1995 no data no data no data 0.0000% 0.0000% no data no data no data1996 no data no data no data 0.0000% 0.0000% no data no data no data1997 no data no data no data 0.0000% 0.0000% no data no data no data1998 no data no data no data 0.0030% 0.0000% no data no data no data1999 no data no data no data 0.0000% 0.0000% no data no data no data2000 no data no data no data 0.0136% 0.0019% no data no data no data2001 no data no data no data 0.0024% 0.0007% 0.0291% 0.1054% 0.0127%2002 no data no data no data 0.0009% 0.0000% no data no data no data2003 no data no data no data 0.0000% 0.0000% no data no data no data2004 no data no data no data 0.0000% 0.0000% no data no data no dataNoModel39
Table 2c. Coefficients of the logistic regression models used to predict CWT recovery rates to the <strong>Merced</strong> River. Models includeCWT releases of <strong>Merced</strong> River Hatchery (MRH) and Mokelumne River Fish Installation (MRFI) juvenile salmon into the West Deltaduring the spring and MRFI juveniles into the East Delta in spring. Mean recovery estimates by brood year are provided for Age 4recoveries of MRFI juveniles in the East Delta in spring. The excluded brood years are those with observed recovery rates near zerothat were substantially lower than the predicted estimates or those years without observed recovery rates and the model over predictedthe observed escapement. “Pos” or “Neg indicated that the sign of the coefficient was opposite of the expected response and so thevariable was omitted from the model.MRH Delta Spring MRFI West Delta Spring MRFI East Delta SpringModel Deviance 0.03 0.03 0 0.01 0.01 0 0 0.01 No ModelDegrees of Freedom 19 18 16 27 31 32 33 55Age 2 Age 3 Age 4 Age 2 Age 3 Age 4 Age 2 Age 3 Age 4 Brood YearVariables CoefficientsConstant -4.41055 -4.79326 -9.57798 -10.3569 -8.96425 -10.7096 -9.10828 -5.61953 no data 1977April CUI Neg 0.002692 0.003779 0.01167 0.01167 0.01167 Neg Neg no data 1978Adult Harvest -8.59806 -5.64387 -1.37149 -0.33279 -1.41048 Pos Pos -7.61826 no data 1979Adult MRH Stray Rate -17.7749 -6.5203 -0.09696 -1.36962 -2.74197 -0.18827 -4.60144 -5.42516 no data 1980Delta Outflow 0.00002981 0.00001025 no data 1981Total Number Released 3.073E-07 Neg no data 1982Mean Fish Weight 0.22094 0.22094 0.22094 no data 1983Spring XGEO 0.00005944 0.00002392 no data 1984no data 1985Excluded Brood Years . no data 19861979-1994 1979-1994 1979-1994 1982, 1984 1987-1990 1985-1990 1979-1991 1979-1990 no data 19872004 2004 2004 1986-1990 2001, 2004 2001, 2004 1996 2003-2004 no data 19881994, 1996 2001-2004 no data 19892000, 2004 no data 19900.0000% 19910.0005% 19920.0010% 19930.0004% 199440
MRH Delta Spring MRFI West Delta Spring MRFI East Delta SpringModel Deviance 0.03 0.03 0 0.01 0.01 0 0 0.01 No ModelDegrees of Freedom 19 18 16 27 31 32 33 55Age 2 Age 3 Age 4 Age 2 Age 3 Age 4 Age 2 Age 3 Age 4 Brood Year0.0000% 19950.0000% 19960.0000% 19970.0000% 19980.0000% 19990.0000% 20000.0000% 20010.0000% 20020.0000% 20030.0000% 200441
Table 2d. Mean recovery estimates by brood year for CWT releases of Mokelumne River Fish Installation (MRFI) juvenile salmoninto the East Delta during the fall, the Sacramento River near West Sacramento (mainstem) in spring, and the Sacramento River nearRio Vista (mainstem) in fall.MRFI East Delta FallMRFI Mainstem Spring(Spring 2001 only)MRFI Mainstem Fall(Fall 77-81)No Model No Model No Model No Model No Model No Model No Model No Model No ModelBrood Year Age 2 Age 3 Age 4 Age 2 Age 3 Age 4 Age 2 Age 3 Age 41977 No Data No Data No Data No Data No Data No Data 0.0000% 0.0000% 0.0000%1978 No Data No Data No Data No Data No Data No Data 0.0000% 0.0648% 0.0000%1979 No Data No Data No Data No Data No Data No Data 0.0000% 0.0432% 0.0000%1980 No Data No Data No Data No Data No Data No Data 0.0000% 0.0000% 0.0000%1981 No Data No Data No Data No Data No Data No Data 0.0000% 0.0000% 0.0000%1982 No Data No Data No Data No Data No Data No Data No Data No Data No Data1983 No Data No Data No Data No Data No Data No Data No Data No Data No Data1984 No Data No Data No Data No Data No Data No Data No Data No Data No Data1985 No Data No Data No Data No Data No Data No Data No Data No Data No Data1986 No Data No Data No Data No Data No Data No Data No Data No Data No Data1987 No Data No Data No Data No Data No Data No Data No Data No Data No Data1988 No Data No Data No Data No Data No Data No Data No Data No Data No Data1989 No Data No Data No Data No Data No Data No Data No Data No Data No Data1990 No Data No Data No Data No Data No Data No Data No Data No Data No Data1991 No Data No Data No Data No Data No Data No Data No Data No Data No Data1992 No Data No Data No Data No Data No Data No Data No Data No Data No Data1993 No Data No Data No Data No Data No Data No Data No Data No Data No Data1994 No Data No Data No Data No Data No Data No Data No Data No Data No Data1995 No Data No Data No Data No Data No Data No Data No Data No Data No Data1996 No Data No Data No Data No Data No Data No Data No Data No Data No Data1997 No Data No Data No Data No Data No Data No Data No Data No Data No Data1998 No Data No Data No Data No Data No Data No Data No Data No Data No Data1999 0.0227% 0.0312% 0.0059% No Data No Data No Data No Data No Data No Data2000 No Data No Data No Data 0.0167% 0.0084% 0.0007% No Data No Data No Data42
MRFI East Delta FallMRFI Mainstem Spring(Spring 2001 only)MRFI Mainstem Fall(Fall 77-81)No Model No Model No Model No Model No Model No Model No Model No Model No ModelBrood Year Age 2 Age 3 Age 4 Age 2 Age 3 Age 4 Age 2 Age 3 Age 42001 0.0000% 0.0100% 0.0007% No Data No Data No Data No Data No Data No Data2002 No Data No Data No Data No Data No Data No Data No Data No Data No Data2003 No Data No Data No Data No Data No Data No Data No Data No Data No Data2004 No Data No Data No Data No Data No Data No Data No Data No Data No Data43
Table 2e. Mean recovery estimates by brood year for CWT releases of Mokelumne River Fish Installation (MRFI) juvenile salmoninto the Mokelumne River (Trib) during the spring and fall.MRFI Trib SpringMRFI Trib FallNo Model No Model No ModelNoModelNoModelNoModelBrood Year Age 2 Age 3 Age 4 Age 2 Age 3 Age 41977 No Data No Data No Data 0.0000% 0.0000% 0.0000%1978 No Data No Data No Data 0.0000% 0.0000% 0.0000%1979 No Data No Data No Data 0.0000% 0.0000% 0.0000%1980 No Data No Data No Data No Data No Data No Data1981 No Data No Data No Data No Data No Data No Data1982 0.0000% 0.0000% 0.0000% No Data No Data No Data1983 No Data No Data No Data No Data No Data No Data1984 No Data No Data No Data No Data No Data No Data1985 No Data No Data No Data No Data No Data No Data1986 No Data No Data No Data No Data No Data No Data1987 No Data No Data No Data No Data No Data No Data1988 No Data No Data No Data No Data No Data No Data1989 No Data No Data No Data No Data No Data No Data1990 0.0000% 0.0010% 0.0000% No Data No Data No Data1991 0.0000% 0.0000% 0.0000% 0.0000% 0.0044% 0.0000%1992 0.0000% 0.0000% 0.0000% 0.0000% 0.0000% 0.0000%1993 No Data No Data No Data 0.0000% 0.0044% 0.0080%1994 No Data No Data No Data 0.0000% 0.0000% 0.0000%1995 No Data No Data No Data 0.0135% 0.0000% 0.0000%1996 No Data No Data No Data 0.0000% 0.0000% 0.0000%1997 No Data No Data No Data 0.0000% 0.0000% 0.0000%1998 No Data No Data No Data No Data No Data No Data1999 No Data No Data No Data No Data No Data No Data2000 No Data No Data No Data No Data No Data No Data44
MRFI Trib SpringMRFI Trib FallNo Model No Model No ModelNoModelNoModelNoModelBrood Year Age 2 Age 3 Age 4 Age 2 Age 3 Age 42001 No Data No Data No Data 0.0000% 0.0005% 0.0000%2002 0.0000% 0.0000% 0.0000% No Data No Data No Data2003 0.0000% 0.0000% 0.0000% No Data No Data No Data2004 No Data No Data No Data No Data No Data No Data45
Table 3. Department of Fish and Game estimates of total escapement of fall-run Chinook Salmon in the <strong>Merced</strong> River and the <strong>Merced</strong>River Hatchery (GrandTab), estimated total number of marked (coded-wire tag and adipose clipped) hatchery adults that returned tothe <strong>Merced</strong> River and hatchery, estimated number of unmarked hatchery adults from the Coleman National Fish Hatchery,Mokelumne River Fish Installation, Nimbus Fish Hatchery, Feather River Hatchery, and <strong>Merced</strong> River Hatchery that returned to the<strong>Merced</strong> River and hatchery, estimated total escapements of naturally produced and hatchery produced adults, and the percent hatcheryfish in the total escapement from 1981 to 2008.MarkedHatcheryAdultsColemanNationalFishHatcheryUnmarked AdultsFeatherRiverHatchery<strong>Merced</strong>RiverHatcheryEstimatedNaturalEscapementEstimatedHatcheryEscapementTotalEscapementMokelumneHatcheryNimbusHatcheryPercentHatchery1981 10,415 445 0 166 0 0 0 9,805 610 5.9%1982 3,263 955 0 387 0 1 0 1,920 1,343 41.2%1983 18,248 5,708 0 6 539 219 0 11,775 6,473 35.5%1984 29,749 5,355 0 88 38 59 0 24,209 5,540 18.6%1985 16,052 1,895 0 158 30 86 285 13,599 2,453 15.3%1986 7,439 2,037 0 297 130 20 1,607 3,348 4,091 55.0%1987 4,126 700 0 101 71 119 161 2,974 1,152 27.9%1988 4,592 344 0 0 93 85 142 3,928 664 14.5%1989 427 157 0 115 0 0 58 97 330 77.3%1990 82 7 0 0 0 0 4 71 11 13.9%1991 119 3 0 0 0 0 0 116 3 2.5%1992 986 252 0 0 33 42 0 658 328 33.3%1993 1678 493 167 234 93 221 0 638 1,207 71.9%1994 3589 363 161 692 124 209 15 2,186 1,564 43.6%46
MarkedHatcheryAdultsColemanNationalFishHatcheryUnmarked AdultsFeatherRiverHatchery<strong>Merced</strong>RiverHatcheryEstimatedNaturalEscapementEstimatedHatcheryEscapementTotalEscapementMokelumneHatcheryNimbusHatcheryPercentHatchery1995 2922 1,155 0 1,013 131 338 14 271 2,651 90.7%1996 4,432 1,551 0 559 97 156 1,298 772 3,660 82.6%1997 3,660 956 0 290 52 56 1,341 964 2,696 73.7%1998 4,091 1,392 0 251 31 41 450 1,926 2,165 52.9%1999 4,766 1,538 0 883 111 140 446 1,648 3,118 65.4%2000 13,076 4,430 0 1,722 174 207 2,314 4,228 8,848 67.7%2001 10,844 5,507 0 2,588 147 193 554 1,856 8,988 82.9%2002 10,706 7,017 0 1,868 32 429 857 503 10,203 95.3%2003 3,079 1,848 0 1,189 78 197 332 50 3,029 98.4%2004 4,320 862 0 1,508 104 189 818 839 3,481 80.6%2005 2532 308 0 867 87 108 797 365 2,167 85.6%2006 1621 177 0 612 68 118 80 566 1,055 65.1%2007 574 48 0 113 0 1 35 378 196 34.1%47
APPENDIX 10.40%0.35%0.30%Predicted0.25%0.20%0.15%0.10%0.05%0.00%0.00% 0.05% 0.10% 0.15% 0.20% 0.25% 0.30% 0.35% 0.40%ObservedFigure A-1. Predicted recovery rates from the final logistic regression model versus meanobserved recovery rates for each brood year of Age 2 <strong>Merced</strong> River Hatchery fall-run Chinooksalmon in the <strong>Merced</strong> River that were released as CWT juveniles in the <strong>Merced</strong> River duringspring. Plot does not include low CWT recovery estimates excluded from model development.0.90%0.80%0.70%0.60%Predicted0.50%0.40%0.30%0.20%0.10%0.00%0.00% 0.10% 0.20% 0.30% 0.40% 0.50% 0.60% 0.70% 0.80% 0.90%ObservedFigure A-2. Predicted recovery rates from the final logistic regression model versus meanobserved recovery rates for each brood year of Age 3 <strong>Merced</strong> River Hatchery fall-run Chinooksalmon in the <strong>Merced</strong> River that were released as CWT juveniles in the <strong>Merced</strong> River duringspring. Plot does not include low CWT recovery estimates excluded from model development.48
Predicted0.20%0.18%0.16%0.14%0.12%0.10%0.08%0.06%0.04%0.02%0.00%0.00% 0.02% 0.04% 0.06% 0.08% 0.10% 0.12% 0.14% 0.16%ObservedFigure A-3. Predicted recovery rates from the final logistic regression model versus observedrecovery rates for each brood year of Age 4 <strong>Merced</strong> River Hatchery fall-run Chinook salmon inthe <strong>Merced</strong> River that were released as CWT juveniles in the <strong>Merced</strong> River during spring. Plotdoes not include low CWT recovery estimates excluded from model development.0.30%0.25%0.20%Predicted0.15%0.10%0.05%0.00%0.00% 0.05% 0.10% 0.15% 0.20% 0.25% 0.30%ObservedFigure A-4. Predicted recovery rates from the final logistic regression model versus meanobserved recovery rates for each brood year of Age 2 <strong>Merced</strong> River Hatchery fall-run Chinooksalmon in the <strong>Merced</strong> River that were released as CWT juveniles in the San Joaquin Riverupstream from Jersey Point during spring. Plot does not include low CWT recovery estimatesexcluded from model development.49
0.40%0.35%0.30%0.25%Predicted0.20%0.15%0.10%0.05%0.00%0.00% 0.05% 0.10% 0.15% 0.20% 0.25% 0.30% 0.35% 0.40%ObservedFigure A-5. Predicted recovery rates from the final logistic regression model versus meanobserved recovery rates for each brood year of Age 3 <strong>Merced</strong> River Hatchery fall-run Chinooksalmon in the <strong>Merced</strong> River that were released as CWT juveniles in the San Joaquin Riverupstream from Jersey Point during spring. Plot does not include low CWT recovery estimatesexcluded from model development.0.03%0.02%Predicted0.02%0.01%0.01%0.00%0.00% 0.01% 0.01% 0.02% 0.02% 0.03% 0.03%ObservedFigure A-6. Predicted recovery rates from the final logistic regression model versus meanobserved recovery rates for each brood year of Age 4 <strong>Merced</strong> River Hatchery fall-run Chinooksalmon in the <strong>Merced</strong> River that were released as CWT juveniles in the San Joaquin Riverupstream from Jersey Point during spring. Plot does not include low CWT recovery estimatesexcluded from model development.50
0.80%0.70%0.60%0.50%Predicted0.40%0.30%0.20%0.10%0.00%0.00% 0.10% 0.20% 0.30% 0.40% 0.50% 0.60% 0.70% 0.80% 0.90%ObservedFigure A-7. Predicted recovery rates from the final logistic regression model versus meanobserved recovery rates for each brood year of Age 2 <strong>Merced</strong> River Hatchery fall-run Chinooksalmon in the <strong>Merced</strong> River that were released as CWT juveniles in the West Delta at JerseyPoint during spring. Plot does not include low CWT recovery estimates excluded from modeldevelopment.Predicted1.00%0.90%0.80%0.70%0.60%0.50%0.40%0.30%0.20%0.10%0.00%0.00% 0.20% 0.40% 0.60% 0.80% 1.00%ObservedFigure A-8. Predicted recovery rates from the final logistic regression model versus meanobserved recovery rates for each brood year of Age 3 <strong>Merced</strong> River Hatchery fall-run Chinooksalmon in the <strong>Merced</strong> River that were released as CWT juveniles in the West Delta at JerseyPoint during spring. Plot does not include low CWT recovery estimates excluded from modeldevelopment.51
0.07%0.06%0.05%Predicted0.04%0.03%0.02%0.01%0.00%0.00% 0.01% 0.02% 0.03% 0.04% 0.05% 0.06%ObservedFigure A-9. Predicted recovery rates from the final logistic regression model versus meanobserved recovery rates for each brood year of Age 4 <strong>Merced</strong> River Hatchery fall-run Chinooksalmon in the <strong>Merced</strong> River that were released as CWT juveniles in the West Delta at JerseyPoint during spring. Plot does not include low CWT recovery estimates excluded from modeldevelopment.0.009%0.008%0.007%0.006%Predicted0.005%0.004%0.003%0.002%0.001%0.000%0.000% 0.002% 0.004% 0.006% 0.008% 0.010%ObservedFigure A-10. Predicted recovery rates from the final logistic regression model versus meanobserved recovery rates for each brood year of Age 3 Sacramento Basin Hatchery fall-runChinook salmon in the <strong>Merced</strong> River that were released as CWT juveniles in the West Deltaduring spring. Plot does not include low CWT recovery estimates excluded from modeldevelopment. Models were not developed for Age 2 and Age 4 salmon.52
0.03%0.03%0.02%Predicted0.02%0.01%0.01%0.00%0.00% 0.01% 0.01% 0.02% 0.02% 0.03% 0.03%ObservedFigure A-11. Predicted recovery rates from the final logistic regression model versus meanobserved recovery rates for each brood year of Age 2 Mokelumne River Fish Installation fall-runChinook salmon in the <strong>Merced</strong> River that were released as CWT juveniles in the West Deltaduring spring. Plot does not include low CWT recovery estimates excluded from modeldevelopment.0.16%0.14%0.12%0.10%Predicted0.08%0.06%0.04%0.02%0.00%0.00% 0.02% 0.04% 0.06% 0.08% 0.10% 0.12% 0.14% 0.16% 0.18%ObservedFigure A-12. Predicted recovery rates from the final logistic regression model versus meanobserved recovery rates for each brood year of Age 3 Mokelumne River Fish Installation fall-runChinook salmon in the <strong>Merced</strong> River that were released as CWT juveniles in the West Deltaduring spring. Plot does not include low CWT recovery estimates excluded from modeldevelopment.53
0.03%0.02%Predicted0.01%0.00%0.00% 0.01% 0.02% 0.03%ObservedFigure A-13. Predicted recovery rates from the final logistic regression model versus meanobserved recovery rates for each brood year of Age 4 Mokelumne River Fish Installation fall-runChinook salmon in the <strong>Merced</strong> River that were released as CWT juveniles in the West Deltaduring spring. Plot does not include low CWT recovery estimates excluded from modeldevelopment.0.018%0.016%0.014%0.012%Predicted0.010%0.008%0.006%0.004%0.002%0.000%0.000% 0.003% 0.006% 0.009% 0.012% 0.015% 0.018%ObservedFigure A-14. Predicted recovery rates from the final logistic regression model versus meanobserved recovery rates for each brood year of Age 2 Mokelumne River Fish Installation fall-runChinook salmon in the <strong>Merced</strong> River that were released as CWT juveniles in the East Deltaduring spring. Plot does not include low CWT recovery estimates excluded from modeldevelopment.54
Observed0.050%0.045%0.040%0.035%0.030%0.025%0.020%0.015%0.010%0.005%0.000%0.00% 0.01% 0.02% 0.03% 0.04% 0.05%PredictedFigure A-15. Predicted recovery rates from the final logistic regression model versus meanobserved recovery rates for each brood year of Age 3 Mokelumne River Fish Installation fall-runChinook salmon in the <strong>Merced</strong> River that were released as CWT juveniles in the East Deltaduring spring. Plot does not include low CWT recovery estimates excluded from modeldevelopment.55
APPENDIX 2Releases of untagged juvenile salmon organized by hatchery, release date, and release location, the estimated rate that each groupwould be recovered in the <strong>Merced</strong> River escapement, and the estimated number of untagged adult hatchery salmon in the <strong>Merced</strong>River escapement from 1980 to 2007. The Release Location Codes 1, 2, 3.1, and 3.2 correspond to tributary, mainstem, East Delta,and West Delta.ReleaseLocationCodeColeman National Fish Hatchery<strong>Merced</strong> Recovery RatesEscapementTotalNumberReleased Age 2 Age 3 Age 4 Age 2 Age 3 Age 4DateReleased Release Location1 4-Feb-80 CNFH 92,700 0.0000% 0.0000% 0.0000% 0 0 01 20-Apr-79 CNFH 680,975 0.0000% 0.0000% 0.0000% 0 0 01 9-May-79 CNFH 42,275 0.0000% 0.0000% 0.0000% 0 0 01 19-Oct-79 CNFH 1,013,462 0.0000% 0.0000% 0.0000% 0 0 01 3-Dec-79 CNFH 827,504 0.0000% 0.0000% 0.0000% 0 0 02 20-Apr-79 Posse Grounds 3,405,975 0.0000% 0.0000% 0.0000% 0 0 02 4-Sep-79 RED BLUFF DIVER. DAM 522,575 0.0000% 0.0000% 0.0000% 0 0 01 13-Mar-80 BATTLE CREEK 190,000 0.0000% 0.0000% 0.0000% 0 0 01 17-Apr-80 BATTLE CREEK 3,515,605 0.0000% 0.0000% 0.0000% 0 0 01 7-May-80 BATTLE CREEK 7,101,883 0.0000% 0.0000% 0.0000% 0 0 01 22-Sep-80 BATTLE CREEK 613,309 0.0000% 0.0000% 0.0000% 0 0 01 2-Jun-82 BATTLE CREEK 250,000 0.0000% 0.0000% 0.0000% 0 0 01 17-Jan-83 Tehama Colusa Fish Facilities 538,720 0.0000% 0.0000% 0.0000% 0 0 01 18-Jan-83 Antelope Creek 805,420 0.0000% 0.0000% 0.0000% 0 0 01 4-Feb-83 BATTLE CREEK 1,136,090 0.0000% 0.0000% 0.0000% 0 0 01 28-Apr-83 BATTLE CREEK 3,114,000 0.0000% 0.0000% 0.0000% 0 0 01 3-May-83 CLEAR CREEK 200 0.0000% 0.0000% 0.0000% 0 0 01 4-May-83 BATTLE CREEK 3,671,312 0.0000% 0.0000% 0.0000% 0 0 056
ReleaseLocationCodeColeman National Fish Hatchery<strong>Merced</strong> Recovery RatesEscapementTotalNumberReleased Age 2 Age 3 Age 4 Age 2 Age 3 Age 4DateReleased Release Location1 15-Sep-83 BATTLE CREEK 441,178 0.0000% 0.0000% 0.0000% 0 0 01 1-Dec-82 Tehama Colusa Fish Facilities 799,200 0.0000% 0.0000% 0.0000% 0 0 01 28-Dec-82 Antelope Creek 219,040 0.0000% 0.0000% 0.0000% 0 0 02 18-Jan-83 Posse Grounds 2,101,920 0.0000% 0.0000% 0.0000% 0 0 02 23-Feb-83 Posse Grounds 545,720 0.0000% 0.0000% 0.0000% 0 0 02 24-May-83 RED BLUFF DIVER. DAM 1,173,350 0.0000% 0.0000% 0.0000% 0 0 01 23-Apr-84 BATTLE CREEK 1,787,312 0.0000% 0.0000% 0.0000% 0 0 01 10-Jul-84 BATTLE CREEK 19,480 0.0000% 0.0000% 0.0000% 0 0 02 26-Apr-84 RED BLUFF DIVER. DAM 300,000 0.0000% 0.0000% 0.0000% 0 0 02 3-May-84 RED BLUFF DIVER. DAM 564,450 0.0000% 0.0000% 0.0000% 0 0 01 25-Jan-85 BATTLE CREEK 169,040 0.0000% 0.0000% 0.0000% 0 0 01 8-Mar-85 CLEAR CREEK 199,280 0.0000% 0.0000% 0.0000% 0 0 01 11-Mar-85 Antelope Creek 201,770 0.0000% 0.0000% 0.0000% 0 0 01 12-Mar-85 Cow Creek 204,660 0.0000% 0.0000% 0.0000% 0 0 01 3-Apr-85 BATTLE CREEK 1,458,082 0.0000% 0.0000% 0.0000% 0 0 01 13-Jun-85 BATTLE CREEK 5,820 0.0000% 0.0000% 0.0000% 0 0 01 23-Nov-85 Tehama Colusa Fish Facilities 729,600 0.0000% 0.0000% 0.0000% 0 0 02 24-Jan-85 Posse Grounds 4,141,440 0.0000% 0.0000% 0.0000% 0 0 02 25-Jan-85 BALLS FERRY 656,640 0.0000% 0.0000% 0.0000% 0 0 02 25-Jan-85 North Street Bridge 2,937,600 0.0000% 0.0000% 0.0000% 0 0 02 1-Feb-85 BALLS FERRY 1,211,040 0.0000% 0.0000% 0.0000% 0 0 02 1-Feb-85 North Street Bridge 1,546,560 0.0000% 0.0000% 0.0000% 0 0 02 4-Feb-85 Posse Grounds 665,280 0.0000% 0.0000% 0.0000% 0 0 02 18-Apr-85 RED BLUFF DIVER. DAM 2,007,000 0.0000% 0.0000% 0.0000% 0 0 01 4-Apr-86 BATTLE CREEK 2,044,279 0.0000% 0.0000% 0.0000% 0 0 01 27-May-86 Tehama Colusa Fish Facilities 603,000 0.0000% 0.0000% 0.0000% 0 0 02 14-Apr-86 RED BLUFF DIVER. DAM 608,140 0.0000% 0.0000% 0.0000% 0 0 057
ReleaseLocationCodeColeman National Fish Hatchery<strong>Merced</strong> Recovery RatesEscapementTotalNumberReleased Age 2 Age 3 Age 4 Age 2 Age 3 Age 4DateReleased Release Location1 4-Feb-87 BATTLE CREEK 1,494,700 0.0000% 0.0000% 0.0000% 0 0 01 20-Apr-87 BATTLE CREEK 5,312,900 0.0000% 0.0000% 0.0000% 0 0 01 5-Jun-87 BATTLE CREEK 11,800 0.0000% 0.0000% 0.0000% 0 0 01 5-Apr-88 Tehama Colusa Fish Facilities 1,157,100 0.0000% 0.0000% 0.0000% 0 0 01 11-Apr-88 BATTLE CREEK 514,910 0.0000% 0.0000% 0.0000% 0 0 01 22-Dec-87 BATTLE CREEK 507,000 0.0000% 0.0000% 0.0000% 0 0 02 4-Jan-88 North Street Bridge 4,500,719 0.0000% 0.0000% 0.0000% 0 0 02 16-Feb-88 North Street Bridge 959,666 0.0000% 0.0000% 0.0000% 0 0 02 1-Apr-88 RED BLUFF DIVER. DAM 725,187 0.0000% 0.0000% 0.0000% 0 0 01 16-Feb-89 Stillwater Creek 200,000 0.0000% 0.0000% 0.0000% 0 0 01 17-Feb-89 Anderson Creek 100,500 0.0000% 0.0000% 0.0000% 0 0 01 28-Mar-89 BATTLE CREEK 53,950 0.0000% 0.0000% 0.0000% 0 0 02 3-Feb-89 RED BLUFF DIVER. DAM 5,678,534 0.0000% 0.0000% 0.0000% 0 0 02 6-Mar-89 BALLS FERRY 3,824,520 0.0000% 0.0000% 0.0000% 0 0 02 23-Mar-89 RED BLUFF DIVER. DAM 684,193 0.0000% 0.0000% 0.0000% 0 0 01 30-Mar-90 BATTLE CREEK 769,343 0.0000% 0.0000% 0.0000% 0 0 02 5-Mar-90 Sacramento River 3,919,302 0.0000% 0.0000% 0.0000% 0 0 03.2 13-May-90 BENICIA 5,608,310 0.0000% 0.0000% 0.0000% 0 0 01 26-Feb-91 BATTLE CREEK 200,018 0.0000% 0.0000% 0.0000% 0 0 01 28-Feb-91 BATTLE CREEK 680,214 0.0000% 0.0000% 0.0000% 0 0 01 30-Oct-90 FEATHER RIVER 719,186 0.0000% 0.0000% 0.0000% 0 0 01 1-Nov-90 FEATHER RIVER 540,750 0.0000% 0.0000% 0.0000% 0 0 02 28-Feb-91 Anderson River Park 550,045 0.0000% 0.0000% 0.0000% 0 0 02 28-Feb-91 BALLS FERRY 672,559 0.0000% 0.0000% 0.0000% 0 0 02 28-Feb-91 BEND BRIDGE 307,819 0.0000% 0.0000% 0.0000% 0 0 02 28-Feb-91 Posse Grounds 324,679 0.0000% 0.0000% 0.0000% 0 0 02 28-Feb-91 Sacramento River, ACID Dam 271,156 0.0000% 0.0000% 0.0000% 0 0 058
ReleaseLocationCodeColeman National Fish Hatchery<strong>Merced</strong> Recovery RatesEscapementTotalNumberReleased Age 2 Age 3 Age 4 Age 2 Age 3 Age 4DateReleased Release Location2 1-Mar-91 Woodson Bridge 666,834 0.0000% 0.0000% 0.0000% 0 0 02 22-Apr-91 Sacramento River, Princeton 6,349,775 0.0000% 0.0000% 0.0000% 0 0 03.2 29-Apr-91 BENICIA 901,820 0.0000% 0.0027% 0.0027% 0 25 243.2 5-May-91 BENICIA 5,049,448 0.0000% 0.0028% 0.0027% 0 142 1371 23-Mar-92 BATTLE CREEK 10,234 0.0000% 0.0000% 0.0000% 0 0 01 23-Mar-93 BATTLE CREEK 3,460,081 0.0000% 0.0000% 0.0000% 0 0 02 13-Feb-92 RED BLUFF DIVER. DAM 4,761,200 0.0000% 0.0000% 0.0000% 0 0 01 23-Mar-93 BATTLE CREEK 3,460,081 0.0000% 0.0000% 0.0000% 0 0 01 10-Mar-94 BATTLE CREEK 419 0.0000% 0.0000% 0.0000% 0 0 02 7-Feb-94 RED BLUFF DIVER. DAM 3,336,597 0.0000% 0.0000% 0.0000% 0 0 01 23-Mar-95 BATTLE CREEK 474,846 0.0000% 0.0000% 0.0000% 0 0 02 13-Feb-95 RED BLUFF DIVER. DAM 1,482,415 0.0000% 0.0000% 0.0000% 0 0 02 14-Mar-95 BALLS FERRY 1,317,557 0.0000% 0.0000% 0.0000% 0 0 02 29-Jan-96 RED BLUFF DIVER. DAM 1,319,814 0.0000% 0.0000% 0.0000% 0 0 02 8-Feb-96 RED BLUFF DIVER. DAM 5,222,300 0.0000% 0.0000% 0.0000% 0 0 02 5-Mar-96 RED BLUFF DIVER. DAM 1,001,507 0.0000% 0.0000% 0.0000% 0 0 02 20-Feb-97 Bow River Boat Ramp 3,097,705 0.0000% 0.0000% 0.0000% 0 0 0Sacramento River -HuntersMHP 1,970,072 0.0000% 0.0000% 0.0000% 0 0 02 4-Feb-972 4-Mar-97 Bow River Boat Ramp 2,915,824 0.0000% 0.0000% 0.0000% 0 0 02 4-Feb-98 Below RBDD 8,203,920 0.0000% 0.0000% 0.0000% 0 0 01 9-Apr-99 BATTLE CREEK 3,510 0.0000% 0.0000% 0.0000% 0 0 01 28-Apr-99 CNFH 478,047 0.0000% 0.0000% 0.0000% 0 0 02 29-Jan-99 Bow River Boat Ramp 384,882 0.0000% 0.0000% 0.0000% 0 0 0Los Molinos, below river boatramp 755,073 0.0000% 0.0000% 0.0000% 0 0 02 29-Jan-992 29-Jan-99 Woodson Bridge 370,191 0.0000% 0.0000% 0.0000% 0 0 02 26-Feb-99 Los Molinos, below river boat 3,000 0.0000% 0.0000% 0.0000% 0 0 059
Coleman National Fish Hatchery<strong>Merced</strong> Recovery RatesEscapementReleaseLocationCodeDateReleased Release LocationTotalNumberReleased Age 2 Age 3 Age 4 Age 2 Age 3 Age 4ramp2 9-Mar-99Los Molinos, below river boatramp 3,000 0.0000% 0.0000% 0.0000% 0 0 02 26-Mar-99Los Molinos, below river boatramp 3,000 0.0000% 0.0000% 0.0000% 0 0 02 15-Apr-99Los Molinos, below river boatramp 3,000 0.0000% 0.0000% 0.0000% 0 0 02 6-May-99Los Molinos, below river boatramp 3,100 0.0000% 0.0000% 0.0000% 0 0 02 26-Feb-99Los Molinos, below river boatramp 3,000 0.0000% 0.0000% 0.0000% 0 0 02 9-Mar-99Los Molinos, below river boatramp 3,000 0.0000% 0.0000% 0.0000% 0 0 02 26-Mar-99Los Molinos, below river boatramp 3,000 0.0000% 0.0000% 0.0000% 0 0 02 22-Mar-00 ABOVE RED BLUFF DAM 9,932 0.0000% 0.0000% 0.0000% 0 0 02 15-Apr-99Los Molinos, below river boatramp 3,000 0.0000% 0.0000% 0.0000% 0 0 02 4-Apr-00Los Molinos, below river boatramp 1,150 0.0000% 0.0000% 0.0000% 0 0 01 4-Apr-03 CNFH 1,685,414 0.0000% 0.0000% 0.0000% 0 0 01 18-Apr-03 CNFH 5,214,104 0.0000% 0.0000% 0.0000% 0 0 01 24-Apr-03 CNFH 3,588,184 0.0000% 0.0000% 0.0000% 0 0 01 25-Apr-03 CNFH 3,349,443 0.0000% 0.0000% 0.0000% 0 0 01 16-Apr-04 BATTLE CREEK 5,477,399 0.0000% 0.0000% 0.0000% 0 0 01 16-Apr-04 CNFH 5,477,399 0.0000% 0.0000% 0.0000% 0 0 01 23-Apr-04 BATTLE CREEK 6,614,040 0.0000% 0.0000% 0.0000% 0 0 01 23-Apr-04 CNFH 6,614,040 0.0000% 0.0000% 0.0000% 0 0 01 15-Apr-05 CNFH 6,097,731 0.0000% 0.0000% 0.0000% 0 0 01 29-Apr-05 CNFH 5,609,155 0.0000% 0.0000% 0.0000% 0 0 060
ReleaseLocationCodeFeather River Fish Hatchery<strong>Merced</strong> Recovery RatesEscapementTotalNumberReleased Age 2 Age 3 Age 4 Age 2 Age 3 Age 4DateReleasedRelease Location1 1-Feb-78 FRH 217,600 0 0 01 1-Oct-78 VERONA 57,200 0 0 01 1-Nov-78 Tehama Colusa Fish Facilities 76,175 0 0 01 1-Nov-78 VERONA 110,000 0 0 01 1-Nov-78 YUBA RIVER 104,260 0 0 01 1-Dec-78 FRH 27,500 0 0 01 1-Dec-78 Tehama Colusa Fish Facilities 401,265 0 0 01 1-Dec-78 VERONA 261,045 0 0 01 1-Dec-78 YUBA RIVER 300,525 0 0 02 1-Apr-78 RIO VISTA 100,480 0 0 02 1-May-78 RIO VISTA 744,240 0 0 02 1-Jun-78 RIO VISTA 820,540 0 0 02 1-Nov-78 RED BLUFF DIVER. DAM 157,500 0 0 02 1-Dec-78 RED BLUFF DIVER. DAM 42,100 0 0 03.2 1-Jun-78 TIBURON NET PENS 150,500 0.0000% 0.0000% 0 0 01 1-Jun-79 VERONA 131,300 0 0 01 1-Oct-79 FRH 1,678,903 0 0 01 1-Dec-79 FRH 342,412 0 0 02 1-May-79 RIO VISTA 339,400 0 0 02 1-Jun-79 RIO VISTA 1,226,200 0 0 02 1-Jul-79 RIO VISTA 610,650 0 0 03.2 1-Aug-79 TIBURON NET PENS 35,950 0.0000% 0.0000% 0 0 01 1-Jan-81 FRH 129,370 0 0 01 1-Jan-81 VERONA 11,050 0 0 01 1-Jun-80 FRH 50,000 0 0 01 1-Jun-80 YUBA RIVER 106,610 0 0 061
ReleaseLocationCodeFeather River Fish Hatchery<strong>Merced</strong> Recovery RatesEscapementTotalNumberReleased Age 2 Age 3 Age 4 Age 2 Age 3 Age 4DateReleasedRelease Location1 1-Jul-80 FRH 62,836 0 0 01 1-Jul-80 Nelson Bar 0 0 0 01 1-Oct-80 FRH 1,652,592 0 0 02 1-Jan-81 RIO VISTA 13,600 0 0 02 1-May-80 RIO VISTA 465,325 0 0 02 1-Jun-80 RIO VISTA 323,450 0 0 02 1-Jul-80 RIO VISTA 373,000 0 0 03.2 1-Jul-80 CARQUINEZ STRAIT 42,000 0.0000% 0.0029% 0.0000% 0 1 01 1-Feb-81 FRH 0 0 0 01 1-Oct-81 FRH 1,330,900 0 0 01 1-Nov-81 FRH 124,100 0 0 03.2 1-May-81 BENICIA 793,981 0.0000% 0.0066% 0.0000% 0 52 03.2 1-Jun-81 BENICIA 1,339,600 0.0000% 0.0064% 0.0000% 0 86 03.2 1-Jul-81 BENICIA 814,600 0.0000% 0.0067% 0.0000% 0 55 03.2 1-Aug-81 BENICIA 343,850 0.0000% 0.0075% 0.0000% 0 26 03.2 1-Sep-81 BENICIA 190,510 0.0000% 0.0000% 0.0000% 0 0 01 1-Jan-82 Antelope Creek 633,600 0 0 01 1-Jan-82 FRH 307,380 0 0 01 1-Feb-82 FRH 896,000 0 0 01 1-Mar-82 FRH 2,068,640 0 0 01 1-Sep-82 FRH 119,884 0 0 01 1-Oct-82 FRH 824,985 0 0 01 1-Nov-82 FRH 518,200 0 0 01 1-Dec-81 FRH 808,640 0 0 03.2 1-Apr-82 BENICIA 860,900 0.0000% 0.0010% 0.0000% 0 9 03.2 1-May-82 BENICIA 609,150 0.0000% 0.0011% 0.0000% 0 7 03.2 1-Jun-82 BENICIA 1,220,200 0.0000% 0.0011% 0.0000% 0 13 062
ReleaseLocationCodeFeather River Fish Hatchery<strong>Merced</strong> Recovery RatesEscapementTotalNumberReleased Age 2 Age 3 Age 4 Age 2 Age 3 Age 4DateReleasedRelease Location3.2 1-Jul-82 BENICIA 173,600 0.0000% 0.0011% 0.0000% 0 2 03.2 1-Aug-82 BENICIA 256,425 0.0000% 0.0014% 0.0000% 0 4 03.2 1-Sep-82 BENICIA 34,300 0.0000% 0.0000% 0.0000% 0 0 01 1-Jan-83 Honcut Creek 100,485 0 0 01 1-Jan-83 Stony Creek 185,900 0 0 01 1-Feb-83 FEATHER RIVER 2,558,400 0 0 01 1-Sep-83 FRH 0 0 0 01 1-Oct-83 FRH 1,267,916 0 0 02 1-Aug-83 RIO VISTA 36,000 0 0 03.2 1-Jun-83 BENICIA 743,200 0.0000% 0.0007% 0.0000% 0 5 03.2 1-Jul-83 BENICIA 599,700 0.0000% 0.0007% 0.0000% 0 4 03.2 1-Jul-83 TIBURON NET PENS 49,300 0.0000% 0.0007% 0.0000% 0 0 03.2 1-Jul-83 Vallejo 48,600 0.0000% 0.0007% 0.0000% 0 0 03.2 1-Aug-83 TIBURON NET PENS 48,000 0.0000% 0.0007% 0.0000% 0 0 03.2 1-Aug-83 Vallejo 44,800 0.0000% 0.0009% 0.0000% 0 0 03.2 1-Sep-83 Vallejo 42,700 0.0286% 0.0864% 0.0231% 12 37 103.2 1-Oct-83 TIBURON NET PENS 44,200 0.0286% 0.0864% 0.0231% 13 38 101 1-Jan-84 FRH 648,000 0 0 01 1-Feb-84 Antelope Creek 0 0 0 01 1-Feb-84 BUTTE CREEK 0 0 0 01 1-Feb-84 Chico Creek 0 0 0 01 1-Feb-84 FRH 0 0 0 01 1-Mar-84 FRH 214,200 0 0 01 1-Jun-84 FEATHER RIVER 0 0 0 02 1-Jun-84 COURTLAND 66,600 0 0 02 1-Jun-84 Glen-Colusa 0 0 0 02 1-Jun-84 Guisti 62,300 0 0 063
ReleaseLocationCodeFeather River Fish Hatchery<strong>Merced</strong> Recovery RatesEscapementTotalNumberReleased Age 2 Age 3 Age 4 Age 2 Age 3 Age 4DateReleasedRelease Location2 1-Jun-84 RYDE-KOKET 61,600 0 0 03.1 1-Jun-84 PALM TRACT 67,600 0 0 03.1 1-Jun-84 Whimpy's 59,250 0 0 03.2 1-Mar-84 BENICIA 0 0 0 03.2 1-May-84 BENICIA 0 0.0000% 0.0000% 0.0000% 0 0 03.2 1-Jun-84 BENICIA 63,000 0.0000% 0.0000% 0.0000% 0 0 03.2 1-Jun-84 PORT CHICAGO 44,100 0.0000% 0.0000% 0.0000% 0 0 03.2 1-Jun-84 Vallejo 42,750 0.0000% 0.0000% 0.0000% 0 0 03.2 1-Jul-84 BENICIA 634,550 0.0000% 0.0000% 0.0000% 0 0 03.2 1-Aug-84 BENICIA 1,051,175 0.0000% 0.0000% 0.0000% 0 0 03.2 1-Aug-84 Berkeley Marina 230,200 0.0000% 0.0000% 0.0000% 0 0 03.2 1-Sep-84 BENICIA 476,650 0.0000% 0.0000% 0.0000% 0 0 03.2 1-Sep-84 Berkeley Marina 100,200 0.0000% 0.0000% 0.0000% 0 0 01 1-Jan-85 FEATHER RIVER 182,400 0 0 01 1-Feb-85 Bear River 100,800 0 0 01 1-May-85 FEATHER RIVER 22,000 0 0 01 1-May-85 MOKELUMNE RIVER 106,240 0 0 02 1-May-85 COURTLAND 105,400 0 0 02 1-May-85 Glen-Colusa 10,034 0 0 02 1-May-85 RYDE-KOKET 95,000 0 0 03.1 1-May-85 PALM TRACT 105,240 0 0 03.1 1-May-85 Whimpy's 104,720 0 0 03.2 1-Apr-85 BENICIA 943,050 0.0000% 0.0015% 0.0000% 0 14 03.2 1-May-85 BENICIA 479,077 0.0000% 0.0016% 0.0000% 0 8 03.2 1-May-85 Berkeley Marina 52,700 0.0000% 0.0015% 0.0000% 0 1 03.2 1-May-85 PORT CHICAGO 53,100 0.0000% 0.0015% 0.0000% 0 1 03.2 1-Jun-85 BENICIA 465,500 0.0000% 0.0016% 0.0000% 0 7 064
ReleaseLocationCodeFeather River Fish Hatchery<strong>Merced</strong> Recovery RatesEscapementTotalNumberReleased Age 2 Age 3 Age 4 Age 2 Age 3 Age 4DateReleasedRelease Location3.2 1-Jun-85 TIBURON NET PENS 28,500 0.0000% 0.0019% 0.0000% 0 1 03.2 1-Jul-85 BENICIA 2,412,575 0.0000% 0.0018% 0.0000% 0 43 03.2 1-Aug-85 BENICIA 2,190,825 0.0000% 0.0020% 0.0000% 0 44 03.2 1-Sep-85 BENICIA 1,718,380 0.0000% 0.0000% 0.0000% 0 0 03.2 1-Oct-85 BENICIA 112,800 0.0000% 0.0000% 0.0000% 0 0 01 1-Feb-86 AMERICANR-COON CREEK 24,000 0 0 01 1-Feb-86 Auburn Ravine Creek 24,000 0 0 01 1-Feb-86 Bear River 79,200 0 0 01 1-Feb-86 Doty Ravine Creek 24,000 0 0 01 1-Feb-86 Dry Creek 84,000 0 0 01 1-Feb-86 Secret Ravine Creek 24,000 0 0 01 1-Apr-86 FEATHER RIVER 14,400 0 0 01 1-May-86 FEATHER RIVER 8,400 0 0 01 1-Oct-86 FEATHER RIVER 1,451,450 0 0 03.2 1-May-86 BENICIA 573,750 0.0000% 0.0018% 0.0000% 0 10 03.2 1-Jun-86 BENICIA 313,200 0.0000% 0.0019% 0.0000% 0 6 03.2 1-Jun-86 TIBURON NET PENS 50,000 0.0000% 0.0020% 0.0000% 0 1 03.2 1-Jul-86 BENICIA 1,136,800 0.0000% 0.0021% 0.0000% 0 23 03.2 1-Aug-86 SF-San Francisco Bay 1,829,275 0.0000% 0.0024% 0.0000% 0 44 03.2 1-Sep-86 SF-San Francisco Bay 686,150 0.0000% 0.0000% 0.0000% 0 0 01 1-Jan-87 AMERICANR-COON CREEK 24,640 0 0 01 1-Jan-87 Auburn Ravine Creek 50,400 0 0 01 1-Jan-87 Bear River 101,376 0 0 01 1-Jan-87 Doty Ravine Creek 49,280 0 0 01 1-Jan-87 Dry Creek 75,040 0 0 01 1-Jan-87 Secret Ravine Creek 100,000 0 0 01 1-Oct-87 GRIDLEY 552,975 0 0 065
ReleaseLocationCodeFeather River Fish Hatchery<strong>Merced</strong> Recovery RatesEscapementTotalNumberReleased Age 2 Age 3 Age 4 Age 2 Age 3 Age 4DateReleasedRelease Location3.2 1-Apr-87 BENICIA 821,300 0.0000% 0.0000% 0.0000% 0 0 03.2 1-May-87 BENICIA 926,500 0.0000% 0.0000% 0.0000% 0 0 03.2 1-Jun-87 BENICIA 2,382,800 0.0000% 0.0000% 0.0000% 0 0 03.2 1-Jul-87 BENICIA 2,477,075 0.0000% 0.0000% 0.0000% 0 0 03.2 1-Aug-87 BENICIA 1,860,400 0.0000% 0.0000% 0.0000% 0 0 03.2 1-Sep-87 BENICIA 435,850 0.0000% 0.0000% 0.0000% 0 0 01 1-Feb-88 Chico Creek 0 0 0 03.2 1-Mar-88 BENICIA 129,200 0 0 03.2 1-Apr-88 BENICIA 827,600 0.0000% 0.0000% 0.0000% 0 0 03.2 1-Apr-88 Berkeley Marina 0 0.0000% 0.0000% 0.0000% 0 0 03.2 1-May-88 BENICIA 704,850 0.0000% 0.0000% 0.0000% 0 0 03.2 1-Jun-88 BENICIA 1,525,450 0.0000% 0.0000% 0.0000% 0 0 03.2 1-Jun-88 TIBURON NET PENS 50,050 0.0000% 0.0000% 0.0000% 0 0 03.2 1-Jul-88 BENICIA 2,701,750 0.0000% 0.0000% 0.0000% 0 0 03.2 1-Aug-88 BENICIA 1,595,220 0.0000% 0.0000% 0.0000% 0 0 03.2 1-Sep-88 BENICIA 109,000 0.0000% 0.0000% 0.0000% 0 0 01 1-Jan-89 AMERICANR-COON CREEK 100,678 0 0 01 1-Jan-89 Auburn Ravine Creek 100,678 0 0 01 1-Jan-89 Bear Creek 100,678 0 0 01 1-Jan-89 Chico Creek 0 0 0 01 1-Jan-89 Dry Creek 194,072 0 0 01 1-Jan-89 FEATHER RIVER 371,800 0 0 01 1-Jan-89 Miners Ravine Creek 100,678 0 0 01 1-Jan-89 Secret Ravine Creek 100,678 0 0 01 1-Feb-89 MOKELUMNE R FISH INS 0 0 0 01 1-Apr-89 FEATHER RIVER 0 0 0 01 1-Apr-89 GRIDLEY 743,450 0 0 066
ReleaseLocationCodeFeather River Fish Hatchery<strong>Merced</strong> Recovery RatesEscapementTotalNumberReleased Age 2 Age 3 Age 4 Age 2 Age 3 Age 4DateReleasedRelease Location1 1-Dec-88 Chico Creek 0 0 0 01 1-Dec-88 FEATHER RIVER 538,400 0 0 02 1-Jan-89 Sac River, Colusa Drain 600,320 0 0 02 1-Jun-89 Sacramento River 0 0 0 03.2 1-Apr-89 BENICIA 685,500 0.0000% 0.0000% 0.0010% 0 0 73.2 1-May-89 BENICIA 537,000 0.0000% 0.0000% 0.0010% 0 0 53.2 1-Jun-89 BENICIA 972,100 0.0000% 0.0000% 0.0010% 0 0 103.2 1-Jun-89 TIBURON NET PENS 43,500 0.0000% 0.0000% 0.0010% 0 0 03.2 1-Jul-89 BENICIA 911,400 0.0000% 0.0000% 0.0010% 0 0 93.2 1-Aug-89 BENICIA 1,075,900 0.0000% 0.0000% 0.0010% 0 0 111 1-Mar-90 GRIDLEY 1,508,250 0 0 01 1-Apr-90 GRIDLEY 935,195 0 0 02 1-May-90 Hamilton City 10,200 0 0 03.2 1-May-90 BENICIA 882,000 0.0000% 0.0000% 0.0000% 0 0 03.2 1-Jun-90 BENICIA 3,414,050 0.0000% 0.0000% 0.0000% 0 0 03.2 1-Jun-90 TIBURON NET PENS 4,800 0.0000% 0.0000% 0.0000% 0 0 03.2 1-Jul-90 BENICIA 1,214,800 0.0000% 0.0000% 0.0000% 0 0 03.2 1-Aug-90 BENICIA 1,449,650 0.0000% 0.0000% 0.0000% 0 0 03.2 1-Sep-90 BENICIA 549,200 0.0000% 0.0000% 0.0000% 0 0 01 1-Feb-91 CLEAR CREEK 0 0 0 01 1-Mar-91 CLEAR CREEK 0 0 0 03.2 1-Apr-91 BENICIA 52,000 0.0000% 0.0032% 0.0027% 0 2 13.2 1-May-91 BENICIA 1,401,260 0.0000% 0.0033% 0.0027% 0 47 383.2 1-Jun-91 BENICIA 1,229,850 0.0000% 0.0039% 0.0027% 0 48 333.2 1-Jun-91 TIBURON NET PENS 55,900 0.0000% 0.0039% 0.0027% 0 2 23.2 1-Jul-91 BENICIA 1,245,850 0.0000% 0.0044% 0.0027% 0 55 343.2 1-Aug-91 BENICIA 1,235,085 0.0000% 0.0054% 0.0027% 0 67 3367
ReleaseLocationCodeFeather River Fish Hatchery<strong>Merced</strong> Recovery RatesEscapementTotalNumberReleased Age 2 Age 3 Age 4 Age 2 Age 3 Age 4DateReleasedRelease Location1 1-Jan-92 FEATHER RIVER 1,400,000 0 0 01 1-Mar-92 FEATHER RIVER 1,655,440 0 0 01 1-Apr-92 FEATHER RIVER 768,995 0 0 03.2 1-May-92 BENICIA 1,639,350 0.0000% 0.0010% 0.0000% 0 16 03.2 1-Jun-92 BENICIA 1,314,900 0.0000% 0.0010% 0.0000% 0 13 03.2 1-Jul-92 BENICIA 1,634,100 0.0000% 0.0012% 0.0000% 0 19 03.2 1-Aug-92 BENICIA 1,186,400 0.0000% 0.0016% 0.0000% 0 19 03.2 1-Sep-92 BENICIA 443,100 0.0000% 0.0000% 0.0000% 0 0 03.2 1-Oct-92 BENICIA 276,160 0.0000% 0.0000% 0.0000% 0 0 01 1-Jan-93 FEATHER RIVER 1,920,000 0 0 01 1-Feb-93 Dry Creek 275,200 0 0 01 1-Feb-93 FEATHER RIVER 160,000 0 0 01 1-Mar-93 Bear River 200,000 0 0 01 1-Mar-93 Honcut Creek 151,000 0 0 02 1-Jun-93 Grimes 4,615 0 0 03.2 1-May-93 BENICIA 1,836,000 0.0000% 0.0017% 0.0000% 0 32 03.2 1-May-93 TIBURON NET PENS 54,000 0.0000% 0.0020% 0.0000% 0 1 03.2 1-Jun-93 BENICIA 3,077,270 0.0000% 0.0018% 0.0000% 0 56 03.2 1-Jul-93 BENICIA 1,848,518 0.0000% 0.0020% 0.0000% 0 37 03.2 1-Aug-93 BENICIA 2,615,660 0.0000% 0.0026% 0.0000% 0 68 03.2 1-Sep-93 BENICIA 309,500 0.0000% 0.0027% 0.0000% 0 8 01 1-Jan-94 Dry Creek 302,400 0 0 01 1-Jan-94 FEATHER RIVER 4,995,200 0 0 01 1-Jan-94 Honcut Creek 304,200 0 0 01 1-Feb-94 FEATHER RIVER 0 0 0 01 1-Mar-94 Bear River 62,400 0 0 01 1-Mar-94 FEATHER RIVER 120,000 0 0 068
ReleaseLocationCodeFeather River Fish Hatchery<strong>Merced</strong> Recovery RatesEscapementTotalNumberReleased Age 2 Age 3 Age 4 Age 2 Age 3 Age 4DateReleasedRelease Location1 1-Dec-93 FEATHER RIVER 264,000 0 0 02 1-Jul-94 Sacramento River 0 0 0 03.2 1-Apr-94 BENICIA 712,642 0.0021% 0.0023% 0.0001% 15 16 13.2 1-May-94 BENICIA 2,632,217 0.0021% 0.0024% 0.0001% 56 62 33.2 1-Jun-94 BENICIA 1,548,320 0.0021% 0.0025% 0.0001% 33 39 23.2 1-Jun-94 TIBURON NET PENS 51,150 0.0021% 0.0028% 0.0001% 1 1 03.2 1-Jun-94 WICKLAND OIL NET PEN 0 0.0021% 0.0019% 0.0001% 0 0 03.2 1-Jul-94 BENICIA 250,400 0.0021% 0.0026% 0.0001% 5 7 0San Francisco Bay, San Yerba Buena NavalYard 627,000 0.0021% 0.0027% 0.0001% 13 17 13.2 1-Jul-943.2 1-Jul-94 WICKLAND OIL NET PEN 518,300 0.0021% 0.0026% 0.0001% 11 14 11 1-Jan-95 FEATHER RIVER 674,786 0 0 01 1-Feb-95 FEATHER RIVER 3,142,258 0 0 01 1-Feb-95 Honcut Creek 304,290 0 0 01 1-Mar-95 Bear River 100,050 0 0 01 1-Mar-95 Dry Creek 200,100 0 0 01 1-Mar-95 FEATHER RIVER 969,275 0 0 01 1-May-95 FEATHER RIVER 0 0 0 01 1-May-95 Princeton 25,200 0 0 01 1-May-95 Walnut Ave 20,008 0 0 01 1-Jun-95 Feather (Tisdale Weir) 26,400 0 0 01 1-Jun-95 Feather (Yuba City) 45,500 0 0 01 1-Jun-95 Princeton 75,000 0 0 02 1-Apr-95 Georgiana Slough 17,160 0 0 02 1-May-95 Georgiana Slough 12,000 0 0 02 1-May-95 MILLER PARK 5,000 0 0 02 1-May-95 Sacramento River 30,000 0 0 069
ReleaseLocationCodeFeather River Fish Hatchery<strong>Merced</strong> Recovery RatesEscapementTotalNumberReleased Age 2 Age 3 Age 4 Age 2 Age 3 Age 4DateReleasedRelease Location2 1-Jun-95 Grimes 125,000 0 0 03.2 1-Apr-95 BENICIA 269,152 0.0000% 0.0010% 0.0002% 0 3 03.2 1-May-95 BENICIA 396,952 0.0000% 0.0012% 0.0002% 0 5 1San Francisco Bay, San Yerba Buena NavalYard 103,400 0.0000% 0.0012% 0.0002% 0 1 03.2 1-May-953.2 1-May-95 WICKLAND OIL NET PEN 593,080 0.0000% 0.0011% 0.0002% 0 7 13.2 1-Jun-95 BENICIA 225,100 0.0000% 0.0012% 0.0002% 0 3 03.2 1-Jun-95 S.F. Bay-Oceangraph Ctr. 47,600 0.0000% 0.0013% 0.0002% 0 1 0San Francisco Bay, San Yerba Buena NavalYard 89,700 0.0000% 0.0012% 0.0002% 0 1 03.2 1-Jun-953.2 1-Jun-95 WICKLAND OIL NET PEN 907,432 0.0000% 0.0012% 0.0002% 0 11 23.2 1-Jul-94 WICKLAND OIL NET PEN 0 0.0000% 0.0009% 0.0002% 0 0 03.2 1-Jul-95 WICKLAND OIL NET PEN 1,544,975 0.0000% 0.0013% 0.0002% 0 19 31 1-Jan-96 FEATHER RIVER 156,000 0 0 01 1-Jan-96 Honcut Creek 101,401 0 0 01 1-Mar-96 Bear Creek 200,830 0 0 01 1-Mar-96 Dry Creek 96,600 0 0 01 1-Mar-96 FEATHER RIVER 652,000 0 0 01 1-May-96 FEATHER RIVER 25,000 0 0 02 1-Apr-96 San Joaquin River 5,000 0 0 02 1-Apr-96 Turner Cut 49,998 0 0 02 1-Apr-96 Vorden Rd 50,004 0 0 02 1-May-96 Turner Cut 25,024 0 0 02 1-May-96 Vorden Rd 150,011 0 0 02 1-Jun-96 Grimes 50,016 0 0 03.2 1-Apr-96 BENICIA 556,400 0.0000% 0.0006% 0.0000% 0 3 03.2 1-Apr-96 Bennett's Marina 0 0.0000% 0.0005% 0.0000% 0 0 03.2 1-Apr-96 WICKLAND OIL NET PEN 388,700 0.0000% 0.0006% 0.0000% 0 2 070
ReleaseLocationCodeFeather River Fish Hatchery<strong>Merced</strong> Recovery RatesEscapementTotalNumberReleased Age 2 Age 3 Age 4 Age 2 Age 3 Age 4DateReleasedRelease Location3.2 1-May-96 BENICIA 545,100 0.0000% 0.0006% 0.0000% 0 3 03.2 1-May-96 Bennett's Marina 0 0.0000% 0.0005% 0.0000% 0 0 03.2 1-May-96 Montezuma Slough 74,975 0.0000% 0.0006% 0.0000% 0 0 0San Francisco Bay, San Yerba Buena NavalYard 126,500 0.0000% 0.0006% 0.0000% 0 1 03.2 1-May-963.2 1-May-96 WICKLAND OIL NET PEN 527,850 0.0000% 0.0006% 0.0000% 0 3 03.2 1-Jun-96 BENICIA 0 0.0000% 0.0005% 0.0000% 0 0 03.2 1-Jun-96 TIBURON NET PENS 49,400 0.0000% 0.0005% 0.0000% 0 0 03.2 1-Jun-96 WICKLAND OIL NET PEN 203,200 0.0000% 0.0006% 0.0000% 0 1 0San Francisco Bay, San Yerba Buena NavalYard 73,364 0.0000% 0.0006% 0.0000% 0 0 03.2 1-Jul-963.2 1-Jul-96 WICKLAND OIL NET PEN 2,762,684 0.0000% 0.0006% 0.0000% 0 18 01 1-Mar-97 Dry Creek 100,037 0 0 03.2 1-May-97 BENICIA 25,200 0.0000% 0.0028% 0.0000% 0 1 03.2 1-May-97 TIBURON NET PENS 52,650 0.0000% 0.0030% 0.0000% 0 2 03.2 1-May-97 WICKLAND OIL NET PEN 36,830 0.0000% 0.0034% 0.0000% 0 1 03.2 1-Jun-97 BENICIA 252,500 0.0000% 0.0030% 0.0000% 0 8 03.2 1-Jun-97 Bennett's Marina 155,900 0.0000% 0.0030% 0.0000% 0 5 03.2 1-Jun-97 WICKLAND OIL NET PEN 787,300 0.0000% 0.0028% 0.0000% 0 22 03.2 1-Jul-97 Bennett's Marina 296,600 0.0000% 0.0028% 0.0000% 0 8 03.2 1-Jul-97 WICKLAND OIL NET PEN 3,177,450 0.0000% 0.0030% 0.0000% 0 94 01 1-Mar-98 Dry Creek 100,800 0 0 01 1-Mar-98 Honcut Creek 200,500 0 0 03.2 1-Mar-98 BENICIA 0 0 0 03.2 1-Mar-98 WICKLAND OIL NET PEN 0 0 0 03.2 1-May-98 WICKLAND OIL NET PEN 2,392,200 0.0000% 0.0009% 0.0000% 0 22 03.2 1-Jun-98 WICKLAND OIL NET PEN 1,243,900 0.0000% 0.0009% 0.0000% 0 12 01 1-Feb-99 Dry Creek 99,200 0 0 071
ReleaseLocationCodeFeather River Fish Hatchery<strong>Merced</strong> Recovery RatesEscapementTotalNumberReleased Age 2 Age 3 Age 4 Age 2 Age 3 Age 4DateReleasedRelease Location1 1-Feb-99 Honcut Creek 216,000 0 0 01 1-Mar-99 Bear River 199,800 0 0 03.2 1-May-99 SF-San Francisco Bay 791,670 0.0030% 0.0032% 0.0000% 24 26 03.2 1-Jun-99 BENICIA 0 0.0030% 0.0026% 0.0000% 0 0 03.2 1-Jun-99 SF-San Francisco Bay 4,933,865 0.0030% 0.0033% 0.0000% 149 164 01 1-Jan-00 Dry Creek 100,100 0.0030% 0.0007% 0.0000% 3 1 01 1-Jan-00 Honcut Creek 200,201 0 0 01 1-Mar-00 Bear River 199,876 0 0 03.2 1-Apr-00 BENICIA 0 0 0 03.2 1-May-00 BENICIA 0 0.0000% 0.0007% 0.0000% 0 0 03.2 1-May-00 SF-San Francisco Bay 3,409,040 0.0000% 0.0009% 0.0000% 0 31 03.2 1-Jun-00 BENICIA 486,100 0.0000% 0.0009% 0.0000% 0 4 03.2 1-Jun-00 SF-San Francisco Bay 1,541,150 0.0000% 0.0010% 0.0000% 0 15 03.2 1-Apr-01 SAN PABLO BAY 568,100 0.0136% 0.0031% 0.0019% 78 18 113.2 1-May-01 BENICIA 1,706,850 0.0136% 0.0032% 0.0019% 233 54 323.2 1-Jun-01 BENICIA 487,600 0.0136% 0.0032% 0.0019% 67 16 92 1-Apr-02 River mile 206 (GCID) 14,402 0 0 02 1-May-02 River mile 206 (GCID) 16,293 0 0 02 1-Jun-02 River mile 206 (GCID) 13,300 0 0 03.2 1-Mar-02 BENICIA 162,800 0 0 03.2 1-Apr-02 BENICIA 2,773,538 0.0024% 0.0020% 0.0007% 66 54 203.2 1-May-02 BENICIA 1,401,000 0.0024% 0.0021% 0.0007% 33 29 103.2 1-Jun-02 BENICIA 422,050 0.0024% 0.0021% 0.0007% 10 9 32 1-Mar-03 River mile 206 (GCID) 8,394 0.0024% 0.0012% 0.0007% 0 0 02 1-Apr-03 River mile 206 (GCID) 16,720 0 0 02 1-May-03 River mile 206 (GCID) 10,450 0 0 03.2 1-May-03 BENICIA 2,343,600 0.0009% 0.0015% 0.0000% 21 35 072
ReleaseLocationCodeFeather River Fish Hatchery<strong>Merced</strong> Recovery RatesEscapementTotalNumberReleased Age 2 Age 3 Age 4 Age 2 Age 3 Age 4DateReleasedRelease Location3.2 1-May-03 Bennett's Marina 904,000 0.0009% 0.0015% 0.0000% 8 13 03.2 1-Jun-03 BENICIA 1,703,160 0.0009% 0.0015% 0.0000% 15 25 03.2 1-Jun-03 SF-San Francisco Bay 133,400 0.0009% 0.0015% 0.0000% 1 2 01 1-Apr-04 Live Oak boat ramp 0 0 0 02 1-Apr-04 River mile 206 (GCID) 4,180 0 0 02 1-May-04 River mile 206 (GCID) 16,720 0 0 02 1-Jun-04 River mile 206 (GCID) 16,720 0 0 03.2 1-Apr-04 BENICIA 0 0 0 03.2 1-May-04 BENICIA 4,025,988 0.0000% 0.0015% 0.0000% 0 61 03.2 1-Jun-04 BENICIA 3,232,600 0.0000% 0.0018% 0.0000% 0 57 02 16-May-05 Sacramento River 53,122 0.0000% 0.0014% 0.0000% 0 1 03.2 26-Apr-05 SAN PABLO BAY 105,000 0 0 03.2 27-Apr-05 SAN PABLO BAY 127,500 0 0 03.2 28-Apr-05 SAN PABLO BAY 114,000 0 0 03.2 29-Apr-05 SAN PABLO BAY 72,000 0 0 03.2 4-May-05 SAN PABLO BAY 69,000 0 0 03.2 5-May-05 SAN PABLO BAY 107,300 0 0 03.2 6-May-05 SAN PABLO BAY 107,300 0 0 03.2 10-May-05 SAN PABLO BAY 295,400 0 0 03.2 11-May-05 SAN PABLO BAY 230,000 0 0 03.2 12-May-05 SAN PABLO BAY 230,000 0 0 03.2 16-May-05 SAN PABLO BAY 115,200 0 0 03.2 18-May-05 SAN PABLO BAY 358,800 0 0 03.2 19-May-05 SAN PABLO BAY 57,500 0 0 03.2 20-May-05 SAN PABLO BAY 112,700 0 0 03.2 23-May-05 SAN PABLO BAY 69,000 0 0 03.2 25-May-05 SAN PABLO BAY 239,200 0 0 073
ReleaseLocationCodeFeather River Fish Hatchery<strong>Merced</strong> Recovery RatesEscapementTotalNumberReleased Age 2 Age 3 Age 4 Age 2 Age 3 Age 4DateReleasedRelease Location3.2 26-May-05 SAN PABLO BAY 335,000 0 0 03.2 27-May-05 SAN PABLO BAY 250,700 0 0 03.2 3-Jun-05 SAN PABLO BAY 181,700 0 0 03.2 6-Jun-05 SAN PABLO BAY 345,000 0 0 03.2 7-Jun-05 SAN PABLO BAY 179,400 0 0 03.2 8-Jun-05 SAN PABLO BAY 278,300 0 0 03.2 9-Jun-05 SAN PABLO BAY 272,976 0 0 03.2 10-Jun-05 SAN PABLO BAY 289,800 0 0 03.2 13-Jun-05 SAN PABLO BAY 193,200 0 0 03.2 14-Jun-05 SAN PABLO BAY 193,200 0 0 03.2 15-Jun-05 SAN PABLO BAY 184,000 0 0 03.2 16-Jun-05 SAN PABLO BAY 151,800 0 0 03.2 17-Jun-05 SAN PABLO BAY 213,900 0 0 03.2 20-Jun-05 SAN PABLO BAY 142,600 0 0 03.2 21-Jun-05 SAN PABLO BAY 248,400 0 0 03.2 22-Jun-05 SAN PABLO BAY 231,992 0 0 03.2 23-Jun-05 SAN PABLO BAY 326,600 0 0 03.2 24-Jun-05 SAN PABLO BAY 213,900 0 0 03.2 27-Jun-05 SAN PABLO BAY 142,600 0 0 03.2 28-Jun-05 SAN PABLO BAY 173,600 0 0 03.2 29-Jun-05 SAN PABLO BAY 142,600 0 0 03.2 10-Apr-06 SAN PABLO BAY 1,909,000 0 0 03.2 3-May-06 SAN PABLO BAY 2,852,414 0 0 03.2 18-May-06 YERBA BUENA ISLAND 59,000 0 0 03.2 1-Jun-06 SAN PABLO BAY 3,871,900 0 0 03.2 8-Jun-06 YERBA BUENA ISLAND 57,000 0 0 074
ReleaseLocationCodeMokelumne River Fish Installation<strong>Merced</strong> Recovery Rates EscapementTotalNumberReleased Age 2 Age 3 Age 4 Age 2 Age 3 Age 4DateReleased Release Location1 1-Jan-79 MOKELUMNE RIVER 15,225 0.0000% 0.0000% 0.0000% 0 0 01 1-Oct-78 MOKELUMNE RIVER 32,908 0.0000% 0.0000% 0.0000% 0 0 01 1-Nov-78 MOKELUMNE RIVER 20,134 0.0000% 0.0000% 0.0000% 0 0 01 1-Dec-78 MOKELUMNE RIVER 10,000 0.0000% 0.0000% 0.0000% 0 0 02 1-Jan-79 RED BLUFF DIVER. DAM 51,700 0.0000% 0.0000% 0.0000% 0 0 02 1-Jan-79 RIO VISTA 75,000 0.0000% 0.0000% 0.0000% 0 0 02 1-Nov-78 RED BLUFF DIVER. DAM 47,304 0.0000% 0.0000% 0.0000% 0 0 02 1-Nov-78 RIO VISTA 102,076 0.0000% 0.0000% 0.0000% 0 0 02 1-Dec-78 RED BLUFF DIVER. DAM 191,800 0.0000% 0.0000% 0.0000% 0 0 03.1 1-Jan-79 NEW HOPE LANDING 108,000 0.0000% 0.0000% 0.0000% 0 0 01 1-Jul-79 MOKELUMNE R FISH INS 65,406 0.0000% 0.0000% 0.0000% 0 0 02 1-Oct-79 RIO VISTA 174,200 0.0000% 0.0648% 0.0000% 0 113 02 1-Nov-79 RIO VISTA 19,167 0.0000% 0.0648% 0.0000% 0 12 03.1 1-Aug-79 NEW HOPE LANDING 106,568 0.0130% 0.0055% 0.0000% 14 6 03.1 1-Sep-79 NEW HOPE LANDING 103,008 0.0000% 0.0000% 0.0000% 0 0 03.1 1-Oct-79 NEW HOPE LANDING 26,315 0.0000% 0.0000% 0.0000% 0 0 03.1 1-Nov-79 NEW HOPE LANDING 245,210 0.0000% 0.0000% 0.0000% 0 0 01 1-Nov-80 MOKELUMNE RIVER 50,000 0.0000% 0.0000% 0.0000% 0 0 02 1-Oct-80 RIO VISTA 672,750 0.0000% 0.0432% 0.0000% 0 291 02 1-Nov-80 RIO VISTA 88,500 0.0000% 0.0432% 0.0000% 0 38 02 1-Dec-80 RIO VISTA 40,700 0.0000% 0.0432% 0.0000% 0 18 03.1 1-Jun-80 NEW HOPE LANDING 105,050 0.0141% 0.0068% 0.0000% 15 7 03.1 1-Jul-80 NEW HOPE LANDING 25,800 0.0171% 0.0074% 0.0000% 4 2 03.1 1-Aug-80 NEW HOPE LANDING 90,000 0.0167% 0.0073% 0.0000% 15 7 03.1 1-Oct-80 NEW HOPE LANDING 20,000 0.0000% 0.0000% 0.0000% 0 0 02 1-Oct-81 RIO VISTA 264,743 0.0000% 0.0000% 0.0000% 0 0 02 1-Nov-81 RIO VISTA 586,905 0.0000% 0.0000% 0.0000% 0 0 02 1-Dec-81 RIO VISTA 56,200 0.0000% 0.0000% 0.0000% 0 0 075
ReleaseLocationCodeMokelumne River Fish Installation<strong>Merced</strong> Recovery Rates EscapementTotalNumberReleased Age 2 Age 3 Age 4 Age 2 Age 3 Age 4DateReleased Release Location3.1 1-Jun-81 NEW HOPE LANDING 167,034 0.0149% 0.0038% 0.0000% 25 6 03.1 1-Nov-81 NEW HOPE LANDING 72,000 0.0000% 0.0000% 0.0000% 0 0 03.1 1-Dec-81 NEW HOPE LANDING 30,030 0.0000% 0.0000% 0.0000% 0 0 01 1-Dec-82 MOKELUMNE RIVER 17,600 0.0000% 0.0000% 0.0000% 0 0 02 1-Nov-82 RIO VISTA 516,145 0.0000% 0.0000% 0.0000% 0 0 02 1-Dec-82 RIO VISTA 40,000 0.0000% 0.0000% 0.0000% 0 0 03.1 1-Nov-82 NEW HOPE LANDING 89,998 0.0000% 0.0000% 0.0000% 0 0 02 1-Oct-83 RIO VISTA 705,000 0.0000% 0.0000% 0.0000% 0 0 02 1-Nov-83 RIO VISTA 52,640 0.0000% 0.0000% 0.0000% 0 0 03.1 1-May-83 NEW HOPE LANDING 454,134 0.0195% 0.0038% 0.0000% 88 17 03.1 1-Oct-83 NEW HOPE LANDING 10,010 0.0000% 0.0000% 0.0000% 0 0 03.1 1-Jun-84 THORNTON-Moke 15,250 0.0115% 0.0046% 0.0000% 2 1 03.1 22-Aug-84 NEW HOPE LANDING 82,350 0.0124% 0.0047% 0.0000% 10 4 03.2 13-Aug-84 BENICIA 98,350 0.0189% 0.0430% 0.0149% 19 42 153.2 14-Aug-84 BENICIA 105,250 0.0189% 0.0430% 0.0149% 20 45 163.2 15-Aug-84 BENICIA 112,400 0.0189% 0.0430% 0.0149% 21 48 173.2 16-Aug-84 BENICIA 120,830 0.0189% 0.0430% 0.0149% 23 52 183.2 17-Aug-84 BENICIA 122,235 0.0189% 0.0430% 0.0149% 23 53 183.2 20-Aug-84 BENICIA 76,250 0.0189% 0.0430% 0.0149% 14 33 113.2 21-Aug-84 BENICIA 45,750 0.0189% 0.0430% 0.0149% 9 20 71 18-Oct-85 MOKELUMNE R FISH INS 24,200 0.0000% 0.0000% 0.0000% 0 0 01 21-Oct-85 MOKELUMNE R FISH INS 48,000 0.0000% 0.0000% 0.0000% 0 0 01 23-Oct-85 MOKELUMNE R FISH INS 122,400 0.0000% 0.0000% 0.0000% 0 0 02 9-Oct-85 RIO VISTA 27,300 0.0000% 0.0000% 0.0000% 0 0 03.2 11-Sep-85 BENICIA 24,000 0.0000% 0.0000% 0.0000% 0 0 03.2 12-Sep-85 BENICIA 24,000 0.0000% 0.0000% 0.0000% 0 0 03.2 16-Sep-85 BENICIA 26,000 0.0000% 0.0000% 0.0000% 0 0 03.2 17-Sep-85 BENICIA 23,100 0.0000% 0.0000% 0.0000% 0 0 03.2 18-Sep-85 BENICIA 23,100 0.0000% 0.0000% 0.0000% 0 0 076
ReleaseLocationCodeMokelumne River Fish Installation<strong>Merced</strong> Recovery Rates EscapementTotalNumberReleased Age 2 Age 3 Age 4 Age 2 Age 3 Age 4DateReleased Release Location3.2 19-Sep-85 BENICIA 27,300 0.0000% 0.0000% 0.0000% 0 0 03.2 20-Sep-85 BENICIA 13,000 0.0000% 0.0000% 0.0000% 0 0 03.2 24-Sep-85 BENICIA 13,300 0.0000% 0.0000% 0.0000% 0 0 03.2 25-Sep-85 BENICIA 27,930 0.0000% 0.0000% 0.0000% 0 0 03.2 26-Sep-85 BENICIA 48,400 0.0000% 0.0000% 0.0000% 0 0 03.2 27-Sep-85 BENICIA 46,200 0.0000% 0.0000% 0.0000% 0 0 03.2 30-Sep-85 BENICIA 33,600 0.0000% 0.0000% 0.0000% 0 0 03.2 1-Oct-85 BENICIA 51,200 0.0000% 0.0000% 0.0000% 0 0 03.2 2-Oct-85 BENICIA 100,800 0.0000% 0.0000% 0.0000% 0 0 03.2 3-Oct-85 BENICIA 103,700 0.0000% 0.0000% 0.0000% 0 0 03.2 4-Oct-85 BENICIA 159,800 0.0000% 0.0000% 0.0000% 0 0 03.2 7-Oct-85 BENICIA 92,400 0.0000% 0.0000% 0.0000% 0 0 03.2 8-Oct-85 BENICIA 93,800 0.0000% 0.0000% 0.0000% 0 0 03.2 9-Oct-85 BENICIA 59,800 0.0000% 0.0000% 0.0000% 0 0 03.2 10-Oct-85 BENICIA 74,100 0.0000% 0.0000% 0.0000% 0 0 03.2 11-Oct-85 BENICIA 28,600 0.0000% 0.0000% 0.0000% 0 0 03.2 17-Oct-85 BENICIA 24,200 0.0000% 0.0000% 0.0000% 0 0 03.2 18-Oct-85 BENICIA 35,200 0.0000% 0.0000% 0.0000% 0 0 03.2 21-Oct-85 BENICIA 44,200 0.0000% 0.0000% 0.0000% 0 0 03.2 22-Oct-85 BENICIA 42,000 0.0000% 0.0000% 0.0000% 0 0 01 1-Aug-86 MOKELUMNE R FISH INS 27,000 0.0000% 0.0000% 0.0000% 0 0 01 1-Sep-86 MOKELUMNE R FISH INS 35,200 0.0000% 0.0000% 0.0000% 0 0 01 1-Oct-86 MOKELUMNE R FISH INS 36,000 0.0000% 0.0000% 0.0000% 0 0 03.2 25-Jun-86 BENICIA 50,400 0.0000% 0.0000% 0.0000% 0 0 03.2 26-Jun-86 BENICIA 56,000 0.0000% 0.0000% 0.0000% 0 0 03.2 27-Jun-86 BENICIA 66,000 0.0000% 0.0000% 0.0000% 0 0 03.2 1-Jul-86 BENICIA 1,000,400 0.0000% 0.0000% 0.0000% 0 0 03.2 1-Aug-86 BENICIA 39,600 0.0000% 0.0000% 0.0000% 0 0 03.2 1-Aug-86 Bennett's Marina 39,600 0.0000% 0.0000% 0.0000% 0 0 077
ReleaseLocationCodeMokelumne River Fish Installation<strong>Merced</strong> Recovery Rates EscapementTotalNumberReleased Age 2 Age 3 Age 4 Age 2 Age 3 Age 4DateReleased Release Location3.2 1-Aug-86 Berkeley Marina 170,100 0.0000% 0.0000% 0.0000% 0 0 03.2 1-Sep-86 BENICIA 191,500 0.0000% 0.0000% 0.0000% 0 0 03.2 1-Sep-86 Bennett's Marina 50,600 0.0000% 0.0000% 0.0000% 0 0 03.2 1-Apr-87 BENICIA 601,665 0.0000% 0.0052% 0.0000% 0 31 03.2 1-May-87 BENICIA 398,700 0.0000% 0.0052% 0.0000% 0 21 03.2 1-Jun-87 BENICIA 467,950 0.0000% 0.0052% 0.0000% 0 24 03.2 1-Jun-87 Bennett's Marina 391,100 0.0000% 0.0052% 0.0000% 0 20 03.2 1-Jul-87 BENICIA 135,050 0.0000% 0.0052% 0.0000% 0 7 03.2 1-Jul-87 Mare Island 162,956 0.0000% 0.0052% 0.0000% 0 8 03.2 1-Aug-87 BENICIA 77,366 0.0000% 0.0052% 0.0000% 0 4 03.2 1-Apr-88 Berkeley Marina 524,500 0.0000% 0.0000% 0.0000% 0 0 03.2 1-May-88 BENICIA 316,300 0.0000% 0.0000% 0.0000% 0 0 03.2 1-May-88 Bennett's Marina 690,400 0.0000% 0.0000% 0.0000% 0 0 03.2 1-May-88 Berkeley Marina 638,400 0.0000% 0.0000% 0.0000% 0 0 03.2 1-Jun-88 BENICIA 133,300 0.0000% 0.0000% 0.0000% 0 0 01 1-Sep-89 MOKELUMNE RIVER 50,400 0.0000% 0.0000% 0.0000% 0 0 03.1 1-Apr-89 NEW HOPE LANDING 418,700 0.0000% 0.0000% 0.0000% 0 0 03.2 1-May-89 BENICIA 92,400 0.0000% 0.0000% 0.0000% 0 0 03.2 1-May-89 Bennett's Marina 896,800 0.0000% 0.0000% 0.0000% 0 0 03.2 1-Jun-89 Bennett's Marina 1,066,900 0.0000% 0.0000% 0.0000% 0 0 03.2 1-Jul-89 Bennett's Marina 476,700 0.0000% 0.0000% 0.0000% 0 0 03.2 1-Jul-89 Berkeley Marina 48,700 0.0000% 0.0000% 0.0000% 0 0 03.2 1-Aug-89 Bennett's Marina 761,800 0.0000% 0.0000% 0.0000% 0 0 03.2 1-Sep-89 Bennett's Marina 37,200 0.0000% 0.0000% 0.0000% 0 0 01 1-Apr-90 MOKELUMNE R FISH INS 20,800 0.0000% 0.0000% 0.0000% 0 0 01 1-Jun-90 Lodi Lake 4,000 0.0000% 0.0000% 0.0000% 0 0 03.1 1-Mar-90 NEW HOPE LANDING 350,600 0.0000% 0.0000% 0.0000% 0 0 03.2 1-Jun-90 BENICIA 649,825 0.0000% 0.0000% 0.0000% 0 0 03.2 1-Jun-90 Bennett's Marina 517,500 0.0000% 0.0000% 0.0000% 0 0 078
ReleaseLocationCodeMokelumne River Fish Installation<strong>Merced</strong> Recovery Rates EscapementTotalNumberReleased Age 2 Age 3 Age 4 Age 2 Age 3 Age 4DateReleased Release Location3.2 1-Jul-90 BENICIA 459,700 0.0000% 0.0000% 0.0000% 0 0 03.2 1-Jul-90 Bennett's Marina 650,500 0.0000% 0.0000% 0.0000% 0 0 03.2 1-Aug-90 Bennett's Marina 488,900 0.0000% 0.0000% 0.0000% 0 0 01 1-Mar-92 MOKELUMNE RIVER 6,000 0.0000% 0.0000% 0.0000% 0 0 01 1-May-91 Lodi Lake 25,200 0.0000% 0.0010% 0.0000% 0 0 01 1-Jun-91 Lodi Lake 13,000 0.0000% 0.0010% 0.0000% 0 0 01 1-Oct-91 MOKELUMNE R FISH INS 28,350 0.0000% 0.0000% 0.0000% 0 0 03.1 1-Apr-91 NEW HOPE LANDING 103,950 0.0000% 0.0000% 0.0000% 0 0 03.1 1-May-91 NEW HOPE LANDING 103,850 0.0000% 0.0000% 0.0000% 0 0 03.2 1-May-91 Bennett's Marina 821,400 0.0000% 0.0000% 0.0000% 0 0 03.2 1-Jun-91 Bennett's Marina 771,400 0.0000% 0.0000% 0.0000% 0 0 03.2 1-Jul-91 BENICIA 390,600 0.0000% 0.0000% 0.0000% 0 0 01 1-Oct-92 MOKELUMNE R FISH INS 131,552 0.0000% 0.0044% 0.0000% 0 6 02 1-Apr-92 RIO VISTA 472,840 0.0000% 0.0000% 0.0000% 0 0 03.1 1-Apr-92 Byron 36,050 0.0000% 0.0045% 0.0000% 0 2 03.1 1-Apr-92 NEW HOPE LANDING 0 0.0000% 0.0000% 0.0000% 0 0 03.1 1-May-92 NEW HOPE LANDING 0 0.0000% 0.0000% 0.0000% 0 0 03.2 1-Apr-92 BENICIA 39,000 0.0067% 0.0116% 0.0052% 3 5 23.2 1-May-92 BENICIA 967,537 0.0067% 0.0116% 0.0052% 65 113 503.2 1-Jun-92 BENICIA 1,091,873 0.0067% 0.0116% 0.0052% 73 127 573.2 1-Jul-92 BENICIA 1,164,100 0.0067% 0.0116% 0.0052% 78 135 613.2 1-Aug-92 BENICIA 213,800 0.0067% 0.0116% 0.0052% 14 25 111 1-Mar-93 MOKELUMNE RIVER 1,200 0.0000% 0.0000% 0.0000% 0 0 01 1-Apr-93 MOKELUMNE RIVER 5,440 0.0000% 0.0000% 0.0000% 0 0 01 1-May-93 MOKELUMNE RIVER 0 0.0000% 0.0000% 0.0000% 0 0 01 1-Jun-93 Woodbridge Dam 10,010 0.0000% 0.0000% 0.0000% 0 0 03.1 1-Apr-93 Byron 15,000 0.0123% 0.0028% 0.0005% 2 0 03.1 1-Oct-93 NEW HOPE LANDING 313,720 0.0000% 0.0000% 0.0000% 0 0 03.2 1-May-93 BENICIA 437,500 0.0092% 0.0204% 0.0083% 40 89 3679
ReleaseLocationCodeMokelumne River Fish Installation<strong>Merced</strong> Recovery Rates EscapementTotalNumberReleased Age 2 Age 3 Age 4 Age 2 Age 3 Age 4DateReleased Release Location3.2 1-Jun-93 BENICIA 1,547,500 0.0092% 0.0204% 0.0083% 143 315 1283.2 1-Jul-93 BENICIA 1,026,600 0.0092% 0.0204% 0.0083% 95 209 852 1-Jun-94 Sacramento River 514,350 0.0000% 0.0000% 0.0000% 0 0 03.1 1-May-94 NEW HOPE LANDING 149,820 0.0124% 0.0025% 0.0010% 19 4 13.1 1-Jun-94 NEW HOPE LANDING 5,167 0.0142% 0.0026% 0.0010% 1 0 03.2 1-May-94 BENICIA 136,800 0.0160% 0.0246% 0.0129% 22 34 183.2 1-Jun-94 BENICIA 1,107,570 0.0160% 0.0246% 0.0129% 177 272 1431 1-Sep-95 MOKELUMNE RIVER 275,110 0.0000% 0.0000% 0.0000% 0 0 01 1-Oct-95 MOKELUMNE RIVER 152,005 0.0000% 0.0000% 0.0000% 0 0 01 1-Feb-96 MOKELUMNE RIVER 3,165 0.0000% 0.0000% 0.0000% 0 0 01 1-Mar-96 MOKELUMNE RIVER 3,394 0.0000% 0.0000% 0.0000% 0 0 01 1-Apr-96 MOKELUMNE RIVER 590,956 0.0000% 0.0000% 0.0000% 0 0 01 1-May-96 MOKELUMNE RIVER 1,014 0.0000% 0.0000% 0.0000% 0 0 01 1-Oct-96 Woodbridge Dam 177,060 0.0135% 0.0000% 0.0000% 24 0 03.1 1-Jun-96 NEW HOPE LANDING 774,046 0.0049% 0.0069% 0.0000% 38 53 03.2 1-May-96 BENICIA 770,800 0.0044% 0.0131% 0.0046% 34 101 353.2 1-Jun-96 BENICIA 744,865 0.0044% 0.0131% 0.0046% 33 97 341 1-Feb-97 Woodbridge Dam 8,956 0.0000% 0.0000% 0.0000% 0 0 01 1-Mar-97 Woodbridge Dam 2,280 0.0000% 0.0000% 0.0000% 0 0 01 1-Sep-97 Woodbridge Dam 39,240 0.0000% 0.0000% 0.0000% 0 0 01 1-Oct-97 Woodbridge Dam 295,936 0.0000% 0.0000% 0.0000% 0 0 03.1 1-Apr-97 NEW HOPE LANDING 104,258 0.0000% 0.0066% 0.0000% 0 7 03.1 1-May-97 NEW HOPE LANDING 80,000 0.0000% 0.0065% 0.0000% 0 5 03.1 1-Jun-97 NEW HOPE LANDING 943,878 0.0000% 0.0071% 0.0000% 0 67 03.2 1-Apr-97 San Pablo 98,883 0.0000% 0.0328% 0.0180% 0 32 183.2 1-May-97 BENICIA 636,000 0.0000% 0.0328% 0.0180% 0 209 1143.2 1-Jun-97 BENICIA 807,765 0.0000% 0.0328% 0.0180% 0 265 1453.2 1-Jul-97 Bennett's Marina 140,000 0.0000% 0.0328% 0.0180% 0 46 253.2 1-Jul-97 WICKLAND OIL NET PEN 58,800 0.0000% 0.0328% 0.0180% 0 19 1180
ReleaseLocationCodeMokelumne River Fish Installation<strong>Merced</strong> Recovery Rates EscapementTotalNumberReleased Age 2 Age 3 Age 4 Age 2 Age 3 Age 4DateReleased Release Location1 1-Feb-98 Woodbridge Dam 6,938 0.0000% 0.0000% 0.0000% 0 0 01 1-Mar-98 Woodbridge Dam 5,525 0.0000% 0.0000% 0.0000% 0 0 01 1-Apr-98 Woodbridge Dam 2,146 0.0000% 0.0000% 0.0000% 0 0 01 1-May-98 Woodbridge Dam 1,724,300 0.0000% 0.0000% 0.0000% 0 0 01 1-Jun-98 Woodbridge Dam 3,846 0.0000% 0.0000% 0.0000% 0 0 01 1-Jul-98 Woodbridge Dam 1,878 0.0000% 0.0000% 0.0000% 0 0 01 1-Oct-98 Woodbridge Dam 71,000 0.0000% 0.0000% 0.0000% 0 0 01 1-Nov-98 Woodbridge Dam 233,100 0.0000% 0.0000% 0.0000% 0 0 03.1 1-Apr-98 NEW HOPE LANDING 108,000 0.0058% 0.0088% 0.0000% 6 10 03.1 1-May-98 NEW HOPE LANDING 1,039 0.0048% 0.0082% 0.0000% 0 0 03.2 1-Jun-98 WICKLAND OIL NET PEN 1,271,400 0.0071% 0.0192% 0.0074% 90 243 943.2 1-Jul-98 WICKLAND OIL NET PEN 596,900 0.0071% 0.0192% 0.0074% 42 114 443.2 1-Aug-98 WICKLAND OIL NET PEN 144,900 0.0071% 0.0192% 0.0074% 10 28 113.2 1-Apr-98 JERSEY PT,SAN JOAQ.R 105,450 0.0138% 0.0190% 0.0070% 15 20 71 1-Jan-99 Woodbridge Dam 2,671 0.0000% 0.0000% 0.0000% 0 0 01 1-Feb-99 Woodbridge Dam 2,172 0.0000% 0.0000% 0.0000% 0 0 01 1-Mar-99 Woodbridge Dam 1,635 0.0000% 0.0000% 0.0000% 0 0 01 1-Apr-99 Woodbridge Dam 1,635 0.0000% 0.0000% 0.0000% 0 0 01 1-May-99 Woodbridge Dam 4,024 0.0000% 0.0000% 0.0000% 0 0 01 1-Jun-99 Woodbridge Dam 840 0.0000% 0.0000% 0.0000% 0 0 01 1-Jul-99 Woodbridge Dam 1,755 0.0000% 0.0000% 0.0000% 0 0 03.1 1-May-99 NEW HOPE LANDING 1,208,802 0.0099% 0.0091% 0.0000% 119 110 03.2 1-Jun-99 WICKLAND OIL NET PEN 738,407 0.0671% 0.1615% 0.0575% 495 1,193 4253.2 1-Jul-99 WICKLAND OIL NET PEN 440,200 0.0671% 0.1615% 0.0575% 295 711 2533.2 1-Sep-99 Antioch Boat Ramp 9,600 0.0000% 0.0000% 0.0000% 0 0 03.2 1-Oct-99 Antioch Boat Ramp 206,620 0.0000% 0.0000% 0.0000% 0 0 03.2 1-Oct-99 WICKLAND OIL NET PEN 297,600 0.0000% 0.0000% 0.0000% 0 0 03.2 1-May-99 JERSEY PT,SAN JOAQ.R 100,966 0.0835% 0.1505% 0.0505% 84 152 511 1-Jan-00 Woodbridge Dam 2,808 0.0000% 0.0000% 0.0000% 0 0 081
ReleaseLocationCodeMokelumne River Fish Installation<strong>Merced</strong> Recovery Rates EscapementTotalNumberReleased Age 2 Age 3 Age 4 Age 2 Age 3 Age 4DateReleased Release Location1 1-Mar-00 Woodbridge Dam 7,106 0.0000% 0.0000% 0.0000% 0 0 01 1-Apr-00 Woodbridge Dam 992 0.0000% 0.0000% 0.0000% 0 0 01 1-May-00 Woodbridge Dam 828 0.0000% 0.0000% 0.0000% 0 0 01 1-Jun-00 Woodbridge Dam 2,400 0.0000% 0.0000% 0.0000% 0 0 01 1-Jul-00 Woodbridge Dam 1,958 0.0000% 0.0000% 0.0000% 0 0 03.1 1-Apr-00 LIGHTHOUSE MARINA 0 0.0111% 0.0332% 0.0000% 0 0 03.1 1-Apr-00 NEW HOPE LANDING 501,668 0.0111% 0.0332% 0.0000% 56 167 03.1 1-May-00 NEW HOPE LANDING 522,700 0.0113% 0.0334% 0.0000% 59 175 03.1 1-Jul-00 NEW HOPE LANDING 447,892 0.0141% 0.0366% 0.0000% 63 164 03.1 1-Sep-00 NEW HOPE LANDING 391,779 0.0227% 0.0312% 0.0059% 89 122 233.2 1-Apr-00 BENICIA 181,800 0.0178% 0.0048% 0 32 93.2 1-Apr-00 Bennett's Marina 185,300 0.0178% 0.0048% 0 33 93.2 1-Apr-00 WICKLAND OIL NET PEN 463,700 0.0178% 0.0048% 0 83 223.2 1-May-00 WICKLAND OIL NET PEN 698,450 0.0178% 0.0048% 0 124 343.2 1-Jun-00 WICKLAND OIL NET PEN 642,925 0.0178% 0.0048% 0 115 313.2 1-May-00 JERSEY PT,SAN JOAQ.R 0 0.0178% 0.0047% 0 0 01 1-Jan-01 Woodbridge Dam 818 0.0000% 0.0000% 0.0000% 0 0 01 1-Feb-01 Jahant Road 368,246 0.0000% 0.0000% 0.0000% 0 0 01 1-Mar-01 Jahant Road 307,020 0.0000% 0.0000% 0.0000% 0 0 01 1-Mar-01 Woodbridge Dam 2,062 0.0000% 0.0000% 0.0000% 0 0 01 1-Apr-01 MOKELUMNE RIVER 0 0.0000% 0.0000% 0.0000% 0 0 01 1-Apr-01 Woodbridge Dam 2,940 0.0000% 0.0000% 0.0000% 0 0 01 1-May-01 Jahant Road 238,100 0.0000% 0.0000% 0.0000% 0 0 02 1-Apr-01 Yolo Co Park 0 0.0167% 0.0084% 0.0007% 0 0 02 1-May-01 Yolo Co Park 0 0.0167% 0.0084% 0.0007% 0 0 03.1 1-Jan-01 NEW HOPE LANDING 1,822,530 0.0000% 0.0000% 0.0000% 0 0 03.1 1-Feb-01 NEW HOPE LANDING 1,002,333 0.0000% 0.0000% 0.0000% 0 0 03.1 1-Mar-01 NEW HOPE LANDING 370,974 0.0000% 0.0000% 0.0000% 0 0 03.1 1-Apr-01 NEW HOPE LANDING 602,075 0.0110% 0.0032% 0.0000% 66 19 082
ReleaseLocationCodeMokelumne River Fish Installation<strong>Merced</strong> Recovery Rates EscapementTotalNumberReleased Age 2 Age 3 Age 4 Age 2 Age 3 Age 4DateReleased Release Location3.1 1-May-01 NEW HOPE LANDING 551,000 0.0106% 0.0032% 0.0000% 58 17 03.2 1-Apr-01 BENICIA 0 0.0000% 0.0250% 0.0218% 0 0 03.2 1-Apr-01 SAN PABLO BAY 1,464,200 0.0000% 0.0250% 0.0218% 0 366 3203.2 1-May-01 SAN PABLO BAY 1,398,452 0.0000% 0.0250% 0.0218% 0 349 3053.2 1-Apr-01 JERSEY PT,SAN JOAQ.R 0 0.0000% 0.0250% 0.0218% 0 0 01 1-Feb-02 Woodbridge Dam 1,828,878 0.0000% 0.0000% 0.0000% 0 0 01 1-Jun-02 Woodbridge Dam 2,290 0.0000% 0.0000% 0.0000% 0 0 01 1-Oct-02 BEAN FARM 0 0.0000% 0.0005% 0.0000% 0 0 03.1 1-Feb-02 M&T NF 47,000 0.0000% 0.0000% 0.0000% 0 0 03.1 4-Apr-00 NF MR 0 0.0000% 0.0753% 0.0000% 0 0 03.1 18-Apr-02 NEW HOPE LANDING 276,132 0.0000% 0.0753% 0.0000% 0 208 03.1 1-May-02 NEW HOPE LANDING 39,561 0.0000% 0.0753% 0.0000% 0 30 03.1 1-Jul-02 NEW HOPE LANDING 49,590 0.0000% 0.0753% 0.0000% 0 37 03.1 1-Oct-02 North Mokelumne 0 0.0000% 0.0100% 0.0007% 0 0 03.1 1-Oct-02 South Mokelumne 0 0.0000% 0.0100% 0.0007% 0 0 03.2 1-Feb-02 SAN PABLO BAY 1,160,079 0.0000% 0.0000% 0.0000% 0 0 03.2 1-May-02 SAN PABLO BAY 1,980,300 0.0156% 0.0307% 0.0000% 310 608 03.2 9-Apr-02 JERSEY PT,SAN JOAQ.R 0 0.0344% 0.0312% 0.0000% 0 0 03.2 1-Oct-02 JERSEY PT,SAN JOAQ.R 0 0.0000% 0.0000% 0.0000% 0 0 01 1-Jan-03 Woodbridge Dam 10,799 0.0000% 0.0000% 0.0000% 0 0 01 1-Apr-03 MOKELUMNE R FISH INS 0 0.0000% 0.0000% 0.0000% 0 0 01 1-Jun-03 Lodi Lake 850 0.0000% 0.0000% 0.0000% 0 0 01 1-Jul-03 Woodbridge Dam 795 0.0000% 0.0000% 0.0000% 0 0 03.1 1-Apr-03 NEW HOPE LANDING 4,646,988 0.0000% 0.0098% 0.0000% 0 456 03.2 1-Apr-03 Conoco Phillips 2,175,025 0.0000% 0.0120% 0.0044% 0 261 963.2 1-May-03 Antioch Boat Ramp 575 0.0000% 0.0120% 0.0044% 0 0 03.2 1-May-03 TIBURON NET PENS 50,600 0.0000% 0.0120% 0.0044% 0 6 21 1-Apr-04 Woodbridge Dam 3,175 0.0000% 0.0000% 0.0000% 0 0 01 1-May-04 MOKELUMNE R FISH INS 0 0.0000% 0.0000% 0.0000% 0 0 083
ReleaseLocationCodeMokelumne River Fish Installation<strong>Merced</strong> Recovery Rates EscapementTotalNumberReleased Age 2 Age 3 Age 4 Age 2 Age 3 Age 4DateReleased Release Location1 1-Jun-04 Lodi Lake 989 0.0000% 0.0000% 0.0000% 0 0 03.1 1-Apr-04 THORNTON-Moke 1,013,700 0.0000% 0.0000% 0.0000% 0 0 03.1 1-May-04 THORNTON-Moke 2,389,877 0.0000% 0.0000% 0.0000% 0 0 03.1 1-Jun-04 THORNTON-Moke 210,800 0.0000% 0.0000% 0.0000% 0 0 03.2 1-May-04 BENICIA 1,792,400 0.0070% 0.0249% 0.0055% 125 447 983.2 1-May-04 TIBURON NET PENS 51,700 0.0070% 0.0249% 0.0055% 4 13 33.2 1-Jun-04 BENICIA 216,800 0.0070% 0.0249% 0.0055% 15 54 121 1-Feb-05 Woodbridge Dam 1,457 0.0000% 0.0000% 0.0000% 0 0 01 1-Mar-05 Woodbridge Dam 1,016 0.0000% 0.0000% 0.0000% 0 0 01 5-Apr-05 Woodbridge Dam 1,057 0.0000% 0.0000% 0.0000% 0 0 01 1-May-05 MERCED R FISH FACIL. 0 0.0000% 0.0000% 0.0000% 0 0 03.1 5-Apr-05 THORNTON-Moke 242,350 0.0000% 0.0000% 0.0000% 0 0 03.1 1-May-05 THORNTON-Moke 2,009,715 0.0000% 0.0000% 0.0000% 0 0 03.1 27-Jun-05 THORNTON-Moke 1,642,960 0.0000% 0.0000% 0.0000% 0 0 03.2 5-Apr-05 SAN PABLO BAY 296,400 0.0000% 0.0000% 0.0000% 0 0 03.2 1-May-05 SAN PABLO BAY 1,275,680 0.0000% 0.0000% 0.0000% 0 0 03.2 1-May-05 TIBURON NET PENS 51,300 0.0000% 0.0000% 0.0000% 0 0 03.2 27-Jun-05 SAN PABLO BAY 432,000 0.0000% 0.0000% 0.0000% 0 0 01 24-Jan-06 MOKELUMNE RIVER 2,116 0 0 01 10-Feb-06 MOKELUMNE RIVER 2,010 0 0 01 4-Apr-06 MOKELUMNE RIVER 2,040 0 0 01 14-Apr-06 MOKELUMNE RIVER 4,095 0 0 01 18-Apr-06 MOKELUMNE RIVER 302,400 0 0 01 20-Apr-06 MOKELUMNE RIVER 106,200 0 0 01 21-Apr-06 MOKELUMNE RIVER 417,600 0 0 01 1-May-06 MOKELUMNE RIVER 108,884 0 0 01 5-May-06 MOKELUMNE RIVER 102,872 0 0 01 10-May-06 MOKELUMNE RIVER 636,600 0 0 01 11-May-06 MOKELUMNE RIVER 344,200 0 0 084
ReleaseLocationCodeMokelumne River Fish Installation<strong>Merced</strong> Recovery Rates EscapementTotalNumberReleased Age 2 Age 3 Age 4 Age 2 Age 3 Age 4DateReleased Release Location1 12-May-06 MOKELUMNE RIVER 528,000 0 0 01 23-May-06 MOKELUMNE RIVER 230,100 0 0 01 24-May-06 MOKELUMNE RIVER 312,700 0 0 01 30-May-06 MOKELUMNE RIVER 354,000 0 0 01 5-Jun-06 MOKELUMNE RIVER 62,045 0 0 01 6-Jun-06 MOKELUMNE RIVER 291,600 0 0 01 7-Jun-06 MOKELUMNE RIVER 216,000 0 0 01 12-Jun-06 MOKELUMNE RIVER 102,200 0 0 03.2 24-Apr-06 SAN PABLO BAY 125,400 0 0 03.2 25-Apr-06 SAN PABLO BAY 128,625 0 0 03.2 2-May-06 SAN PABLO BAY 222,250 0 0 03.2 3-May-06 SAN PABLO BAY 236,250 0 0 03.2 4-May-06 SAN PABLO BAY 98,000 0 0 03.2 5-May-06 SAN PABLO BAY 227,500 0 0 03.2 8-May-06 SAN PABLO BAY 174,000 0 0 03.2 9-May-06 SAN PABLO BAY 239,750 0 0 03.2 18-May-06 San Francisco Bay 49,500 0 0 03.2 1-Jun-06 SAN PABLO BAY 282,300 0 0 03.2 2-Jun-06 SAN PABLO BAY 269,500 0 0 03.2 8-Jun-06 San Francisco Bay 42,000 0 0 03.2 10-Jun-06 San Francisco Bay 51,450 0 0 085
ReleaseLocationCode<strong>Merced</strong> River Hatchery<strong>Merced</strong> Recovery Rates EscapementTotalNumberReleased Age 2 Age 3 Age 4 Age 2 Age 3 Age 4DateReleased Release Location1 21-Jun-78 MERCED R FISH FACIL. 100,000 0.0000% 0.0050% 0.0022% 0 5 21 29-Sep-78 MERCED R FISH FACIL. 195,000 0.0000% 0.5399% 0.0571% 0 1,053 1111 17-Oct-84 MERCED R FISH FACIL. 73,600 0.3878% 1.8231% 0.0439% 285 1,342 321 14-Oct-85 MERCED R FISH FACIL. 63,000 0.4204% 0.1867% 0.0316% 265 118 201 8-Mar-86 MERCED R FISH FACIL. 15,876 0.0000% 0.0000% 0.0000% 0 0 01 14-Mar-86 MERCED R FISH FACIL. 20,448 0.0000% 0.0000% 0.0000% 0 0 01 18-Mar-86 MERCED R FISH FACIL. 88,830 0.0000% 0.0000% 0.0000% 0 0 01 20-Mar-86 MERCED R FISH FACIL. 38,762 0.0000% 0.0000% 0.0000% 0 0 01 26-Mar-86 MERCED R FISH FACIL. 14,544 0.0000% 0.0000% 0.0000% 0 0 01 3-Apr-86 MERCED R FISH FACIL. 49,298 0.0075% 0.0811% 0.0385% 4 40 191 8-Apr-86 MERCED R FISH FACIL. 12,760 0.0084% 0.0908% 0.0431% 1 12 51 30-May-86 MERCED R FISH FACIL. 351,250 0.0018% 0.0193% 0.0092% 6 68 321 18-Jun-86 MERCED R FISH FACIL. 24,960 0.0010% 0.0103% 0.0049% 0 3 11 19-Oct-87 MERCED R FISH FACIL. 254,842 0.0000% 0.0000% 0.0000% 0 0 02 29-Apr-87 SJR at Mile 82 1,632 0.0000% 0.0000% 0.0000% 0 0 02 30-Apr-87 SJR at Mile 82 1,860 0.0000% 0.0000% 0.0000% 0 0 02 1-May-87 SAN JOAQ.R,BELOW OLD 3,130 0.0000% 0.0000% 0.0000% 0 0 02 14-May-87 SAN JOAQ.R,ABOVE OLD 4,548 0.0000% 0.0000% 0.0000% 0 0 0Stanislaus River, AmericanTrails Cmp. 206,370 0.0000% 0.0000% 0.0000% 0 0 01 17-Mar-881 18-Apr-88 MERCED R FISH FACIL. 3,200 0.0000% 0.0000% 0.0000% 0 0 01 17-Oct-88 Fisherman Bend <strong>Merced</strong> R. 39,510 0.0000% 0.0000% 0.0000% 0 0 01 18-Oct-88 Fisherman Bend <strong>Merced</strong> R. 42,105 0.0000% 0.0000% 0.0000% 0 0 01 19-Oct-88 Fisherman Bend <strong>Merced</strong> R. 40,450 0.0000% 0.0000% 0.0000% 0 0 01 20-Oct-88 Fisherman Bend <strong>Merced</strong> R. 20,445 0.0000% 0.0000% 0.0000% 0 0 01 24-Oct-88 MERCED R FISH FACIL. 1,000 0.0000% 0.0000% 0.0000% 0 0 02 10-Mar-88 USFWS Los Banos 1,082 0.0000% 0.0000% 0.0000% 0 0 02 23-Mar-88 USFWS Los Banos 800 0.0000% 0.0000% 0.0000% 0 0 086
ReleaseLocationCode<strong>Merced</strong> River Hatchery<strong>Merced</strong> Recovery Rates EscapementTotalNumberReleased Age 2 Age 3 Age 4 Age 2 Age 3 Age 4DateReleased Release Location1 6-Oct-89 MERCED R FISH FACIL. 96,334 0.0000% 0.0000% 0.0000% 0 0 01 7-Oct-89 MERCED R FISH FACIL. 82,848 0.0000% 0.0000% 0.0000% 0 0 02 20-Apr-89 Dos Rios Ranch 9,996 0.0306% 0.0009% 0.0029% 3 0 02 2-May-89 MOSSDALE 1,300 0.0310% 0.0009% 0.0029% 0 0 02 4-May-89 MOSSDALE 2,550 0.0307% 0.0009% 0.0029% 1 0 03.2 5-Jun-89 Berkeley Marina 183,600 0.0000% 0.0000% 0.0000% 0 0 03.2 6-Jun-89 Berkeley Marina 240,000 0.0000% 0.0000% 0.0000% 0 0 03.2 7-Jun-89 Berkeley Marina 245,700 0.0000% 0.0000% 0.0000% 0 0 03.2 8-Jun-89 Berkeley Marina 198,400 0.0000% 0.0000% 0.0000% 0 0 02 11-May-90 MOSSDALE 1,104 0.0000% 0.0000% 0.0000% 0 0 02 18-May-90 MOSSDALE 1,056 0.0000% 0.0000% 0.0000% 0 0 01 21-Oct-91 <strong>Merced</strong> River 104,822 0.0000% 0.0000% 0.0000% 0 0 01 4-Mar-92 Fisherman Bend 34,648 0.0000% 0.0000% 0.0000% 0 0 02 13-May-92 MOSSDALE 1,188 0.0000% 0.0000% 0.0000% 0 0 02 14-May-92 MOSSDALE 2,282 0.0000% 0.0000% 0.0000% 0 0 02 22-Apr-93 MOSSDALE 1,120 0.0416% 0.0249% 0.0052% 0 0 02 29-Apr-93 MOSSDALE 2,120 0.0447% 0.0261% 0.0053% 1 1 02 6-May-93 MOSSDALE 2,120 0.0442% 0.0259% 0.0053% 1 1 02 13-May-93 MOSSDALE 4,120 0.0415% 0.0248% 0.0052% 2 1 02 13-May-93 San Joaquin River 23,200 0.0415% 0.0248% 0.0052% 10 6 12 20-May-93 San Joaquin River 4,150 0.0402% 0.0243% 0.0051% 2 1 02 27-Apr-94 MOSSDALE 2,005 0.0658% 0.0321% 0.0054% 1 1 02 4-May-94 MOSSDALE 2,013 0.0633% 0.0313% 0.0053% 1 1 02 10-May-94 MOSSDALE 2,023 0.0633% 0.0313% 0.0053% 1 1 02 17-May-94 MOSSDALE 2,042 0.0629% 0.0312% 0.0053% 1 1 01 14-Apr-95 Shaffer Bridge 2,430 0.1602% 0.1675% 0.0457% 4 4 11 21-Apr-95 Hwy 120 1,008 0.1308% 0.1367% 0.0373% 1 1 01 28-Apr-95 MOKELUMNE RIVER 0 0.2302% 0.2407% 0.0658% 0 0 01 1-May-95 Orange Blossom Bridge 1,001 0.3007% 0.3146% 0.0860% 3 3 187
ReleaseLocationCode<strong>Merced</strong> River Hatchery<strong>Merced</strong> Recovery Rates EscapementTotalNumberReleased Age 2 Age 3 Age 4 Age 2 Age 3 Age 4DateReleased Release Location1 2-May-95 MERCED R FISH FACIL. 138,000 0.3027% 0.3166% 0.0865% 418 437 1191 3-May-95 Hagaman Park 1,000 0.2986% 0.3124% 0.0854% 3 3 11 3-May-95 MERCED R FISH FACIL. 74,800 0.2986% 0.3124% 0.0854% 223 234 641 5-May-95 MOKELUMNE RIVER 0 0.2799% 0.2928% 0.0800% 0 0 01 10-May-95 MERCED R FISH FACIL. 276,450 0.2186% 0.2286% 0.0624% 604 632 1731 12-May-95 Hwy 120 199 0.2156% 0.2255% 0.0616% 0 0 01 12-May-95 Orange Blossom Bridge 1,003 0.2156% 0.2255% 0.0616% 2 2 11 15-May-95 MOKELUMNE RIVER 0 0.2122% 0.2219% 0.0606% 0 0 01 19-May-95 Hwy 120 210 0.2009% 0.2101% 0.0574% 0 0 01 19-May-95 Orange Blossom Bridge 1,018 0.2009% 0.2101% 0.0574% 2 2 11 26-May-95 Orange Blossom Bridge 1,015 0.2023% 0.2116% 0.0578% 2 2 11 14-Jun-95 Hwy 120 210 0.2269% 0.2373% 0.0648% 0 0 01 14-Jun-95 Orange Blossom Bridge 4,046 0.2269% 0.2373% 0.0648% 9 10 32 11-May-95 MOSSDALE 2,052 0.1515% 0.0109% 0.0084% 3 0 02 18-May-95 MOSSDALE 2,014 0.1555% 0.0111% 0.0085% 3 0 02 25-May-95 MOSSDALE 2,024 0.1533% 0.0110% 0.0084% 3 0 02 31-May-95 MOSSDALE 2,037 0.1366% 0.0102% 0.0080% 3 0 02 29-Jun-95 DOS REIS ROAD 8,400 0.0590% 0.0058% 0.0054% 5 0 02 30-Jun-95 DOS REIS ROAD 4,589 0.0601% 0.0059% 0.0054% 3 0 01 10-Jun-96 Knights Ferry 20,162 0.0135% 0.0581% 0.0048% 3 12 12 19-Apr-96 MOSSDALE 4,984 0.0220% 0.0570% 0.0051% 1 3 02 3-May-96 MOSSDALE 2,603 0.0212% 0.0555% 0.0050% 1 1 02 8-May-96 MOSSDALE 2,597 0.0214% 0.0559% 0.0050% 1 1 02 15-May-96 MOSSDALE 2,549 0.0251% 0.0622% 0.0054% 1 2 02 23-May-96 MOSSDALE 2,553 0.0277% 0.0664% 0.0056% 1 2 02 29-May-96 MOSSDALE 2,553 0.0217% 0.0563% 0.0050% 1 1 02 5-Jun-96 MOSSDALE 2,428 0.0186% 0.0508% 0.0047% 0 1 02 24-Apr-97 MOSSDALE 2,594 0.1292% 0.1108% 0.0104% 3 3 02 1-May-97 MOSSDALE 2,564 0.1267% 0.1094% 0.0103% 3 3 088
ReleaseLocationCode<strong>Merced</strong> River Hatchery<strong>Merced</strong> Recovery Rates EscapementTotalNumberReleased Age 2 Age 3 Age 4 Age 2 Age 3 Age 4DateReleased Release Location2 10-May-97 MOSSDALE 3,503 0.1259% 0.1089% 0.0103% 4 4 02 16-May-97 MOSSDALE 3,237 0.1143% 0.1021% 0.0098% 4 3 02 22-May-97 MOSSDALE 4,080 0.1111% 0.1002% 0.0097% 5 4 02 29-May-97 MOSSDALE 4,043 0.1093% 0.0991% 0.0096% 4 4 02 4-Jun-97 MOSSDALE 4,065 0.1079% 0.0982% 0.0096% 4 4 02 24-Jun-97 DOS REIS ROAD 32,000 0.1028% 0.0951% 0.0093% 33 30 31 1-Apr-98 Hagaman Park 1,500 0.0775% 0.4633% 0.0362% 1 7 11 6-Apr-98 Hagaman Park 2,010 0.0812% 0.4853% 0.0379% 2 10 11 13-Apr-98 Hagaman Park 2,000 0.0822% 0.4912% 0.0384% 2 10 11 20-Apr-98 Hagaman Park 2,000 0.0747% 0.4462% 0.0348% 1 9 11 27-Apr-98 Hagaman Park 2,008 0.0657% 0.3928% 0.0307% 1 8 11 4-May-98 Hagaman Park 2,000 0.0626% 0.3743% 0.0292% 1 7 11 12-May-98 Hagaman Park 2,001 0.0812% 0.4848% 0.0379% 2 10 11 13-May-98 MERCED R FISH FACIL. 113,500 0.0828% 0.4943% 0.0386% 94 561 441 18-May-98 MERCED R FISH FACIL. 113,450 0.0752% 0.4493% 0.0351% 85 510 401 19-May-98 Hagaman Park 3,007 0.0714% 0.4270% 0.0333% 2 13 11 27-May-98 Hagaman Park 3,000 0.0577% 0.3453% 0.0269% 2 10 11 27-May-98 MERCED R FISH FACIL. 60,546 0.0577% 0.3453% 0.0269% 35 209 161 29-May-98 MERCED R FISH FACIL. 107,900 0.0566% 0.3386% 0.0264% 61 365 281 31-May-98 MERCED R FISH FACIL. 84,945 0.0549% 0.3285% 0.0256% 47 279 221 3-Jun-98 Hagaman Park 3,004 0.0540% 0.3227% 0.0252% 2 10 11 8-Jun-98 Hagaman Park 2,000 0.0555% 0.3320% 0.0259% 1 7 11 17-Jun-98 Hagaman Park 3,037 0.0644% 0.3848% 0.0300% 2 12 11 24-Jun-98 MERCED R FISH FACIL. 24,480 0.0464% 0.2776% 0.0216% 11 68 51 25-Jun-98 Hagaman Park 0 0.0428% 0.2560% 0.0199% 0 0 02 9-Apr-98 MOSSDALE 500 0.0968% 0.1554% 0.0098% 0 1 02 9-Apr-98 Mossdale 3,000 0.0968% 0.1554% 0.0098% 3 5 02 21-Apr-98 MOSSDALE 500 0.0821% 0.1391% 0.0091% 0 1 02 23-Apr-98 MOSSDALE 6,582 0.0776% 0.1340% 0.0089% 5 9 189
ReleaseLocationCode<strong>Merced</strong> River Hatchery<strong>Merced</strong> Recovery Rates EscapementTotalNumberReleased Age 2 Age 3 Age 4 Age 2 Age 3 Age 4DateReleased Release Location2 30-Apr-98 MOSSDALE 6,030 0.0687% 0.1235% 0.0084% 4 7 12 5-May-98 MOSSDALE 1,537 0.0648% 0.1188% 0.0081% 1 2 02 7-May-98 MOSSDALE 6,515 0.0655% 0.1196% 0.0082% 4 8 12 14-May-98 MOSSDALE 5,010 0.0724% 0.1280% 0.0086% 4 6 02 21-May-98 MOSSDALE 5,011 0.0758% 0.1320% 0.0088% 4 7 02 29-May-98 MOSSDALE 5,923 0.0719% 0.1273% 0.0086% 4 8 12 3-Jun-98 MOSSDALE 300 0.0668% 0.1213% 0.0083% 0 0 02 10-Jun-98 MOSSDALE 5,300 0.0644% 0.1183% 0.0081% 3 6 02 11-Jun-98 MOSSDALE 4,816 0.0652% 0.1193% 0.0082% 3 6 01 4-Mar-99 Hagaman Park 1,005 0.0000% 0.0000% 0.0000% 0 0 01 17-Mar-99 Hagaman Park 1,501 0.0000% 0.0000% 0.0000% 0 0 01 30-Mar-99 Hagaman Park 2,000 0.0000% 0.0000% 0.0000% 0 0 01 6-Apr-99 Hagaman Park 2,002 0.0715% 0.0790% 0.0056% 1 2 01 13-Apr-99 Hagaman Park 2,007 0.1543% 0.1706% 0.0121% 3 3 01 21-Apr-99 Gallo 863 0.2875% 0.3178% 0.0225% 2 3 01 21-Apr-99 Hagaman Park 2,000 0.2875% 0.3178% 0.0225% 6 6 01 28-Apr-99 Gallo 500 0.1268% 0.1402% 0.0099% 1 1 01 6-May-99 Hagaman Park 2,008 0.1576% 0.1742% 0.0123% 3 3 01 11-May-99 MERCED R FISH FACIL. 44,500 0.0976% 0.1079% 0.0076% 43 48 31 12-May-99 Gallo 300 0.0863% 0.0954% 0.0068% 0 0 01 12-May-99 Hagaman Park 2,000 0.0863% 0.0954% 0.0068% 2 2 01 17-May-99 Robinson Ranch 5,000 0.0668% 0.0739% 0.0052% 3 4 01 18-May-99 Gallo 1,001 0.0662% 0.0733% 0.0052% 1 1 01 Hagaman Park 2,012 0.0662% 0.0733% 0.0052% 1 1 01 19-May-99 Gallo 531 0.0659% 0.0729% 0.0052% 0 0 01 21-May-99 Gallo 20,880 0.0657% 0.0726% 0.0051% 14 15 11 23-May-99 Gallo 539 0.0655% 0.0724% 0.0051% 0 0 01 25-May-99 Gallo 544 0.0651% 0.0719% 0.0051% 0 0 01 25-May-99 Hagaman Park 3,041 0.0651% 0.0719% 0.0051% 2 2 090
ReleaseLocationCode<strong>Merced</strong> River Hatchery<strong>Merced</strong> Recovery Rates EscapementTotalNumberReleased Age 2 Age 3 Age 4 Age 2 Age 3 Age 4DateReleased Release Location1 27-May-99 Hagaman Park 2,025 0.0647% 0.0715% 0.0051% 1 1 01 No Date Robinson Ranch 10,026 0.0000% 0.0000% 0.0000% 0 0 01 Robinson Ranch 10,026 0.0000% 0.0000% 0.0000% 0 0 02 27-Apr-99 MOSSDALE 5,000 0.2166% 0.3450% 0.0277% 11 17 12 6-May-99 MOSSDALE 3,300 0.2170% 0.3453% 0.0277% 7 11 12 13-May-99 MOSSDALE 3,016 0.2065% 0.3341% 0.0271% 6 10 12 19-May-99 MOSSDALE 300 0.1798% 0.3046% 0.0254% 1 1 02 24-May-99 MOSSDALE 4,000 0.1768% 0.3012% 0.0252% 7 12 12 27-May-99 MOSSDALE 911 0.1745% 0.2986% 0.0250% 2 3 02 28-May-99 MOSSDALE 4,020 0.1739% 0.2979% 0.0250% 7 12 12 3-Jun-99 MOSSDALE 4,307 0.1732% 0.2970% 0.0249% 7 13 12 4-Jun-99 MOSSDALE 4,013 0.1732% 0.2971% 0.0249% 7 12 11 8-Mar-00 <strong>Merced</strong> River 2,038 0.0000% 0.0000% 0.0000% 0 0 01 13-Mar-00 <strong>Merced</strong> River 1,152 0.0000% 0.0000% 0.0000% 0 0 01 14-Mar-00 <strong>Merced</strong> River 706 0.0000% 0.0000% 0.0000% 0 0 01 15-Mar-00 Hagaman Park 2,002 0.0000% 0.0000% 0.0000% 0 0 01 21-Mar-00 Hagaman Park 2,000 0.0000% 0.0000% 0.0000% 0 0 01 28-Mar-00 Hagaman Park 2,117 0.0000% 0.0000% 0.0000% 0 0 01 3-Apr-00 Gallo 500 0.0881% 0.1460% 0.0054% 0 1 01 4-Apr-00 Hagaman Park 2,028 0.0873% 0.1448% 0.0053% 2 3 01 5-Apr-00 Robinson Ranch 2,001 0.0866% 0.1436% 0.0053% 2 3 01 12-Apr-00 Gallo 2,038 0.0864% 0.1433% 0.0053% 2 3 01 13-Apr-00 Hagaman Park 2,008 0.0873% 0.1448% 0.0053% 2 3 01 24-Apr-00 Gallo 2,004 0.2384% 0.3948% 0.0146% 5 8 01 25-Apr-00 Hwy 59 3,008 0.2331% 0.3860% 0.0143% 7 12 01 25-Apr-00 SNELLING 5,000 0.2331% 0.3860% 0.0143% 12 19 11 26-Apr-00 Hagaman Park 2,000 0.2242% 0.3713% 0.0137% 4 7 01 29-Apr-00 Gallo 1,070 0.1568% 0.2598% 0.0096% 2 3 01 12-May-00 Gallo 896 0.0956% 0.1585% 0.0058% 1 1 091
ReleaseLocationCode<strong>Merced</strong> River Hatchery<strong>Merced</strong> Recovery Rates EscapementTotalNumberReleased Age 2 Age 3 Age 4 Age 2 Age 3 Age 4DateReleased Release Location1 14-May-00 MERCED R FISH FACIL. 152,438 0.0919% 0.1524% 0.0056% 140 232 91 15-May-00 Gallo 3,003 0.0919% 0.1523% 0.0056% 3 5 01 15-May-00 Hwy 59 2,021 0.0919% 0.1523% 0.0056% 2 3 01 15-May-00 SNELLING 5,002 0.0919% 0.1523% 0.0056% 5 8 01 16-May-00 Hagaman Park 2,026 0.0920% 0.1525% 0.0056% 2 3 02 3-May-00 Old River Barrier 10,133 0.0522% 0.2785% 0.0039% 5 28 02 10-May-00 Old River Barrier 10,059 0.0517% 0.2768% 0.0039% 5 28 03.2 28-Mar-00 Berkeley Marina 0 0.0000% 0.0000% 0.0000% 0 0 01 18-Jan-01 Hagaman Park 2,000 0.0000% 0.0000% 0.0000% 0 0 01 26-Jan-01 Hagaman Park 1,010 0.0000% 0.0000% 0.0000% 0 0 01 31-Jan-01 Gallo 1,140 0.0000% 0.0000% 0.0000% 0 0 01 1-Feb-01 Hagaman Park 2,029 0.0000% 0.0000% 0.0000% 0 0 01 6-Feb-01 Hagaman Park 1,070 0.0000% 0.0000% 0.0000% 0 0 01 1-Mar-01 Gallo 810 0.0000% 0.0000% 0.0000% 0 0 01 7-Mar-01 Hagaman Park 2,014 0.0000% 0.0000% 0.0000% 0 0 01 19-Mar-01 Gallo 1,397 0.0000% 0.0000% 0.0000% 0 0 01 22-Mar-01 Hagaman Park 2,016 0.0000% 0.0000% 0.0000% 0 0 01 29-Mar-01 Hagaman Park 2,014 0.0000% 0.0000% 0.0000% 0 0 01 2-Apr-01 Gallo 1,300 0.0957% 0.0431% 0.0051% 1 1 01 3-Apr-01 Hagaman Park 0 0.0960% 0.0432% 0.0051% 0 0 01 6-Apr-01 Hagaman Park 2,016 0.0965% 0.0434% 0.0051% 2 1 01 16-Apr-01 Gallo 2,097 0.1460% 0.0658% 0.0077% 3 1 01 16-Apr-01 Henderson Park 5,028 0.1460% 0.0658% 0.0077% 7 3 01 16-Apr-01 Robinson Ranch 3,043 0.1460% 0.0658% 0.0077% 4 2 01 18-Apr-01 Hagaman Park 2,008 0.1788% 0.0805% 0.0095% 4 2 01 22-Apr-01 Gallo 2,204 0.1800% 0.0811% 0.0095% 4 2 01 22-Apr-01 Henderson Park 5,031 0.1800% 0.0811% 0.0095% 0 0 01 22-Apr-01 Robinson Ranch 3,150 0.1800% 0.0811% 0.0095% 6 3 01 25-Apr-01 Gallo 789 0.1354% 0.0609% 0.0072% 1 0 092
ReleaseLocationCode<strong>Merced</strong> River Hatchery<strong>Merced</strong> Recovery Rates EscapementTotalNumberReleased Age 2 Age 3 Age 4 Age 2 Age 3 Age 4DateReleased Release Location1 26-Apr-01 Hagaman Park 2,053 0.1226% 0.0552% 0.0065% 3 1 01 27-Apr-01 Gallo 375 0.1150% 0.0518% 0.0061% 0 0 01 2-May-01 Hagaman Park 2,055 0.1168% 0.0526% 0.0062% 2 1 01 4-May-01 Gallo 847 0.1383% 0.0623% 0.0073% 1 1 01 9-May-01 Gallo 1,449 0.1881% 0.0847% 0.0100% 3 1 01 9-May-01 Henderson Park 5,015 0.1881% 0.0847% 0.0100% 9 4 01 9-May-01 Robinson Ranch 3,021 0.1881% 0.0847% 0.0100% 6 3 01 10-May-01 Hagaman Park 2,017 0.1882% 0.0848% 0.0100% 4 2 01 11-May-01 MERCED R FISH FACIL. 162,000 0.1855% 0.0835% 0.0098% 300 135 161 14-May-01 MERCED R FISH FACIL. 40,964 0.1442% 0.0649% 0.0076% 59 27 31 16-May-01 Hagaman Park 2,050 0.1133% 0.0510% 0.0060% 2 1 01 21-May-01 Gallo 2,415 0.0986% 0.0444% 0.0052% 2 1 01 21-May-01 Henderson Park 5,024 0.0986% 0.0444% 0.0052% 5 2 01 21-May-01 Robinson Ranch 3,249 0.0986% 0.0444% 0.0052% 3 1 01 24-May-01 Hagaman Park 2,020 0.0958% 0.0431% 0.0051% 2 1 01 26-May-01 Gallo 600 0.0952% 0.0429% 0.0050% 1 0 01 31-May-01 Hagaman Park 1,618 0.0914% 0.0411% 0.0048% 1 1 02 12-Apr-01 MOSSDALE 3,053 0.1264% 0.0569% 0.0088% 4 2 02 26-Apr-01 MOSSDALE 3,035 0.1402% 0.0610% 0.0092% 4 2 02 26-Apr-01 Old River Barrier 7,012 0.1402% 0.0610% 0.0092% 10 4 12 1-May-01 MOSSDALE 1,523 0.1401% 0.0610% 0.0092% 2 1 02 9-May-01 Old River Barrier 7,268 0.1410% 0.0612% 0.0093% 10 4 12 10-May-01 MOSSDALE 1,527 0.1415% 0.0614% 0.0093% 2 1 02 22-May-01 MOSSDALE 3,044 0.1251% 0.0565% 0.0088% 4 2 02 31-May-01 DOS REIS ROAD 110 0.1224% 0.0557% 0.0087% 0 0 01 7-Feb-02 Hagaman Park 0 0.0000% 0.0000% 0.0000% 0 0 01 13-Feb-02 Hagaman Park 1,859 0.0000% 0.0000% 0.0000% 0 0 01 20-Feb-02 Gallo 687 0.0000% 0.0000% 0.0000% 0 0 01 23-Feb-02 Gallo 1,268 0.0000% 0.0000% 0.0000% 0 0 093
ReleaseLocationCode<strong>Merced</strong> River Hatchery<strong>Merced</strong> Recovery Rates EscapementTotalNumberReleased Age 2 Age 3 Age 4 Age 2 Age 3 Age 4DateReleased Release Location1 27-Feb-02 Hagaman Park 2,224 0.0000% 0.0000% 0.0000% 0 0 01 6-Mar-02 Gallo 764 0.0000% 0.0000% 0.0000% 0 0 01 6-Mar-02 Hagaman Park 2,015 0.0000% 0.0000% 0.0000% 0 0 01 13-Mar-02 Hagaman Park 2,075 0.0000% 0.0000% 0.0000% 0 0 01 19-Mar-02 Gallo 1,881 0.0000% 0.0000% 0.0000% 0 0 01 20-Mar-02 Hagaman Park 2,018 0.0000% 0.0000% 0.0000% 0 0 01 27-Mar-02 Hagaman Park 2,068 0.0000% 0.0000% 0.0000% 0 0 01 30-Mar-02 Hagaman Park 2,023 0.0000% 0.0000% 0.0000% 0 0 01 2-Apr-02 MERCED R FISH FACIL. 5,928 0.0102% 0.0429% 0.0050% 1 3 01 3-Apr-02 Hagaman Park 2,042 0.0102% 0.0431% 0.0051% 0 1 01 3-Apr-02 Henderson Park 5,053 0.0102% 0.0431% 0.0051% 1 2 01 4-Apr-02 Gallo 2,067 0.0103% 0.0433% 0.0051% 0 1 01 4-Apr-02 Robinson Ranch 3,050 0.0103% 0.0433% 0.0051% 0 1 01 10-Apr-02 Hagaman Park 2,024 0.0110% 0.0465% 0.0055% 0 1 01 12-Apr-02 Gallo 2,596 0.0115% 0.0484% 0.0057% 0 1 01 16-Apr-02 MERCED R FISH FACIL. 7,100 0.0119% 0.0504% 0.0059% 1 4 01 17-Apr-02 Hagaman Park 2,022 0.0120% 0.0508% 0.0060% 0 1 01 17-Apr-02 Henderson Park 5,092 0.0120% 0.0508% 0.0060% 1 3 01 18-Apr-02 Gallo 2,044 0.0121% 0.0511% 0.0060% 0 1 01 18-Apr-02 Robinson Ranch 3,006 0.0121% 0.0511% 0.0060% 0 2 01 21-Apr-02 Gallo 2,500 0.0121% 0.0513% 0.0060% 0 1 01 1-May-02 MERCED R FISH FACIL. 368,160 0.0242% 0.1021% 0.0120% 89 376 441 2-May-02 Hagaman Park 2,025 0.0239% 0.1012% 0.0119% 0 2 01 2-May-02 Henderson Park 5,036 0.0239% 0.1012% 0.0119% 1 5 11 3-May-02 Gallo 3,114 0.0230% 0.0971% 0.0114% 1 3 01 3-May-02 Robinson Ranch 3,088 0.0230% 0.0971% 0.0114% 1 3 01 4-May-02 Gallo 1,246 0.0215% 0.0910% 0.0107% 0 1 01 8-May-02 Hagaman Park 2,116 0.0170% 0.0719% 0.0085% 0 2 01 14-May-02 Hagaman Park 2,014 0.0103% 0.0436% 0.0051% 0 1 094
ReleaseLocationCode<strong>Merced</strong> River Hatchery<strong>Merced</strong> Recovery Rates EscapementTotalNumberReleased Age 2 Age 3 Age 4 Age 2 Age 3 Age 4DateReleased Release Location1 15-May-02 MERCED R FISH FACIL. 7,149 0.0102% 0.0431% 0.0051% 1 3 01 16-May-02 Henderson Park 5,027 0.0102% 0.0430% 0.0050% 1 2 01 17-May-02 Gallo 2,008 0.0102% 0.0430% 0.0051% 0 1 01 17-May-02 Robinson Ranch 3,025 0.0102% 0.0430% 0.0051% 0 1 01 20-May-02 Gallo 2,400 0.0102% 0.0430% 0.0050% 0 1 01 22-May-02 Hagaman Park 2,077 0.0101% 0.0427% 0.0050% 0 1 01 29-May-02 Hagaman Park 2,048 0.0099% 0.0418% 0.0049% 0 1 02 5-Apr-02 Mossdale 2,017 0.0113% 0.0404% 0.0079% 0 1 02 11-Apr-02 MOSSDALE 5,091 0.0117% 0.0413% 0.0080% 1 2 02 17-Apr-02 MOSSDALE 2,043 0.0123% 0.0428% 0.0082% 0 1 02 19-Apr-02 Old River Barrier 12,334 0.0124% 0.0429% 0.0082% 2 5 12 24-Apr-02 Old River Barrier 12,126 0.0125% 0.0431% 0.0083% 2 5 12 26-Apr-02 MOSSDALE 5,064 0.0125% 0.0432% 0.0083% 1 2 02 3-May-02 MOSSDALE 2,005 0.0124% 0.0431% 0.0083% 0 1 02 9-May-02 MOSSDALE 5,010 0.0123% 0.0428% 0.0082% 1 2 02 14-May-02 MOSSDALE 2,014 0.0119% 0.0418% 0.0081% 0 1 02 23-May-02 MOSSDALE 5,057 0.0115% 0.0409% 0.0080% 1 2 01 22-Feb-03 Gallo 800 0.0000% 0.0000% 0.0000% 0 0 01 12-Mar-03 Gallo 1,652 0.0000% 0.0000% 0.0000% 0 0 01 22-Mar-03 MERCED R FISH FACIL. 17,400 0.0000% 0.0000% 0.0000% 0 0 01 26-Mar-03 Gallo 20,500 0.0000% 0.0000% 0.0000% 0 0 01 2-Apr-03 Hagaman Park 0 0.0935% 0.0752% 0.0012% 0 0 01 2-Apr-03 Henderson Park 5,000 0.0935% 0.0752% 0.0012% 5 4 01 3-Apr-03 Gallo 2,000 0.0935% 0.0752% 0.0012% 2 2 01 3-Apr-03 MERCED R FISH FACIL. 20,800 0.0935% 0.0752% 0.0012% 19 16 01 3-Apr-03 Ratzlaff 3,035 0.0935% 0.0752% 0.0012% 3 2 01 3-Apr-03 Robinson Ranch 3,000 0.0935% 0.0752% 0.0012% 3 2 01 4-Apr-03 MERCED R FISH FACIL. 19,800 0.0938% 0.0755% 0.0012% 19 15 01 5-Apr-03 MERCED R FISH FACIL. 47,400 0.0951% 0.0765% 0.0012% 45 36 195
ReleaseLocationCode<strong>Merced</strong> River Hatchery<strong>Merced</strong> Recovery Rates EscapementTotalNumberReleased Age 2 Age 3 Age 4 Age 2 Age 3 Age 4DateReleased Release Location1 5-Apr-03 Shaffer Bridge 21,375 0.0951% 0.0765% 0.0012% 20 16 01 6-Apr-03 Shaffer Bridge 26,250 0.0981% 0.0789% 0.0012% 26 21 01 8-Apr-03 Hagaman Park 2,101 0.1112% 0.0894% 0.0014% 2 2 01 13-Apr-03 MERCED R FISH FACIL. 11,625 0.1327% 0.1068% 0.0016% 15 12 01 14-Apr-03 MERCED R FISH FACIL. 10,000 0.1320% 0.1062% 0.0016% 13 11 01 15-Apr-03 Hagaman Park 2,000 0.1313% 0.1056% 0.0016% 3 2 01 15-Apr-03 Henderson Park 5,000 0.1313% 0.1056% 0.0016% 7 5 01 16-Apr-03 Gallo 2,000 0.1302% 0.1048% 0.0016% 3 2 01 16-Apr-03 Ratzlaff 3,010 0.1302% 0.1048% 0.0016% 4 3 01 16-Apr-03 Robinson Ranch 3,000 0.1302% 0.1048% 0.0016% 4 3 01 22-Apr-03 Hagaman Park 2,040 0.1155% 0.0929% 0.0014% 2 2 01 23-Apr-03 MERCED R FISH FACIL. 10,209 0.1151% 0.0926% 0.0014% 12 9 01 24-Apr-03 Henderson Park 5,000 0.1152% 0.0926% 0.0014% 6 5 01 25-Apr-03 Gallo 2,000 0.1160% 0.0933% 0.0014% 2 2 01 25-Apr-03 Ratzlaff 3,000 0.1160% 0.0933% 0.0014% 3 3 01 25-Apr-03 Robinson Ranch 3,000 0.1160% 0.0933% 0.0014% 3 3 01 29-Apr-03 Hagaman Park 2,016 0.1524% 0.1226% 0.0019% 3 2 01 30-Apr-03 MERCED R FISH FACIL. 1,807 0.1736% 0.1397% 0.0021% 3 3 01 2-May-03 Hagaman Park 2,021 0.2109% 0.1697% 0.0026% 4 3 01 5-May-03 MERCED R FISH FACIL. 9,979 0.2218% 0.1785% 0.0027% 22 18 01 6-May-03 Hagaman Park 2,015 0.2148% 0.1728% 0.0027% 4 3 01 6-May-03 Henderson Park 5,017 0.2148% 0.1728% 0.0027% 11 9 01 7-May-03 Gallo 2,185 0.1991% 0.1602% 0.0025% 4 4 01 7-May-03 Ratzlaff 3,000 0.1991% 0.1602% 0.0025% 6 5 01 7-May-03 Robinson Ranch 3,000 0.1991% 0.1602% 0.0025% 6 5 01 12-May-03 MERCED R FISH FACIL. 43,100 0.1005% 0.0808% 0.0012% 43 35 11 13-May-03 Hagaman Park 2,009 0.0954% 0.0768% 0.0012% 2 2 02 4-Apr-03 MOSSDALE 2,000 0.0326% 0.0653% 0.0053% 1 1 02 10-Apr-03 MOSSDALE 5,044 0.0333% 0.0662% 0.0053% 2 3 096
ReleaseLocationCode<strong>Merced</strong> River Hatchery<strong>Merced</strong> Recovery Rates EscapementTotalNumberReleased Age 2 Age 3 Age 4 Age 2 Age 3 Age 4DateReleased Release Location2 18-Apr-03 MOSSDALE 2,000 0.0351% 0.0686% 0.0055% 1 1 02 22-Apr-03 Old River Barrier 6,015 0.0350% 0.0685% 0.0055% 2 4 02 24-Apr-03 MOSSDALE 5,000 0.0350% 0.0685% 0.0055% 2 3 02 29-Apr-03 Old River Barrier 12,043 0.0353% 0.0689% 0.0055% 4 8 12 2-May-03 MOSSDALE 2,000 0.0352% 0.0688% 0.0055% 1 1 02 9-May-03 MOSSDALE 5,060 0.0348% 0.0683% 0.0054% 2 3 02 16-May-03 MOSSDALE 2,000 0.0330% 0.0658% 0.0053% 1 1 02 23-May-03 MOSSDALE 5,000 0.0324% 0.0651% 0.0053% 2 3 01 5-Apr-04 MERCED R FISH FACIL. 10,200 0.0663% 0.0109% 0.0050% 7 1 11 6-Apr-04 Henderson Park 5,000 0.0672% 0.0111% 0.0051% 3 1 01 7-Apr-04 Gallo 2,000 0.0692% 0.0114% 0.0052% 1 0 01 7-Apr-04 Ratzlaff 3,128 0.0692% 0.0114% 0.0052% 2 0 01 7-Apr-04 Robinson Ranch 3,000 0.0692% 0.0114% 0.0052% 2 0 01 19-Apr-04 MERCED R FISH FACIL. 10,200 0.0916% 0.0151% 0.0069% 9 2 11 20-Apr-04 Henderson Park 5,016 0.0967% 0.0159% 0.0073% 5 1 01 21-Apr-04 Gallo 2,032 0.1026% 0.0169% 0.0077% 2 0 01 21-Apr-04 Ratzlaff 3,057 0.1026% 0.0169% 0.0077% 3 1 01 21-Apr-04 Robinson Ranch 3,003 0.1026% 0.0169% 0.0077% 3 1 01 3-May-04 MERCED R FISH FACIL. 10,200 0.1793% 0.0295% 0.0135% 18 3 11 4-May-04 Henderson Park 5,010 0.1781% 0.0293% 0.0134% 9 1 11 5-May-04 Gallo 2,010 0.1748% 0.0287% 0.0132% 4 1 01 5-May-04 MERCED R FISH FACIL. 165,430 0.1748% 0.0287% 0.0132% 289 48 221 5-May-04 Ratzlaff 3,032 0.1748% 0.0287% 0.0132% 5 1 01 5-May-04 Robinson Ranch 3,027 0.1748% 0.0287% 0.0132% 5 1 01 17-May-04 MERCED R FISH FACIL. 10,200 0.0660% 0.0109% 0.0050% 7 1 11 18-May-04 Henderson Park 5,017 0.0656% 0.0108% 0.0049% 3 1 01 19-May-04 Gallo 2,000 0.0654% 0.0108% 0.0049% 1 0 01 19-May-04 MERCED R FISH FACIL. 94,980 0.0654% 0.0108% 0.0049% 62 10 51 19-May-04 Ratzlaff 3,003 0.0654% 0.0108% 0.0049% 2 0 097
ReleaseLocationCode<strong>Merced</strong> River Hatchery<strong>Merced</strong> Recovery Rates EscapementTotalNumberReleased Age 2 Age 3 Age 4 Age 2 Age 3 Age 4DateReleased Release Location1 19-May-04 Robinson Ranch 3,017 0.0654% 0.0108% 0.0049% 2 0 02 9-Apr-04 MOSSDALE 2,010 0.0000% 0.0000% 0.0050% 0 0 02 16-Apr-04 MOSSDALE 5,016 0.0000% 0.0000% 0.0051% 0 0 02 21-Apr-04 MOSSDALE 2,007 0.0000% 0.0000% 0.0051% 0 0 02 29-Apr-04 MOSSDALE 5,009 0.0000% 0.0000% 0.0051% 0 0 02 7-May-04 MOSSDALE 2,039 0.0000% 0.0000% 0.0051% 0 0 02 13-May-04 MOSSDALE 5,008 0.0000% 0.0000% 0.0051% 0 0 02 20-May-04 MOSSDALE 2,029 0.0000% 0.0000% 0.0049% 0 0 02 28-May-04 MOSSDALE 2,000 0.0000% 0.0000% 0.0049% 0 0 01 5-Apr-05 MERCED R FISH FACIL. 7,565 0.0000% 0.0000% 0.0000% 0 0 01 18-Apr-05 MERCED R FISH FACIL. 983 0.0000% 0.0000% 0.0000% 0 0 01 10-May-05 MERCED R FISH FACIL. 10,600 0.0000% 0.0000% 0.0000% 0 0 01 Apr-Jun 2005 Gallo 10,144 0.0000% 0.0000% 0.0000% 0 0 01Apr-May2005 Henderson Park 20,019 0.0000% 0.0000% 0.0000% 0 0 0Apr-May2005 Robinson Ranch 12,016 0.0000% 0.0000% 0.0000% 0 0 011 18-Apr-06 <strong>Merced</strong> River 427 0 0 01 24-Apr-06 <strong>Merced</strong> River 311 0 0 01 25-May-06 <strong>Merced</strong> River 73,000 0 0 01 1-Jun-06 <strong>Merced</strong> River 57,000 0 0 01 2-Jun-06 <strong>Merced</strong> River 61,097 0 0 01 8-Jun-06 <strong>Merced</strong> River 18,500 0 0 01 19-Jun-06 <strong>Merced</strong> River 8,215 0 0 02 6-Apr-06 San Joaquin River 2,062 0 0 02 20-Apr-06 San Joaquin River 5,000 0 0 02 27-Apr-06 San Joaquin River 5,041 0 0 02 3-May-06 San Joaquin River 5,000 0 0 02 4-May-06 San Joaquin River 2,000 0 0 02 11-May-06 San Joaquin River 7,000 0 0 098
ReleaseLocationCode<strong>Merced</strong> River Hatchery<strong>Merced</strong> Recovery Rates EscapementTotalNumberReleased Age 2 Age 3 Age 4 Age 2 Age 3 Age 4DateReleased Release Location2 18-May-06 San Joaquin River 7,000 0 0 02 25-May-06 San Joaquin River 5,000 0 0 02 1-Jun-06 San Joaquin River 5,000 0 0 02 8-Jun-06 San Joaquin River 5,000 0 0 099
ReleaseLocationCodeNimbus Fish Hatchery, American River<strong>Merced</strong> Recovery RatesEscapementTotalNumberReleased Age 2 Age 3 Age 4 Age 2 Age 3 Age 4DateReleasedRelease Location1 1-Jan-78 NFH 191,520 0 0 01 1-Apr-78 NFH 138,600 0 0 02 1-Apr-78 RIO VISTA 1,810,750 0 0 02 1-May-78 RIO VISTA 325,070 0 0 02 1-Jun-78 RIO VISTA 2,552,025 0 0 02 1-Oct-78 RIO VISTA 107,380 0 0 02 1-Nov-78 RIO VISTA 121,660 0 0 01 1-Jan-79 NFH 352,500 0 0 01 1-Apr-79 NFH 510,724 0 0 01 1-Jun-79 NFH 18,375 0 0 02 1-Apr-79 RIO VISTA 864,735 0 0 02 1-May-79 RIO VISTA 2,860,120 0 0 02 1-Jun-79 RIO VISTA 2,330,700 0 0 02 1-Sep-79 RIO VISTA 150,960 0 0 02 1-Oct-79 RIO VISTA 116,500 0 0 01 1-Feb-80 NFH 2,131,767 0 0 01 1-Mar-80 NFH 326,388 0 0 01 1-Apr-80 NFH 301,003 0 0 02 1-Jun-80 RIO VISTA 3,544,795 0 0 03.2 1-Sep-80 BENICIA 270,281 0.0000% 0.0000% 0.0000% 0 0 01 1-Jan-81 NFH 4,360,140 0 0 01 1-Feb-81 NFH 6,485,377 0 0 01 1-Mar-81 Bear River 100,050 0 0 01 1-Dec-80 NFH 1,510,292 0 0 03.2 1-Apr-81 BENICIA 335,699 0.0000% 0.0057% 0.0000% 0 19 03.2 1-Apr-81 Pittsburg 1,536,048 0.0000% 0.0055% 0.0000% 0 85 0100
ReleaseLocationCodeNimbus Fish Hatchery, American River<strong>Merced</strong> Recovery RatesEscapementTotalNumberReleased Age 2 Age 3 Age 4 Age 2 Age 3 Age 4DateReleasedRelease Location3.2 1-May-81 BENICIA 877,820 0.0000% 0.0066% 0.0000% 0 58 03.2 1-Jun-81 BENICIA 1,337,250 0.0000% 0.0063% 0.0000% 0 84 03.2 1-Jul-81 BENICIA 1,739,360 0.0000% 0.0168% 0.0000% 0 293 01 1-Jan-82 NFH 2,557,676 0 0 01 1-Feb-82 Bear River 135,000 0 0 01 1-Feb-82 Cosumnes River 100,000 0 0 01 1-Feb-82 Doty Ravine Creek, Auburn & Coon Creek 94,800 0 0 01 1-Feb-82 NFH 2,077,112 0 0 01 1-Dec-81 NFH 3,100,896 0 0 02 1-May-82 RIO VISTA 727,925 0 0 02 1-Jun-82 RIO VISTA 1,149,000 0 0 03.2 1-Jul-82 BENICIA 1,458,625 0.0000% 0.0012% 0.0000% 0 18 03.2 1-Aug-82 BENICIA 1,457,905 0.0000% 0.0014% 0.0000% 0 20 01 1-Jan-83 American River 1,141,693 0 0 01 1-Feb-83 American River 475,492 0 0 01 1-Mar-83 American River 364,048 0 0 01 1-Apr-83 American River 971,612 0 0 01 1-Dec-82 Auburn Ravine Creek 86,432 0 0 01 1-Dec-82 Bear River 331,726 0 0 01 1-Dec-82 Cache Creek 167,020 0 0 01 1-Dec-82 Calaveras River 190,880 0 0 01 1-Dec-82 COON CREEK 100,640 0 0 01 1-Dec-82 Cosumnes River 599,040 0 0 01 1-Dec-82 Doty Ravine Creek 50,912 0 0 01 1-Dec-82 Dry Creek 223,449 0 0 01 1-Dec-82 MOKELUMNE RIVER 548,780 0 0 01 1-Dec-82 Putah Creek 158,788 0 0 0101
ReleaseLocationCodeNimbus Fish Hatchery, American River<strong>Merced</strong> Recovery RatesEscapementTotalNumberReleased Age 2 Age 3 Age 4 Age 2 Age 3 Age 4DateReleasedRelease Location1 1-Dec-82 Rancheria Creek 32,211 0 0 01 1-Dec-82 Secret Ravine Creek 61,568 0 0 01 1-Dec-82 Sutter Creek 31,018 0 0 03.2 1-Apr-83 BENICIA 615,000 0.0000% 0.0006% 0.0000% 0 4 03.2 1-Apr-83 Vallejo 1,012,500 0.0000% 0.0006% 0.0000% 0 6 03.2 1-May-83 BENICIA 391,400 0.0000% 0.0006% 0.0000% 0 2 03.2 1-Jun-83 BENICIA 603,300 0.0000% 0.0007% 0.0000% 0 4 03.2 1-Jul-83 BENICIA 1,915,200 0.0000% 0.0007% 0.0000% 0 13 03.2 1-Aug-83 BENICIA 0 0.0000% 0.0006% 0.0000% 0 0 03.2 1-Aug-83 Berkeley Marina 0 0.0000% 0.0006% 0.0000% 0 0 03.2 1-Aug-83 PORT CHICAGO 0 0.0000% 0.0006% 0.0000% 0 0 01 1-Mar-84 NFH 441,000 0 0 01 1-Apr-84 NFH 900,335 0 0 01 1-Jun-84 NFH 381,250 0 0 03.2 1-May-84 BENICIA 180,000 0.0000% 0.0032% 0.0000% 0 6 03.2 1-Jun-84 BENICIA 862,650 0.0000% 0.0032% 0.0000% 0 28 03.2 1-Jul-84 BENICIA 2,826,300 0.0000% 0.0034% 0.0000% 0 96 03.2 1-Jul-84 Berkeley Marina 0 0 0 03.2 1-Jul-84 FORT BAKER MINOR PT 0 0 0 03.2 1-Jul-84 PORT CHICAGO 0 0 0 01 1-Jan-85 NFH 5,350,800 0 0 01 1-Feb-85 NFH 3,407,900 0 0 01 1-Mar-85 NFH 531,680 0 0 02 1-Apr-85 Garcia Bend 424,800 0 0 02 1-May-85 Garcia Bend 285,600 0 0 03.2 1-May-85 BENICIA 692,400 0.0000% 0.0016% 0.0000% 0 11 03.2 1-Jun-85 BENICIA 2,987,700 0.0000% 0.0016% 0.0000% 0 47 0102
ReleaseLocationCodeNimbus Fish Hatchery, American River<strong>Merced</strong> Recovery RatesEscapementTotalNumberReleased Age 2 Age 3 Age 4 Age 2 Age 3 Age 4DateReleasedRelease Location3.2 1-Jul-85 BENICIA 820,300 0.0000% 0.0016% 0.0000% 0 13 01-Jul-85 Berkeley Marina 0 0.0000% 0.0013% 0.0000% 0 0 02 1-Jan-86 DISCOVERY PARK 452,915 0 0 02 1-Jan-86 Garcia Bend 386,700 0 0 02 1-Feb-86 DISCOVERY PARK 3,668,925 0 0 02 1-Mar-86 Garcia Bend 523,180 0 0 03.2 1-May-86 BENICIA 497,790 0.0000% 0.0018% 0.0000% 0 9 03.2 1-Jun-86 BENICIA 2,850,750 0.0000% 0.0019% 0.0000% 0 53 03.2 1-Jul-86 BENICIA 1,538,950 0.0000% 0.0020% 0.0000% 0 31 01 1-Jan-87 Cosumnes River 216,000 0 0 01 1-Jan-87 NFH 1,038,000 0 0 01 1-Feb-87 NFH 647,480 0 0 02 1-Apr-87 DISCOVERY PARK 401,600 0 0 03.2 1-May-87 BENICIA 1,310,975 0.0000% 0.0000% 0.0000% 0 0 03.2 1-Jun-87 BENICIA 2,594,000 0.0000% 0.0000% 0.0000% 0 0 03.2 1-Jul-87 BENICIA 271,050 0.0000% 0.0000% 0.0000% 0 0 02 1-Mar-88 DISCOVERY PARK 410,710 0 0 02 1-Mar-88 Garcia Bend 345,260 0 0 02 1-Apr-88 DISCOVERY PARK 96,600 0 0 02 1-Apr-88 Garcia Bend 116,600 0 0 02 1-Apr-88 MILLER PARK 285,000 0 0 02 1-Jun-88 DISCOVERY PARK 145,000 0 0 03.2 1-May-88 BENICIA 264,000 0.0000% 0.0000% 0.0000% 0 0 03.2 1-Jun-88 BENICIA 1,183,593 0.0000% 0.0000% 0.0000% 0 0 03.2 1-Jun-88 Mare Island 1,364,200 0.0000% 0.0000% 0.0000% 0 0 03.2 1-Jul-88 BENICIA 580,700 0.0000% 0.0000% 0.0000% 0 0 02 1-Feb-89 DISCOVERY PARK 170,752 0 0 0103
ReleaseLocationCodeNimbus Fish Hatchery, American River<strong>Merced</strong> Recovery RatesEscapementTotalNumberReleased Age 2 Age 3 Age 4 Age 2 Age 3 Age 4DateReleasedRelease Location2 1-Feb-89 Garcia Bend 1,083,740 0 0 02 1-Feb-89 MILLER PARK 529,250 0 0 02 1-Mar-89 DISCOVERY PARK 682,020 0 0 02 1-Mar-89 MILLER PARK 1,662,387 0 0 02 1-Jun-89 Garcia Bend 99,400 0 0 03.2 1-Jan-89 Suisun 815,200 0.0000% 0.0000% 0.0000% 0 0 03.2 1-Jun-89 BENICIA 657,314 0.0000% 0.0000% 0.0010% 0 0 73.2 1-Jul-89 BENICIA 2,629,870 0.0000% 0.0000% 0.0010% 0 0 261 1-Jan-90 American River 3,123,500 0 0 01 1-Jan-90 AMERICANR-COON CREEK 124,500 0 0 01 1-Jan-90 Auburn Ravine Creek 124,500 0 0 01 1-Jan-90 Bear River 273,800 0 0 01 1-Jan-90 Cosumnes River 522,800 0 0 01 1-Jan-90 Dry Creek 124,500 0 0 01 1-Feb-90 American River 759,516 0 0 01 1-Mar-90 American River 575,230 0 0 01 1-Apr-90 American River 846,265 0 0 01 1-May-90 American River 624,500 0 0 03.2 1-May-90 BENICIA 338,800 0.0000% 0.0000% 0.0000% 0 0 03.2 1-Jun-90 BENICIA 195,718 0.0000% 0.0000% 0.0000% 0 0 03.2 1-Jun-90 Maritime Acad. 376,200 0.0000% 0.0000% 0.0000% 0 0 03.2 1-Jul-90 BENICIA 1,001,650 0.0000% 0.0000% 0.0000% 0 0 01 1-Jan-91 Secret Ravine Creek 26,640 0 0 01 1-Feb-91 Auburn Ravine Creek 17,200 0 0 01 1-Mar-91 AMERICANR-COON CREEK 99,008 0 0 01 1-Mar-91 Cosumnes River 97,920 0 0 01 1-Mar-91 Dry Creek 197,352 0 0 0104
ReleaseLocationCodeNimbus Fish Hatchery, American River<strong>Merced</strong> Recovery RatesEscapementTotalNumberReleased Age 2 Age 3 Age 4 Age 2 Age 3 Age 4DateReleasedRelease Location2 1-Mar-91 Garcia Bend 96,000 0 0 02 1-Mar-91 MILLER PARK 1,174,500 0 0 02 1-Apr-91 Garcia Bend 848,835 0 0 02 1-Apr-91 MILLER PARK 148,750 0 0 02 1-May-91 RIO VISTA 1,543,000 0 0 03.2 1-May-91 BENICIA 1,029,300 0.0000% 0.0029% 0.0027% 0 30 283.2 1-Jun-91 BENICIA 1,592,700 0.0000% 0.0031% 0.0027% 0 49 433.2 1-Jul-91 BENICIA 443,100 0.0000% 0.0032% 0.0027% 0 14 121 1-Feb-92 AMERICANR-COON CREEK 114,600 0 0 01 1-Feb-92 Auburn Ravine Creek 101,612 0 0 01 1-Mar-92 Bear River 118,400 0 0 01 1-Mar-92 Cosumnes River 514,000 0 0 01 1-Mar-92 Dry Creek 118,400 0 0 02 1-Jan-92 MILLER PARK 414,000 0 0 02 1-Feb-92 MILLER PARK 229,200 0 0 02 1-Mar-92 Garcia Bend 3,098,500 0 0 02 1-Apr-92 Garcia Bend 1,844,990 0 0 03.2 1-May-92 BENICIA 2,664,950 0.0000% 0.0009% 0.0000% 0 24 03.2 1-Jun-92 BENICIA 1,557,000 0.0000% 0.0010% 0.0000% 0 15 03.2 1-Jul-92 BENICIA 177,200 0.0000% 0.0011% 0.0000% 0 2 01 1-Feb-93 AMERICANR-COON CREEK 100,190 0 0 01 1-Feb-93 Auburn Ravine Creek 101,190 0 0 01 1-Feb-93 Cosumnes River 200,380 0 0 01 1-Feb-93 Dry Creek 100,190 0 0 01 1-Feb-93 Miners Ravine Creek 50,095 0 0 01 1-Mar-93 Secret Ravine Creek 51,660 0 0 02 1-Feb-93 MILLER PARK 774,860 0 0 0105
ReleaseLocationCodeNimbus Fish Hatchery, American River<strong>Merced</strong> Recovery RatesEscapementTotalNumberReleased Age 2 Age 3 Age 4 Age 2 Age 3 Age 4DateReleasedRelease Location2 1-Mar-93 MILLER PARK 2,534,800 0 0 02 1-Apr-93 MILLER PARK 1,312,550 0 0 02 1-Jun-93 RIO VISTA 449,275 0 0 02 1-Jun-93 Sacramento River 2,262,200 0 0 03.2 1-Jul-93 BENICIA 490,600 0.0000% 0.0018% 0.0000% 0 9 0San Francisco Bay, San Yerba Buena NavalYard 110,000 0.0000% 0.0019% 0.0000% 0 2 03.2 1-Jul-933.2 1-Jul-93 WICKLAND OIL NET PEN 639,800 0.0000% 0.0018% 0.0000% 0 12 03.2 1-Aug-93 BENICIA 362,000 0.0000% 0.0019% 0.0000% 0 7 03.2 1-Aug-93 WICKLAND OIL NET PEN 604,200 0.0000% 0.0019% 0.0000% 0 11 01 1-Jan-94 Cosumnes River 206,800 0 0 01 1-Feb-94 AMERICANR-COON CREEK 107,800 0 0 01 1-Feb-94 Auburn Ravine Creek 107,800 0 0 01 1-Feb-94 Dry Creek 107,800 0 0 01 1-Feb-94 Miners Ravine Creek 53,900 0 0 01 1-Feb-94 Secret Ravine Creek 53,900 0 0 02 1-Jan-94 MILLER PARK 1,998,700 0 0 02 1-Feb-94 MILLER PARK 1,105,500 0 0 02 1-Apr-94 MILLER PARK 713,500 0 0 02 1-May-94 MILLER PARK 478,600 0 0 03.2 1-Jun-94 BENICIA 1,565,900 0.0021% 0.0023% 0.0001% 34 36 2San Francisco Bay, San Yerba Buena NavalYard 78,000 0.0021% 0.0024% 0.0001% 2 2 03.2 1-Jun-943.2 1-Jun-94 WICKLAND OIL NET PEN 2,509,100 0.0021% 0.0023% 0.0001% 54 58 33.2 1-Jul-94 BENICIA 36,600 0.0021% 0.0023% 0.0001% 1 1 01 1-Feb-95 AMERICANR-COON CREEK 99,840 0 0 01 1-Feb-95 Auburn Ravine Creek 99,840 0 0 01 1-Feb-95 Cosumnes River 200,720 0 0 0106
ReleaseLocationCodeNimbus Fish Hatchery, American River<strong>Merced</strong> Recovery RatesEscapementTotalNumberReleased Age 2 Age 3 Age 4 Age 2 Age 3 Age 4DateReleasedRelease Location1 1-Feb-95 Dry Creek 100,880 0 0 01 1-Feb-95 Miners Ravine Creek 49,920 0 0 01 1-Feb-95 Secret Ravine Creek 49,920 0 0 02 1-Jan-95 MILLER PARK 1,603,640 0 0 02 1-Feb-95 Garcia Bend 3,903,475 0 0 02 1-Mar-95 MILLER PARK 591,008 0 0 03.2 1-Jun-95 BENICIA 874,450 0.0000% 0.0011% 0.0002% 0 10 23.2 1-Jun-95San Francisco Bay, San Yerba Buena NavalYard 484,000 0.0000% 0.0011% 0.0002% 0 5 13.2 1-Jun-95 WICKLAND OIL NET PEN 973,650 0.0000% 0.0011% 0.0002% 0 11 23.2 1-Jul-95 BENICIA 187,000 0.0000% 0.0012% 0.0002% 0 2 0San Francisco Bay, San Yerba Buena NavalYard 204,000 0.0000% 0.0011% 0.0002% 0 2 03.2 1-Jul-953.2 1-Jul-95 WICKLAND OIL NET PEN 1,500,600 0.0000% 0.0011% 0.0002% 0 17 31 1-Jan-96 AMERICANR-COON CREEK 102,000 0 0 01 1-Jan-96 Auburn Ravine Creek 104,400 0 0 01 1-Jan-96 Cosumnes River 228,000 0 0 01 1-Jan-96 Dry Creek 102,000 0 0 01 1-Jan-96 Miners Ravine Creek 51,600 0 0 01 1-Jan-96 Secret Ravine Creek 51,600 0 0 02 1-Jan-96 MILLER PARK 1,934,400 0 0 02 1-Feb-96 MILLER PARK 2,149,301 0 0 03.2 1-May-96 BENICIA 538,600 0.0000% 0.0006% 0.0000% 0 3 0San Francisco Bay, San Yerba Buena NavalYard 253,000 0.0000% 0.0006% 0.0000% 0 1 03.2 1-May-963.2 1-May-96 WICKLAND OIL NET PEN 1,078,600 0.0000% 0.0006% 0.0000% 0 6 03.2 1-Jun-96 BENICIA 1,008,450 0.0000% 0.0006% 0.0000% 0 6 03.2 1-Jun-96 San Francisco Bay, San Yerba Buena Naval 67,200 0.0000% 0.0006% 0.0000% 0 0 0107
ReleaseLocationCodeDateReleasedYardRelease LocationNimbus Fish Hatchery, American River<strong>Merced</strong> Recovery RatesEscapementTotalNumberReleased Age 2 Age 3 Age 4 Age 2 Age 3 Age 43.2 1-Jun-96 WICKLAND OIL NET PEN 1,084,600 0.0000% 0.0006% 0.0000% 0 6 01 1-Feb-97 AMERICANR-COON CREEK 102,096 0 0 01 1-Feb-97 Auburn Ravine Creek 102,600 0 0 01 1-Feb-97 Dry Creek 110,040 0 0 01 1-Feb-97 Miners Ravine Creek 55,836 0 0 01 1-Feb-97 Secret Ravine Creek 50,268 0 0 02 1-Jan-97 MILLER PARK 2,011,880 0 0 02 1-Feb-97 Garcia Bend 1,066,540 0 0 02 1-Feb-97 MILLER PARK 797,980 0 0 02 1-Mar-97 Garcia Bend 1,249,036 0 0 03.2 1-May-97 BENICIA 367,600 0.0000% 0.0028% 0.0000% 0 10 03.2 1-May-97 WICKLAND OIL NET PEN 1,003,800 0.0000% 0.0028% 0.0000% 0 28 03.2 1-Jun-97 WICKLAND OIL NET PEN 2,683,400 0.0000% 0.0027% 0.0000% 0 73 01 1-Mar-98 AMERICANR-COON CREEK 120,450 0 0 01 1-Mar-98 Auburn Ravine Creek 126,900 0 0 01 1-Mar-98 Dry Creek 366,700 0 0 02 1-Mar-98 Garcia Bend 1,253,570 0 0 03.2 1-May-98 BENICIA 570,400 0.0000% 0.0009% 0.0000% 0 5 03.2 1-May-98 WICKLAND OIL NET PEN 372,000 0.0000% 0.0009% 0.0000% 0 3 03.2 1-Jun-98 Bennett's Marina 132,000 0.0000% 0.0009% 0.0000% 0 1 03.2 1-Jun-98 SF-San Francisco Bay 132,000 0.0000% 0.0009% 0.0000% 0 1 03.2 1-Jun-98 TIBURON NET PENS 52,000 0.0000% 0.0010% 0.0000% 0 1 03.2 1-Jun-98 WICKLAND OIL NET PEN 2,693,254 0.0000% 0.0010% 0.0000% 0 26 01 1-Apr-99 AMERICANR-COON CREEK 118,400 0 0 01 1-Apr-99 Auburn Ravine Creek 100,750 0 0 01 1-Apr-99 Dry Creek 321,720 0 0 0108
ReleaseLocationCodeNimbus Fish Hatchery, American River<strong>Merced</strong> Recovery RatesEscapementTotalNumberReleased Age 2 Age 3 Age 4 Age 2 Age 3 Age 4DateReleasedRelease Location3.2 1-May-99 BENICIA 120,000 0.0030% 0.0033% 0.0000% 4 4 03.2 1-May-99 WICKLAND OIL NET PEN 896,900 0.0030% 0.0032% 0.0000% 27 29 03.2 1-Jun-99 BENICIA 509,208 0.0030% 0.0032% 0.0000% 15 16 03.2 1-Jun-99 SF-San Francisco Bay 217,500 0.0030% 0.0034% 0.0000% 7 7 03.2 1-Jun-99 TIBURON NET PENS 52,008 0.0030% 0.0037% 0.0000% 2 2 03.2 1-Jun-99 WICKLAND OIL NET PEN 2,741,792 0.0030% 0.0032% 0.0000% 83 89 03.2 1-May-00 BENICIA 356,200 0.0000% 0.0008% 0.0000% 0 3 03.2 1-May-00 WICKLAND OIL NET PEN 1,735,500 0.0000% 0.0008% 0.0000% 0 15 03.2 1-Jun-00 WICKLAND OIL NET PEN 1,760,000 0.0000% 0.0008% 0.0000% 0 15 03.2 1-Jun-02 TIBURON NET PENS 50,400 0.0024% 0.0020% 0.0007% 1 1 03.2 1-Jun-02 WICKLAND OIL NET PEN 1,493,073 0.0024% 0.0020% 0.0007% 36 30 113.2 1-Jul-02 WICKLAND OIL NET PEN 1,736,850 0.0024% 0.0020% 0.0007% 42 35 123.2 1-May-03 WICKLAND OIL NET PEN 480,000 0.0009% 0.0015% 0.0000% 4 7 03.2 1-Jun-03 Treasure Island USCG Station 502,300 0.0009% 0.0015% 0.0000% 4 7 03.2 1-Jun-03 WICKLAND OIL NET PEN 3,379,000 0.0009% 0.0015% 0.0000% 30 49 03.2 1-Jun-04 SAN PABLO BAY 4,693,466 0.0000% 0.0014% 0.0000% 0 68 03.2 25-May-05 WICKLAND OIL TERMINAL 1,854,000 0 0 03.2 26-May-05 WICKLAND OIL TERMINAL 152,500 0 0 03.2 2-Jun-05 WICKLAND OIL TERMINAL 290,400 0 0 03.2 3-Jun-05 WICKLAND OIL TERMINAL 154,100 0 0 03.2 6-Jun-05 WICKLAND OIL TERMINAL 142,600 0 0 03.2 7-Jun-05 VALLEJO PUBLIC BOAT RAMP 138,000 0 0 03.2 8-Jun-05 WICKLAND OIL TERMINAL 400,200 0 0 03.2 9-Jun-05 WICKLAND OIL TERMINAL 253,700 0 0 03.2 10-Jun-05 WICKLAND OIL TERMINAL 143,000 0 0 03.2 13-Jun-05 WICKLAND OIL TERMINAL 289,800 0 0 03.2 20-Jun-05 WICKLAND OIL TERMINAL 524,400 0 0 0109
ReleaseLocationCodeNimbus Fish Hatchery, American River<strong>Merced</strong> Recovery RatesEscapementTotalNumberReleased Age 2 Age 3 Age 4 Age 2 Age 3 Age 4DateReleasedRelease Location3.2 22-Jun-05 WICKLAND OIL TERMINAL 91,300 0 0 03.2 2-Jun-06 WICKLAND OIL TERMINAL 136,000 0 0 03.2 5-Jun-06 San Francisco Bay 271,400 0 0 03.2 6-Jun-06 San Francisco Bay 239,200 0 0 03.2 7-Jun-06 San Francisco Bay 239,200 0 0 03.2 8-Jun-06 San Francisco Bay 253,000 0 0 03.2 9-Jun-06 San Francisco Bay 279,400 0 0 03.2 12-Jun-06 San Francisco Bay 276,000 0 0 03.2 13-Jun-06 San Francisco Bay 303,900 0 0 03.2 14-Jun-06 San Francisco Bay 294,400 0 0 03.2 15-Jun-06 San Francisco Bay 299,600 0 0 03.2 16-Jun-06 San Francisco Bay 321,500 0 0 03.2 19-Jun-06 San Francisco Bay 225,000 0 0 0110
111