U.S. Promotional Products Sales Decline in 2009 â Still Fare ... - PPAI
U.S. Promotional Products Sales Decline in 2009 â Still Fare ... - PPAI
U.S. Promotional Products Sales Decline in 2009 â Still Fare ... - PPAI

Create successful ePaper yourself
Turn your PDF publications into a flip-book with our unique Google optimized e-Paper software.
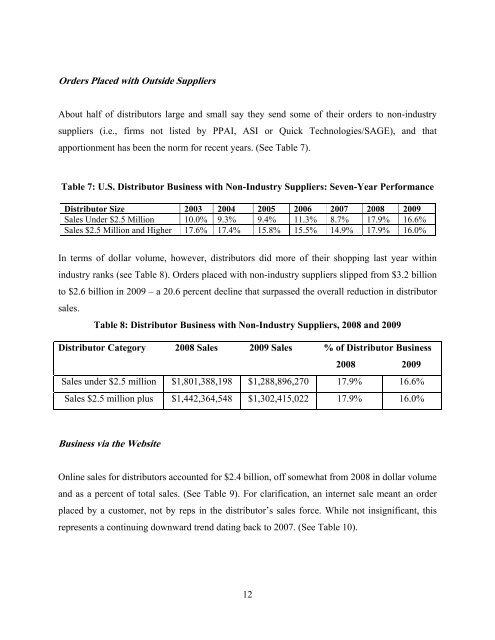
Orders Placed with Outside SuppliersAbout half of distributors large and small say they send some of their orders to non-<strong>in</strong>dustrysuppliers (i.e., firms not listed by <strong>PPAI</strong>, ASI or Quick Technologies/SAGE), and thatapportionment has been the norm for recent years. (See Table 7).Table 7: U.S. Distributor Bus<strong>in</strong>ess with Non-Industry Suppliers: Seven-Year PerformanceDistributor Size 2003 2004 2005 2006 2007 2008 <strong>2009</strong><strong>Sales</strong> Under $2.5 Million 10.0% 9.3% 9.4% 11.3% 8.7% 17.9% 16.6%<strong>Sales</strong> $2.5 Million and Higher 17.6% 17.4% 15.8% 15.5% 14.9% 17.9% 16.0%In terms of dollar volume, however, distributors did more of their shopp<strong>in</strong>g last year with<strong>in</strong><strong>in</strong>dustry ranks (see Table 8). Orders placed with non-<strong>in</strong>dustry suppliers slipped from $3.2 billionto $2.6 billion <strong>in</strong> <strong>2009</strong> – a 20.6 percent decl<strong>in</strong>e that surpassed the overall reduction <strong>in</strong> distributorsales.Table 8: Distributor Bus<strong>in</strong>ess with Non-Industry Suppliers, 2008 and <strong>2009</strong>Distributor Category 2008 <strong>Sales</strong> <strong>2009</strong> <strong>Sales</strong> % of Distributor Bus<strong>in</strong>ess2008 <strong>2009</strong><strong>Sales</strong> under $2.5 million $1,801,388,198 $1,288,896,270 17.9% 16.6%<strong>Sales</strong> $2.5 million plus $1,442,364,548 $1,302,415,022 17.9% 16.0%Bus<strong>in</strong>ess via the WebsiteOnl<strong>in</strong>e sales for distributors accounted for $2.4 billion, off somewhat from 2008 <strong>in</strong> dollar volumeand as a percent of total sales. (See Table 9). For clarification, an <strong>in</strong>ternet sale meant an orderplaced by a customer, not by reps <strong>in</strong> the distributor’s sales force. While not <strong>in</strong>significant, thisrepresents a cont<strong>in</strong>u<strong>in</strong>g downward trend dat<strong>in</strong>g back to 2007. (See Table 10).12