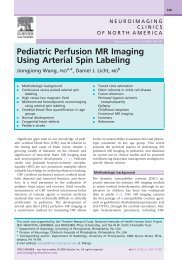
Arterial Spin Labeling Perfusion MRI Signal Processing Toolbox ...
Arterial Spin Labeling Perfusion MRI Signal Processing Toolbox ...
Arterial Spin Labeling Perfusion MRI Signal Processing Toolbox ...

Create successful ePaper yourself
Turn your PDF publications into a flip-book with our unique Google optimized e-Paper software.
Fig. 5.5. A completed parameter setting<br />
process showing how to use explicit M0csf<br />
for quantification.<br />
Fig. 5.6. Option for drawing an ROI.<br />
5.2 Command line<br />
The main function asl_perf_subtract<br />
can be also called in Matlab command<br />
line without involving any GUI if you<br />
know how to use all the arguments.<br />
The function prototype is defined as:<br />
When you select using a unique M0b for quantification and<br />
select “M0 image” in the questionnaire “Select an M0 image or<br />
input an M0 value”, you will see another option (see the bottom<br />
part of Fig. 5.6) to choose whether you will draw an ROI in the<br />
M0 image you selected to extract the M0i (M0csf or M0wm,<br />
depending on the option you choose in the purple ellipse in Fig.<br />
5.5) value or select an ROI mask image. If you choose “yes” for<br />
that item, you will see a popup window showing one slice of the<br />
selected M0 image (Fig. 5.7) and in Matlab command line, you<br />
can see instructions for choosing the image slice to be shown.<br />
The slice number has to be within 1 – maximum slice number of<br />
the M0 image. If you found a good slice easy for drawing the<br />
ROI, you can type 0 in Matlab command line to finish the slice<br />
selection process. Then you can start to draw an ROI in the<br />
popup window. For example, in Fig. 5.7, the ROI should be<br />
drawn in the ventricles. Double click to finish ROI drawing.<br />
Once you have all those parameters set up, asl_perf_subtract<br />
will start to calculate all the designated outputs like the<br />
perfusion difference signal, CBF, pseudo BOLD, mean<br />
perfusion difference, mean BOLD, mean CBF etc. All those<br />
outputs will be saved in the same folder as the source images.<br />
You will also get a text file saving the global perfusion<br />
difference and CBF signal (see next section for more details).<br />
Fig. 5.7. Choosing a good slice for drawing an ROI.<br />
16