BanksUnited Bank For Africa <strong>Plc</strong>Balance Sheet31 Mar 2013 31 Dec 2012 31 Dec 20113 Months - 1st Quarter 3 Months - 1st Quarter As % of Year End As % of Year End As % ofUSDm NGNbn Assets NGNbn Assets NGNbn AssetsAssetsA. Loans1. Residential Mortgage Loans n.a. n.a. - n.a. - n.a. -2. Other Mortgage Loans n.a. n.a. - n.a. - n.a. -3. Other Consumer/ Retail Loans n.a. n.a. - 111.4 4.90 91.2 4.754. Corporate & Commercial Loans 4,193.2 649.9 26.70 563.4 24.79 538.8 28.065. Other Loans n.a. n.a. - n.a. - n.a. -6. Less: Reserves for Impaired Loans/ NPLs 102.1 15.8 0.65 15.8 0.70 24.5 1.277. Net Loans 4,091.1 634.1 26.05 658.9 28.99 605.6 31.548. Gross Loans 4,193.2 649.9 26.70 674.7 29.69 630.1 32.819. Memo: Impaired Loans included above 0.0 0.0 0.00 13.4 0.59 16.9 0.8810. Memo: Loans at Fair Value included above n.a. n.a. - n.a. - n.a. -B. Other Earning Assets1. Loans and Advances to Banks 194.3 30.1 1.24 28.5 1.25 41.6 2.162. Reverse Repos and Cash Collateral n.a. n.a. - n.a. - n.a. -3. Trading Securities and at FV through Income 39.7 6.1 0.25 0.5 0.02 1.3 0.074. Derivatives n.a. n.a. - n.a. - n.a. -5. Available for Sale Securities 1,227.5 190.3 7.82 128.7 5.66 96.7 5.046. Held to Maturity Securities 3,512.7 544.5 22.37 552.2 24.29 625.6 32.577. At-equity Investments in Associates n.a. n.a. - n.a. - 10.4 0.548. Other Securities n.a. n.a. - n.a. - n.a. -9. Total Securities 4,779.8 740.9 30.43 681.3 29.97 734.0 38.2210. Memo: Government Securities included Above 1,607.8 249.2 10.24 645.6 28.40 656.3 34.1811. Memo: Total Securities Pledged 951.2 147.4 6.06 131.0 5.76 69.4 3.6112. Investments in Property n.a. n.a. - n.a. - n.a. -13. Insurance Assets n.a. n.a. - n.a. - n.a. -14. Other Earning Assets n.a. n.a. - n.a. - n.a. -15. Total Earning Assets 9,065.2 1,405.1 57.72 1,368.7 60.22 1,381.2 71.92C. Non-Earning Assets1. Cash and Due From Banks 5,811.8 900.8 37.00 714.1 31.42 434.2 22.612. Memo: Mandatory Reserves included above 780.4 121.0 4.97 119.7 5.27 81.8 4.263. Foreclosed Real Estate n.a. n.a. - n.a. - n.a. -4. Fixed Assets 448.7 69.6 2.86 70.7 3.11 55.6 2.905. Goodwill n.a. n.a. - 5.7 0.25 3.5 0.186. Other Intangibles 51.7 8.0 0.33 1.9 0.08 2.5 0.137. Current Tax Assets n.a. n.a. - n.a. - n.a. -8. Deferred Tax Assets 188.6 29.2 1.20 29.6 1.30 27.0 1.419. Discontinued Operations n.a. n.a. - 63.6 2.80 n.a. -10. Other Assets 139.6 21.6 0.89 18.6 0.82 16.5 0.8611. Total Assets 15,705.7 2,434.4 100.00 2,272.9 100.00 1,920.4 100.00Liabilities and EquityD. Interest-Bearing Liabilities1. Customer Deposits - Current 12,443.4 1,928.7 79.23 1,087.3 47.84 885.7 46.122. Customer Deposits - Savings n.a. n.a. - 285.4 12.56 247.2 12.873. Customer Deposits - Term n.a. n.a. - 347.4 15.28 313.0 16.304. Total Customer Deposits 12,443.4 1,928.7 79.23 1,720.0 75.67 1,445.8 75.295. Deposits from Banks 569.3 88.2 3.62 57.8 2.54 19.5 1.026. Repos and Cash Collateral n.a. n.a. - n.a. - n.a. -7. Other Deposits and Short-term Borrowings n.a. n.a. - 53.5 2.35 13.9 0.738. Total Deposits, Money Market and Short-term Funding 13,012.6 2,017.0 82.85 1,831.3 80.57 1,479.3 77.039. Senior Debt Maturing after 1 Year 681.3 105.6 4.34 61.0 2.68 123.1 6.4110. Subordinated Borrowing 346.3 53.7 2.20 53.7 2.36 53.5 2.7911. Other Funding n.a. n.a. - n.a. - 51.9 2.7012. Total Long Term Funding 1,027.6 159.3 6.54 114.7 5.05 228.5 11.9013. Derivatives 1.0 0.2 0.01 0.1 0.01 0.8 0.0414. Trading Liabilities n.a. n.a. - n.a. - n.a. -15. Total Funding 14,041.2 2,176.4 89.40 1,946.2 85.62 1,708.6 88.97E. Non-Interest Bearing Liabilities1. Fair Value Portion of Debt n.a. n.a. - n.a. - n.a. -2. Credit impairment reserves n.a. n.a. - n.a. - n.a. -3. Reserves for Pensions and Other n.a. n.a. - 0.1 0.01 0.1 0.004. Current Tax Liabilities 12.8 2.0 0.08 1.3 0.06 2.6 0.145. Deferred Tax Liabilities 0.4 0.1 0.00 0.1 0.00 0.0 0.006. Other Deferred Liabilities n.a. n.a. - n.a. - n.a. -7. Discontinued Operations n.a. n.a. - 51.5 2.27 n.a. -8. Insurance Liabilities n.a. n.a. - n.a. - n.a. -9. Other Liabilities 300.4 46.6 1.91 81.3 3.58 58.1 3.0310. Total Liabilities 14,354.8 2,225.0 91.40 2,080.5 91.53 1,769.5 92.14F. Hybrid Capital1. Pref. Shares and Hybrid Capital accounted for as Debt n.a. n.a. - n.a. - n.a. -2. Pref. Shares and Hybrid Capital accounted for as Equity n.a. n.a. - n.a. - n.a. -G. Equity1. Common Equity 1,011.1 156.7 6.44 141.2 6.21 108.3 5.642. Non-controlling Interest 25.5 4.0 0.16 3.4 0.15 3.6 0.193. Securities Revaluation Reserves 97.7 15.1 0.62 15.2 0.67 11.5 0.604. Foreign Exchange Revaluation Reserves (4.3) (0.7) (0.03) (1.5) (0.07) 1.6 0.085. Fixed Asset Revaluations and Other Accumulated OCI 220.9 34.2 1.41 34.2 1.51 26.0 1.356. Total Equity 1,350.9 209.4 8.60 192.5 8.47 150.9 7.867. Total Liabilities and Equity 15,705.7 2,434.4 100.00 2,272.9 100.00 1,920.4 100.008. Memo: Fitch Core Capital 1,299.2 201.4 8.27 165.5 7.28 131.2 6.839. Memo: Fitch Eligible Capital n.a. n.a. - n.a. - n.a. -United Bank For Africa <strong>Plc</strong>August 20134
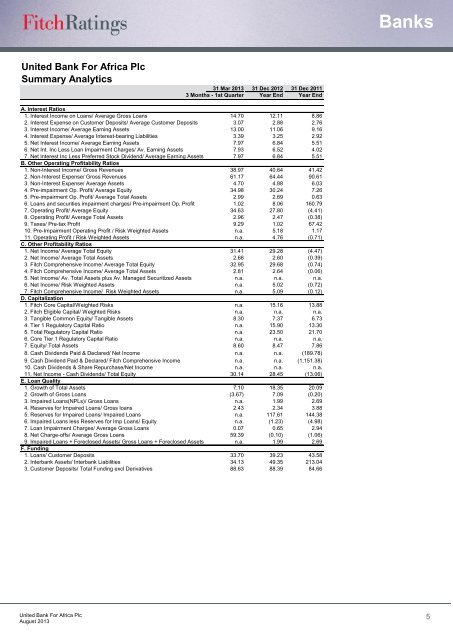
BanksUnited Bank For Africa <strong>Plc</strong>Summary Analytics31 Mar 2013 31 Dec 2012 31 Dec 20113 Months - 1st Quarter Year End Year EndA. Interest Ratios1. Interest Income on Loans/ Average Gross Loans 14.70 12.11 8.862. Interest Expense on Customer Deposits/ Average Customer Deposits 3.07 2.88 2.763. Interest Income/ Average Earning Assets 13.00 11.06 9.164. Interest Expense/ Average Interest-bearing Liabilities 3.39 3.25 2.925. Net Interest Income/ Average Earning Assets 7.97 6.84 5.516. Net Int. Inc Less Loan Impairment Charges/ Av. Earning Assets 7.93 6.52 4.027. Net Interest Inc Less Preferred Stock Dividend/ Average Earning Assets 7.97 6.84 5.51B. Other Operating Profitability Ratios1. Non-Interest Income/ Gross Revenues 38.97 40.64 41.422. Non-Interest Expense/ Gross Revenues 61.17 64.44 90.613. Non-Interest Expense/ Average Assets 4.70 4.88 6.034. Pre-impairment Op. Profit/ Average Equity 34.98 30.24 7.265. Pre-impairment Op. Profit/ Average Total Assets 2.99 2.69 0.636. Loans and securities impairment charges/ Pre-impairment Op. Profit 1.02 8.06 160.797. Operating Profit/ Average Equity 34.63 27.80 (4.41)8. Operating Profit/ Average Total Assets 2.96 2.47 (0.38)9. Taxes/ Pre-tax Profit 9.29 1.02 67.4210. Pre-Impairment Operating Profit / Risk Weighted Assets n.a. 5.18 1.1711. Operating Profit / Risk Weighted Assets n.a. 4.76 (0.71)C. Other Profitability Ratios1. Net Income/ Average Total Equity 31.41 29.28 (4.47)2. Net Income/ Average Total Assets 2.68 2.60 (0.39)3. Fitch Comprehensive Income/ Average Total Equity 32.95 29.68 (0.74)4. Fitch Comprehensive Income/ Average Total Assets 2.81 2.64 (0.06)5. Net Income/ Av. Total Assets plus Av. Managed Securitized Assets n.a. n.a. n.a.6. Net Income/ Risk Weighted Assets n.a. 5.02 (0.72)7. Fitch Comprehensive Income/ Risk Weighted Assets n.a. 5.09 (0.12)D. Capitalization1. Fitch Core Capital/Weighted Risks n.a. 15.16 13.882. Fitch Eligible Capital/ Weighted Risks n.a. n.a. n.a.3. Tangible Common Equity/ Tangible Assets 8.30 7.37 6.734. Tier 1 Regulatory Capital Ratio n.a. 15.90 13.305. Total Regulatory Capital Ratio n.a. 23.50 21.706. Core Tier 1 Regulatory Capital Ratio n.a. n.a. n.a.7. Equity/ Total Assets 8.60 8.47 7.868. Cash Dividends Paid & Declared/ Net Income n.a. n.a. (189.78)9. Cash Dividend Paid & Declared/ Fitch Comprehensive Income n.a. n.a. (1,151.38)10. Cash Dividends & Share Repurchase/Net Income n.a. n.a. n.a.11. Net Income - Cash Dividends/ Total Equity 30.14 28.45 (13.06)E. Loan Quality1. Growth of Total Assets 7.10 18.35 20.092. Growth of Gross Loans (3.67) 7.09 (0.20)3. Impaired Loans(NPLs)/ Gross Loans n.a. 1.99 2.694. Reserves for Impaired Loans/ Gross loans 2.43 2.34 3.885. Reserves for Impaired Loans/ Impaired Loans n.a. 117.61 144.386. Impaired Loans less Reserves for Imp Loans/ Equity n.a. (1.23) (4.98)7. Loan Impairment Charges/ Average Gross Loans 0.07 0.65 2.948. Net Charge-offs/ Average Gross Loans 59.39 (0.10) (1.06)9. Impaired Loans + Foreclosed Assets/ Gross Loans + Foreclosed Assets n.a. 1.99 2.69F. Funding1. Loans/ Customer Deposits 33.70 39.23 43.582. Interbank Assets/ Interbank Liabilities 34.13 49.35 213.043. Customer Deposits/ Total Funding excl Derivatives 88.63 88.39 84.66United Bank For Africa <strong>Plc</strong>August 20135


