Annual Report
Annual Report
Annual Report

Create successful ePaper yourself
Turn your PDF publications into a flip-book with our unique Google optimized e-Paper software.
<strong>Annual</strong> <strong>Report</strong>2003Kubota Corporation
ProfileSince its establishment, Kubota has continually aimed to promote the harmonious coexistenceof humans and all aspects of the earth’s environment, including water and soil, bycreating products that contribute to a better future for people, society as a whole, and theearth. In accordance with this basic philosophy, Kubota is continually anticipating the needsof the times as it vigorously engages in businesses that contribute to the betterment of society. Today, Kubota’sproducts in domains closely connected to culture and people’s daily lives—including areas related to water,soil, air, cities, and homes—are enjoyed by people worldwide. In the future, Kubota will continue to providepeople- and earth-friendly products that will enable the creation of abundant living environments andcontribute to the protection of the earth’s environment.Financial HighlightsKubota Corporation and Subsidiaries Years Ended March 31, 2003, 2002, and 2001Millions of YenThousands ofU.S. Dollars2003 2002 2001 2003Net sales ¥926,145 ¥965,791 ¥984,767 $7,717,875Percentage of previous year 95.9% 98.1% 101.0%Net income (loss) (8,004) 9,530 9,795 (66,700)Percentage of previous year — 97.3% 59.6%Percentage of net sales (0.9)% 1.0% 1.0%Net income (loss) per 5 common shares (Yen and U.S. Dollars):Basic ¥(29) ¥34 ¥35 $(0.24)Diluted (29) 33 34 (0.24)Cash dividends per 5 common shares (Yen and U.S. Dollars) 30 30 30 0.25Capital expenditures ¥35,845 ¥36,342 ¥37,170 $298,708Depreciation 38,494 40,074 43,311 320,783R&D expenses 26,405 30,186 30,257 220,042Number of shareholders (At year-end) 59,446 59,409 62,518Notes: 1. The U.S. dollar amounts in this report represent translations of Japanese yen, for convenience only, at the rate of ¥120=US$1. See Note 1 to the consolidated financial statements.2. Per share amounts have been calculated per 5 common shares since each American Depositary Share represents 5 shares of common stock.ContentsTo Our Shareholders and Friends 1An Interview with the President 2Kubota’s Medium-Term Management Strategy/Progress <strong>Report</strong> 5Review of Operations 9Five-Year Financial Summary 13Financial Review 14Segment Information 20Consolidated Balance Sheets 22Consolidated Statements of Income 24Consolidated Statements of Comprehensive Income (Loss)/Consolidated Statements of Shareholders’ Equity 25Consolidated Statements of Cash Flows 26Notes to Consolidated Financial Statements 27Independent Auditors’ <strong>Report</strong> 44Directory 45Directors and Corporate Auditors/Investor Information 47Cautionary Statement with Respect to Forward-Looking StatementsThis annual report contains statements about Kubota’s future business plans, strategies, and beliefs. Statementsregarding the Company’s projected future business results are not based on historical facts and are subject to variousrisks and uncertainties. These risks and uncertainties relate to economic conditions in Kubota’s business environment,particularly government agricultural policies, the state of private-sector and public-sector capital investment, currencyexchange rates, new housing starts, competitive pricing pressures in the marketplace, and Kubota’s ability to continuedesigning and developing products that will be accepted in markets. However, it should be noted that elements affectingperformance are not limited to the previously mentioned factors.
To Our Shareholders and FriendsIn fiscal 2003, ended March 31, 2003, Kubota Corporation’s net sales declined 4.1% from the levelin the previous fiscal year, to ¥926.1 billion ($7,718 million). This ¥39.6 billion decrease reflecteda ¥41.1 billion reduction of the Company’s net sales owing to the sale of prefabricated housingoperations in March 2002. Excluding the effects of that transaction, our net sales would have beenroughly the same as in the previous fiscal year.Looking at year-on-year changes in segment sales, sales in the Internal Combustion Engine andMachinery segment increased both in Japan and overseas. In Japan, Kubota faced challenges froma decline in demand for agricultural equipment but was able to increase its market share and salesby proactively developing and launching products that offer improved functionality at relatively lowprices and by dynamically executing sales promotion programs for those products. Kubota was ableto augment overseas sales through the implementation of a 30-year-anniversary marketing promotioncampaign and launch of new products in the United States, which is the Company’s principaloverseas market for tractors. Regarding the Pipes, Valves, and Industrial Castings segment, weincreased our overseas sales, with particularly strong sales of ductile iron pipes and other productsin the Middle East, but a sharp drop in domestic demand led to low sales levels for such principalproducts as ductile iron pipes and PVC pipes, causing total segment sales to decrease. Sales inthe Environmental Engineering segment decreased owing to the end, in the previous fiscal year,of a boom in demand for the rebuilding of incinerators to prevent dioxin emissions. Sales in theBuilding Materials and Housing segment fell sharply owing to the previously mentioned sale ofprefabricated housing operations.Daisuke HatakakePresident and Representative DirectorOperating income declined ¥4.8 billion, to ¥29.6 billion ($247 million), owing to such factors as a¥16.8 billion impairment loss on a golf course owned and operated by a subsidiary and ¥4.6 billionin payments associated with a voluntary early retirement special program. Reflecting this and ¥24.8 billion in valuation losses on short-term andother investments caused by a drop in Japanese stock prices, Kubota’s income before income taxes, minority interests in earnings of subsidiaries,and equity in net income of affiliated companies was down 78.5%, to ¥6.2 billion ($51 million). Income taxes amounted to ¥12.3 billion($102 million). The subsidiary operating the golf course recorded a net loss, and there may be no prospect of recovering deferred tax assets fromthe subsidiary’s taxable income in the future. Accordingly, the impairment loss was accounted for without recording a related deferred tax asset.As a result, the Company recorded a net loss of ¥8.0 billion ($67 million), the first time it has recorded a net loss on a consolidated basis.Diluted net loss per five common shares amounted to ¥29 ($0.24), compared with diluted net income per five common shares of ¥33 in fiscal2002. The Company plans to pay year-end cash dividends per common share of ¥3, or ¥15 per five common shares. Together with interimcash dividends, cash dividends per share for the entire fiscal year will amount to ¥6, or ¥30 ($0.25) per five common shares.Medium-Term Management StrategyIn March 2001, Kubota initiated a Medium-Term Management Strategy covering the three-year period through March 2004. The Company isworking concertedly to achieve the three principal objectives articulated in the strategy, which are to reform its business structure and profitstructure, fundamentally improve its business operating systems, and strengthen its financial position. To overcome current challenges,improve performance, and promote sustained corporate development, we will continue with the forceful implementation of our Medium-TermManagement Strategy during the current fiscal year. We will do our utmost to ensure that the strategy is implemented as quickly as possibleand with maximum effectiveness.The fundamental imperative of the Medium-Term Management Strategy is to continually reevaluate prospective business circumstances andsteadily proceed with strategic initiatives conceived based on a medium-to-long-term perspective. Accordingly, while fiscal 2004 is the finalyear of the current Medium-Term Management Strategy, we have decided to draft new versions of the Medium-Term Management Strategy ona rolling basis. While annually reappraising progress made in implementing strategies as well as changes in our operating environment, we willmake timely adjustments to our strategies and announce these adjustments to ensure that our management objectives are clear to concernedparties both inside and outside of Kubota.We hope for the continued understanding and support of our shareholders and associates.June 2003Daisuke HatakakePresident and Representative Director1
An Interview with the PresidentCould you explain your work history at Kubota?Before becoming president, I was both the managing director responsible for management planning and financial matters andgeneral manager of the Corporate Compliance Headquarters.Two years ago, as the director responsible for management planning andfinancial matters, I cooperated with Kubota’s former chairman and president—Osamu Okamoto and Yoshikuni Dobashi—in drafting the Company’s Medium-Term Management Strategy, which covers the three years through March 2004.That was the first time in nine years that Kubota had established a medium-termstrategy. In view of the difficulty of promoting additional growth in sales andprofitability at that time, we believed it important to eliminate the perception thatour corporate development was obstructed, clearly describe each businessunit’s development path, and set specific performance goals for all employeesto strive to attain.As the general manager of the Corporate Compliance Headquarters, I workedto ensure that Kubota conformed to rigorous corporate ethics standards. In additionto giving thorough attention to the fundamental compliance issue of makingsure that all management decisions and corporate activities respect the law, Iundertook such initiatives as the creation of Kubota’s Charter of CorporateBehavior and the revision of the Company’s employee action standards.Before becoming a director, I was posted to diverse departments and offices.As general manager of the Hirakata plant, I was on the front lines of manufacturingoperations and made various efforts to rebuild Kubota’s construction machinery business. Based on that experience, I haveconcluded that business success requires at least two things: first, that managers fully understand developments on the frontlines of business operations so that they have all the information they need to make the right decisions and, second, that allemployees work together effectively to execute the management decisions and realize the relevant goals.What are your fundamental management policies?For the time being, I would like to give strong emphasis to the concept of “speed and execution.” Kubota has maintained leadingpositions and high market shares in numerous stable business fields characterized by relatively low levels of change, and thisstability is particularly evident in certain business fields in which government entities are the customers. As a result of our presencein such markets, I believe that Kubota has developed a corporate culture that is admirable regarding reliability and prudencebut is slow to implement and execute new business strategies. In the current era of rapidly changing operating environments, wemust create and implement strategic countermeasures with much greater speed. We have to be bolder in taking action withoutexcessive fear of mistakes, and we have to quickly fix problems when mistakes are in fact made. I will be making a strong push2
to shift the Company to a bolder and more dynamic management style.Another issue that merits strong emphasis is personnel development. Throughout my career, I have been fully aware of thecritical importance of highly skilled and motivated personnel. When communicating with managers, I make a point of stressingthe importance of their responsibility for promoting the development of staff. In concrete terms, each manager must give youngeremployees appropriate guidance while also assigning them challenging work and responsibilities. These are the fundamentalelements of personnel development, and they are also key means of creating a company characterized by “speed and execution.”By emphasizing “speed and execution,” I plan to increase Kubota’s capability to rapidly respond to changes in its operatingenvironment. By promoting personnel development and motivation efforts, I am seeking to foster an increasingly dynamic andproactive corporate culture.What do you think about the current organization and management of Kubota’soperations?To date, Kubota has already moved forward with efforts tobuild a more autonomous divisional management structurethrough such efforts as those aimed at reorganizing the businessdivisions, streamlining the head office’s support andadministrative departments, giving greater responsibility andauthority to divisions, and introducing a new performancebasedpersonnel system. I will take responsibility for maximizingthe benefits of these reforms.In the future, I want to proceed with the building of newbusiness models and systems adapted to the needs of individualbusiness fields. Kubota operates in an extremely widerange of business fields, but operations in a number of thosefields are not generating satisfactory results even though weare the top or close to the top company in those fields in terms of market share. I believe that this is due to the insufficientstrength of our business models and systems. In view of this, we must reevaluate all our business models and systems and buildnew ones that are optimal for current conditions in each field through such measures as those to tighten the focus of our marketing,technical, and manufacturing units on their central functions and those involving corporate alliances, spin-offs, and overseasbusiness development. Each of our business divisions must design the best models and systems for its own operations basedon a thorough consideration of the special characteristics of its business field and emerging trends in its operating environmentas well as its own strengths and weaknesses. I intend to take effective steps to promote and lead this process of building newbusiness models and systems.3
After determining the ideal developmental direction of our businesses, we must reexamine our capabilities as a manufacturer.To overcome challenges from competing companies, it is important that we maintain strong emphasis on the basic tenets ofmanufacturing business by taking the measures needed to establish superior capabilities regarding product quality, manufacturingcosts, and the quickness of product deliveries. We will retain our traditional dedication to manufacturing excellence aswe seek to further develop our operations.What are your principal strategic emphases right now?Our principal strategic emphasis at this time is to complete the implementation of the Medium-Term Management Strategy.In particular, we will be doing our utmost to achieve the first principal objective of that strategy, which is to reform Kubota’sbusiness structure and profit structure. Looking at Kubota’s principal businesses—engines and machinery marketed principallyto the private sector as well as ductile iron pipes and other products marketed principally to the public sector—one finds thatdomestic and overseas sales of engine and machinery are growing smoothly and the profitability of those sales is rapidly improving.In contrast, the profitability of business in products marketed principally to government bodies has deteriorated considerablyamid decreasing demand and intensifying competition. Rebuilding this business is currently our most important task. We aremarshaling all of Kubota’s diverse capabilities to complete this rebuilding task, including moves to horizontally spread knowhowfrom our increasingly strong operations in engines and machinery.Another particularly important objective of the Medium-Term Management Strategy is thedeveloping of new and peripheral businesses. While new business development has been delayeddue to circumstances in individual business fields as well as overall economic conditions, this is acrucial objective and a prerequisite for Kubota’s dynamic corporate development over the longterm. Our basic approach to developing new businesses is not to escape from our central businessfields but to increase the dimensions of those fields. We are not planning to try establishingoperations in fields totally unrelated to our existing technologies, markets, and other strengths.What we intend to do is broaden the scope of existing businesses by entering new fields in whichwe have some kind of special strength. While striving to realize more of our strengths’ potentials,we are planning to compensate for our weaknesses through cooperation with other companiesand are also considering the possibility of purchasing some businesses. In these ways, we aremaintaining relentless strategic business development efforts focused on an extended range ofbusiness fields.4
Kubota’s Medium-Term Management Strategy/Progress <strong>Report</strong>1. Progress in Implementing Kubota’s Medium-Term Management StrategyOverview of the Medium-Term Management StrategyThree Primary Focuses of the Medium-Term Management Strategy(1) Reforming the Business Structure and Profit Structure· Classification of Core/Strategic Businesses and Low-Profit Businesses and Implementation of Reforms in Line with the Businesses’ Missions· Developing New and Peripheral Businesses(2) Reforming Operational Systems· Reorganization of Divisions (building a more autonomous divisional management structure)· Reevaluation of Administrative and Support Departments· Introduction of New Personnel System(3) Strengthening the Financial Position· Reduction of Interest-Bearing Debt1) Reforming the Business Structure and Profit Structure(1) Internal Combustion Engine and MachineryIn the core domestic business field of farm equipment, Kubota has established a “concurrent engineering” product development systeminvolving the integration of development and manufacturing processes. This system enables the Company to continually launch new productsthat are competitively priced and feature improved capabilities. As a result of this system and a test-ride-centered sales promotioncampaign, despite the weakness of overall demand, the Company has steadily increased its market share and expanded its operations.In the strategic overseas business field of tractors, Kubota is proactively developing its operations, principally in North America. Thelaunch of new tractor models and the implementation of a sales promotion campaign that commemorates the 30th anniversary of the startof Kubota product marketing in North America enabled the Company to increase its market share. Regarding outdoor power equipment business,sales of the ZD series of locally manufactured products were robust. Moreover, a Georgia-based subsidiary—Kubota Manufacturingof America Corporation—expanded its production capacity, and that company is scheduled to begin manufacturing newly developed utilityvehicles, which will be introduced to the market in 2004. Aiming to expand overseas tractor operations, Kubota Tractor Corporation in 2002procured land in Georgia, upon which the Company has invested in increasing its warehousing and tractor assembly line capabilities. TheTurf-Care Technology & Marketing Center, which handles research and marketing work required for local product development activities,has also begun operating at the new site.(2) Pipes, Valves, and Industrial CastingsA decrease in domestic demand and intensification of competition considerably depressed the profitability of business in ductile iron pipesand other products marketed principally to government entities. Kubota is working concertedly to restore the profitability of its core ductileiron pipe business.On April 1, 2003, Kubota established the Production Control Headquarters within the Industrial and Material Systems ConsolidatedDivision to restore emphasis on the basic principles of manufacturing and promote operational reforms. To facilitate the horizontal spreadof the Farm and Industrial Machinery Consolidated Division’s successful reforms involving a return to basic manufacturing principles, theCompany is shifting personnel and know-how from the Farm and Industrial Machinery Consolidated Division to the Industrial and MaterialSystems Consolidated Division. This reflects the concerted and Companywide nature of the return to basic manufacturing principles.Striving to introduce systems that are comprehensively optimized, each business unit is taking measures such as those to reevaluate manufacturingsystems and thoroughly rationalize and centralize Consolidated Divisionwide procurement operations to reduce materials costs.Regarding the Ductile Iron Pipe Division, because a recovery in domestic demand is not projected, the division is adopting such newstrategies as promoting sales of high-value-added products, reforming or eliminating unprofitable products, and undertaking fundamentaldistribution reforms. In addition to reducing operating costs, the division is striving to cut fixed costs through measures that include thestreamlining of marketing departments. It is expected that the steady implementation of these strategies will lead to a recoveryin profitability.5
(3) Environmental EngineeringThe Environmental Engineering Consolidated Division is working to clearly distinguish between fields that are appropriate for operationalexpansion and those that are more appropriate for operational stabilization, strengthen its profitability, and steadily develop new businesses.Regarding fields that are appropriate for operational expansion, one representative new business that shows promise is the resourcerecycling-type renewal business involving the recycling of waste materials in landfills as well as the treatment and purification of contaminatedsoil. Kubota’s first plant for this work is scheduled to be completed in Teshima, Kagawa Prefecture, in August 2003. In April 2003, constructionof an industrial waste processing facility, which the Company will own and operate, was begun in Kitakami, Iwate Prefecture. Thefirst business operation of its type within the Kubota Group, this business will be operated by a subsidiary, Kubota Retex Corp., which isscheduled to obtain its waste processing license and begin operating in October 2003.Another growing new business centers on the submerged membranes developed by Kubota, which have enabled the creation of simplifiedmembrane separation technologies as well as compact wastewater treatment systems that have a broad spectrum of applicationsranging from septic tanks to the treatment of industrial wastewater and town sewage. In Japan, Kubota has obtained an A-class licensefor sewage system engineering and is endeavoring to expand its sales. Overseas, the Company has established a marketing subsidiaryin Europe and plans to develop business in the U.S. market as well.In business fields that are appropriate for operational stabilization, Kubota is striving to improve its profitability through the more-rigorousmanagement of cost of sales, strengthened procurement capabilities, and the reduction of fixed costs. Reflecting these measures, Kubotaimproved the profitability of Environmental Engineering in fiscal 2003 despite a decline in net sales from the prior year.(4) Building Materials and HousingIntent on restoring the overall profitability of its businesses in the Building Materials and Housing segment, Kubota has taken various profitbolsteringmeasures and expects these businesses to regain their overall profitability during fiscal 2004. The Company sold its prefabricatedhousing business, which had been problematic for many years, during fiscal 2002. In the condominium development business, Kubota recordedconsiderable valuation losses on fixed assets and otherwise proceeded steadfastly with restructuring measures during fiscal 2002. Asa result, the Company was able to restore the operating profitability of the Building Materials and Housing segment during fiscal 2003.Kubota has achieved a large profitability improvement in the siding materials business by proactively introducing new products andundertaking thorough cost-reduction measures. Regarding roofing materials, the Company has worked since fiscal 2002 to fundamentallyimprove its manufacturing methods. During fiscal 2003, these improvements were completed and the product quality was stabilized. Kubotais making additional cost-reduction measures in roofing materials operations and aims to restore the profitability of those operations in fiscal2004. As the profitability of septic tank operations has already been restored, it is expected that the profitability of the Building Materials andHousing segment will further improve during fiscal 2004.2) Reforming Operational Systems(1) Reorganization of DivisionsIn July 2002, Kubota reorganized its consolidated divisions with the goals of boosting competitiveness by augmenting collaboration betweenbusiness sectors and taking better advantage of complementary capabilities and synergies. The new divisional management organizationof the Company consists of four divisions—the Farm and Industrial Machinery Consolidated Division, the Industrial and Material SystemsConsolidated Division, the Environmental Engineering Consolidated Division, and the Housing Materials and Utilities Consolidated Division.The Company is proceeding with the delegation of additional authority to each of the consolidated divisions, aiming to establish anautonomous management system that will increase the speed and efficiency of management decisions.(2) Reforming the Organizational Systema. Top Management ReformsSince June 2003, Kubota’s Board of Directors has had 19 members. The Company has considerably reduced the number of directors with thegoal of expediting decision making and reduced the term of directors from two years to one year with the goal of increasing the clarity of managerialresponsibilities.The new Board of Directors has two vice presidents, each of whom concurrently serves as a general manager of consolidated divisionsand oversees operations from a comprehensive Companywide perspective. One of the vice presidents is also the general manager of theTokyo office, which is primarily focused on marketing operations, while the other is the director responsible for the Research & DevelopmentPlanning & Promotion Department and is charged with supervising R&D activities throughout the Company. The current organizational systemis designed to facilitate expeditious Companywide responses and horizontal collaboration with respect to important issues.6
Board of Directors(As of June 30) 1999 2000 2001 2002 2003Chairman 1 1 1 1President 1 1 1 1 1Vice Presidents 1 2Executive Managing Directors 2 4 6 3 2Managing Directors 14 9 7 9 6Directors 16 11 12 11 8Total 35 26 27 25 19b. Streamlining of Head Office Administrative and Support Departments (Parent Company)Kubota has reevaluated the missions and roles of its head office’s support and administrative departments and proceeded to streamlinethose departments. In April 1999, there were 40 such departments staffed with 1,200 people, and the number of departments and staffhad been reduced to 14 and 355, respectively, as of April 2003.Reducing number of corporate staff departments and staff of the head office(As of April) 1999 2000 2001 2002 2003Departments 40 40 25 19 14Staff 1,200 1,036 748 677 355c. Implementing a Voluntary Early Retirement Special Program (Parent Company)Kubota implemented a voluntary early retirement special program in fiscal 2003, and 496 employees took advantage of the program. Asa result, the number of the parent company’s employees was reduced to 12,107 as of April 1, 2003. The Company’s Medium-TermManagement Strategy target in this regard was thus nearly attained approximately one year ahead of schedule.Reducing number of employees (Parent Company)(As of April 1) 1999 2000 2001 2002 2003 2004Target 12,703 12,100Actual 15,511 14,426 13,784 13,235 12,107d. Reforming the Personnel System (Parent Company)Beginning in fiscal 2003, Kubota has been introducing a new personnel system aimed at increasing the Company’s organizational dynamismby means of thoroughly merit-based and transparent employee evaluation. A merit-based personnel evaluation system that determinessalaries with emphasis on employee contributions rather than seniority has already been introduced, along with such other systems as a corporateperformance-linked bonus system. While the Company previously set the levels of managers’ bonuses based on consideration of thebusiness performance of the division to which they belong, the scope of this system has been expanded to include union members. As offiscal 2004, all employee bonuses are set based on consideration of the divisions’ business performance.To promote personnel development and the recruitment of promising young employees, the Company has introduced a double-track-typejob assignment system, which provides diverse career paths for those who want to be a manager, a specialist, or an expert.In the future, Kubota will proceed still further with reforms to its organizational and operational systems while striving to maximize thebenefits of those systems.3) Strengthening the Financial PositionKubota is taking measures to strengthen its financial position, primarily through the reduction of interest-bearing debt. The Company’s interest-bearingdebt on a consolidated basis amounted to ¥429.6 billion as of March 31, 1999, and had been reduced to ¥327.4 billion at theend of fiscal 2003. Owing to the fund’s being used for Kubota’s steadily expanding operations in North America as well as the advance procurementof funds for the repayment of corporate bonds due during fiscal 2004, the Company did not attain its target of reducing interestbearingdebt to ¥315.0 billion at the end of March 2003, but it is steadily progressing with the streamlining of its balance sheet throughmeasures centering on the reduction of inventory levels and the restraint of capital expenditures. The Company is aiming to reduce itsinterest-bearing debt to ¥300.0 billion by March 31, 2004.Reduction of interest-bearing debt(Billions of yen)(As of March 31) 1999 2000 2001 2002 2003 2004Target 330.0 315.0 300.0Interest-bearing debt 429.6 371.2 372.2 332.9 327.47
2. Attainment of Operating Income Targets(Billions of yen)1.45.6Operating Income0.562.7 34.81.21.83.231.06.53.029.24.443.212.8 19.63.63.234.429.612.7FY97 FY98 FY99 FY00 FY01 FY02 FY03Operating income Loss from disposal and impairment of businesses and fixed assetsRatio of operating income to net sales (%)In line with the Medium-Term Management Strategy goal of reforming the business structure and profit structure, Kubota is working toenhance its profitability by progressively taking such measures as liquidating unprofitable businesses and recognizing the impairment lossof fixed assets. In fiscal 2002, the Company generated ¥34.4 billion in operating income despite recording ¥12.8 billion in losses on thedisposition of its prefabricated housing business and impairment loss of a condominium development subsidiary’s fixed assets. In fiscal2003, the Company generated ¥29.6 billion in operating income despite recording a ¥19.6 billion loss from the disposal and impairmentof business and fixed assets, including a ¥16.8 billion impairment loss on a golf course owned by one of its subsidiaries.In fiscal 2004, which is the final year of the current Medium-Term Management Strategy, Kubota aimed to attain ¥930.0 billion in netsales and ¥55.0 billion in operating income but currently projects that it will record ¥910.0 billion in net sales and ¥7.0 billion in operatingincome. The ¥48.0 billion reduction to the operating income target reflects a significant increase in pension expense, due to the deteriorationin the return on investment of the pension plan assets and the large increase in pension liabilities due to the reduction of the discountrate. The Company forecasts that the amount of pension expense for fiscal 2004 will increase by approximately ¥46.0 billion. Excludingthis additional expense, the Company believes its profitability is commensurate with the Medium-Term Management Strategy objective.Medium-Term Financial Targets and Current Projection (Fiscal 2004)Billions of YenTarget Projection Change Main Factor of ChangeNet Sales 930.0 910.0 (20.0)Operating Income 55.0 7.0 (48.0) Rise in pension expense (46.0)3. Drafting of the New Medium-Term Management StrategyThe basic concept of Kubota’s Medium-Term Management Strategy is to continually reevaluate the prospective circumstances of its businesses,determine the measures that should be taken over the medium term in view of those business prospects, and steadily implementthose measures. The Medium-Term Management Strategy is a tool for attaining these ends. In the future, the Company will firmly maintainthis concept and tool for promoting the management of its businesses based on a medium-term perspective.In fiscal 2004, Kubota will draft a new Medium-Term Management Strategy, setting fiscal 2003 as the base period. Based on considerationof progress in the implementation of strategies and changes in the operating environment, the Company intends to draft modified versionsof the New Medium-Term Management Strategy on an annual rolling basis.With a fundamental goal of steadily developing its core operations, the New Medium-Term Management Strategy aims to further strengthenthe profitability of operations in the Internal Combustion Engine and Machinery and Environmental Engineering fields. At the same time, theplan is designed to place emphasis on the rebuilding of operations in the Pipes, Valves, and Industrial Castings sector and other fields inwhich government entities are the customers, as profitability in those business fields has deteriorated considerably. While giving thoroughattention to selectively concentrating its resources in promising fields, the Company will emphasize the expansion of its core and growthbusinesses through the establishment and development of new and peripheral businesses. In these ways, Kubota intends to prosper as acompany with an unostentatious but solidly dominant presence in diverse fields.8
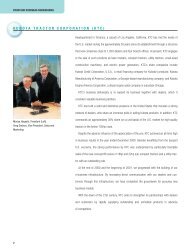
Review of OperationsInternal CombustionEngine and Machinery(Note) In order to clarify the relationship between management structure and industry segments, the Companyincreased the industry segments from three to five. The five new industry segments are as follows: “InternalCombustion Engine and Machinery,” “Pipes, Valves, and Industrial Castings,” “Environmental Engineering,” “BuildingMaterials and Housing,” and “Other.”Sales by SectorSales by Geographic Segment(Billions of Yen)(Billions of Yen)50050040040030030020020010010000’99 ’00 ’01 ’02 ’03’99 ’00 ’01 ’02 ’03Farm Equipment and EnginesConstruction MachineryOverseasJapanBillions of Yen1999 2000 2001 2002 2003Net Sales ¥966.1 ¥974.6 ¥984.8 ¥965.8 ¥926.1Internal Combustion Engine and Machinery 361.7 375.5 416.4 415.1 444.2Sales by Sector Farm Equipment and Engines 326.6 338.6 375.0 377.0 399.4Construction Machinery 35.1 36.9 41.4 38.1 44.8Sales in Japan and Overseas Japan 199.0 208.6 238.4 218.2 225.5Overseas 162.7 166.9 178.0 196.9 218.7Sales in Internal Combustion Engine and Machinery were ¥444.2billion, an increase of 7.0% from the prior year, comprising 48.0%of consolidated net sales. Domestic sales increased 3.4%, to¥225.5 billion. Overseas sales rose 11.0%, to ¥218.7 billion.This segment consists of “farm equipment and engines” and“construction machinery.”Sales of farm equipment and engines increased 5.9%, to¥399.4 billion, from the prior year. Domestic sales were ¥204.2billion, 3.1% higher than the prior year, and overseas sales were¥195.2 billion, 9.1% higher than the prior year. In domestic markets,as demand for farm equipment was lackluster, reflectingunfavorable crop prices and reduction of rice acreage, the Companyaggressively conducted a sales promotion campaign together withthe introduction of new models of farm equipment with improvedperformance and price competitiveness. In overseas markets, salesof tractors in North America significantly increased, owing to anaggressive marketing campaign and the introduction of new models.The Company has made an investment in its Georgia facilitiesfor the expansion of assembly lines and warehouses, and alsoestablished the Turf-Care Technology & Marketing Center. Salesof engines increased, owing principally to increasing sales tooriginal equipment manufacturers both in the EU and U.S. markets.Sales of construction machinery were ¥44.8 billion, an increaseof 17.5% from the prior year. Domestic sales were ¥21.3 billion,an increase of 6.2%. Total sales of construction machinery in theJapanese market decreased, despite the Company expanding itsmarket share. Overseas sales were ¥23.5 billion, an increase of30.1%. While demand in EU markets was weak, the increase inmarket share allowed the Company to achieve increased sales. InNorth America, the introduction of new models was very successful,thus dramatically increasing sales.Mini-excavator:KX101-3Compact tractor: B7800H5DZero-turn mower: ZD-PRO219
Pipes, Valves, andIndustrial CastingsSales by Sector(Billions of Yen)25020015010050Sales by Geographic Segment(Billions of Yen)2502001501005000’99 ’00 ’01 ’02 ’03’99 ’00 ’01 ’02 ’03Pipes and ValvesIndustrial CastingsOverseasJapanBillions of Yen1999 2000 2001 2002 2003Net Sales ¥966.1 ¥974.6 ¥984.8 ¥965.8 ¥926.1Pipes, Valves, and Industrial Castings 223.5 209.1 199.0 184.5 177.2Sales by Sector Pipes and Valves 184.8 174.8 164.3 151.3 145.6Industrial Castings 38.7 34.3 34.7 33.2 31.6Sales in Japan and Overseas Japan 208.0 196.7 187.6 173.4 159.0Overseas 15.5 12.4 11.4 11.1 18.2Sales in Pipes, Valves, and Industrial Castings were ¥177.2 billion,4.0% lower than the prior year, comprising 19.1% of consolidatednet sales. Domestic sales decreased 8.3%, to ¥159.0 billion.Overseas sales increased 63.8%, to ¥18.2 billion. This segmentconsists of “pipes and valves” and “industrial castings.”Sales in pipes and valves declined 3.8% from the prior year, to¥145.6 billion. Domestic sales were down 8.2%, to ¥135.5 billion.Overseas sales increased 161.9%, to ¥10.1 billion. Domestic salesof ductile iron pipes, which are the mainstay products in this subsegment,were negatively affected by the reduction in public worksspending and financial difficulties in local governments. Sales ofspiral-welded steel pipes remained flat but sales of PVC pipesdeclined due to sluggish demand from both public and privatesectors. Overseas sales surged, owing mainly to the brisk exportof ductile iron pipes and valves to Middle Eastern countries.Sales of industrial castings decreased 4.6%, to ¥31.6 billion.Domestic sales were down 9.2%, to ¥23.5 billion. Overseas saleswere up 11.8%, to ¥8.1 billion. Domestic sales declined due todecreased capital expenditure and weak demand from the constructionindustry. Overseas sales grew due to the growing exportof cargo oil pipes for oil tankers and the introduction of newreformer tubes by a subsidiary in Canada.DRC segments10Ductile iron pipesDuctile iron pipes
EnvironmentalEngineeringSales by Sector(Billions of Yen)16012080Sales by Geographic Segment(Billions of Yen)16012080404000’99 ’00 ’01 ’02 ’03’99 ’00 ’01 ’02 ’03Environmental EngineeringOverseasJapanBillions of Yen1999 2000 2001 2002 2003Net Sales ¥966.1 ¥974.6 ¥984.8 ¥965.8 ¥926.1Environmental Engineering 147.3 148.1 139.5 148.0 136.4Sales by Sector Environmental Engineering 147.3 148.1 139.5 148.0 136.4Sales in Japan and Overseas Japan 144.8 146.4 137.2 144.9 134.5Overseas 2.5 1.7 2.3 3.1 1.9Sales in Environmental Engineering were ¥136.4 billion, 7.8% lowerthan the prior year, accounting for 14.7% of consolidated netsales. Domestic sales decreased 7.2%, to ¥134.5 billion. Overseassales decreased 39.0%, to ¥1.9 billion. This segment consists ofenvironmental control plants and pumps.Sales in the Water & Sewage Engineering division decreased,due to fewer orders received in the prior year and financial difficultiesin local governments. Sales in the Water Environment Engineeringdivision grew, due to increased sales of sewage treatment plantsand expanding sales of new business fields. After a boom indemand for the rebuilding of incinerators to prevent dioxin emissionsin the previous year, sales in the Solid Waste Engineeringdivision fell. As for pumps, our domestic sales increased throughexpansion of domestic market share despite the decrease in publicworks. However, due to lower sales in overseas markets, totalsales fell.Floating charcoal purifierIndustrial waste processing facility11
Building Materialsand HousingSales by Sector(Billions of Yen)1601208040Sales by Geographic Segment(Billions of Yen)160120804000’99 ’00 ’01 ’02 ’03’99 ’00 ’01 ’02 ’03Building MaterialsHousingOverseasJapanBillions of Yen1999 2000 2001 2002 2003Net Sales ¥966.1 ¥974.6 ¥984.8 ¥965.8 ¥926.1Building Materials and Housing 115.8 124.5 110.3 110.9 64.3Sales by Sector Building Materials 60.5 64.3 59.1 56.7 57.3Housing 55.3 60.2 51.2 54.2 7.0Sales in Japan and Overseas Japan 115.8 124.5 110.3 110.9 64.3Overseas 0.0 0.0 0.0 0.0 0.0Sales in Building Materials and Housing were ¥64.3 billion, 42.0%lower than the prior year, accounting for 7.0% of consolidated net sales.This segment consists mainly of building materials (roofing materials,siding materials, and septic tanks) and sales of condominiums.Sales of building materials increased 1.2%, to ¥57.3 billion.Although the Company promoted new models and attempted toexpand its market share, sales of roofing materials declined due toincreased competition for western-type roofing materials during aslowdown in new housing starts. Sales of siding materials remainedat the same level as the prior year, owing to the promotion of newmodels and the strengthening of our product lineup. Sales of septictanks increased compared with the prior year, owing to the reinforcementby the Company of marketing channels in regional markets andthe expansion of its market share by introducing new models despitethe reduction in demand.Sales of condominiums fell 87.1%, to ¥7.0 billion. The Companywithdrew from the prefabricated housing business, which had beenamainstay of this subsegment. Consequently, sales of this subsegmentdeclined significantly. The Company received more contractsfor sales of condominiums than the prior year despite theactual number of condominium sales decreasing.Sales by Sector(Billions of Yen)160Sales by Geographic Segment(Billions of Yen)160Other1208040120804000’99 ’00 ’01 ’02 ’03’99 ’00 ’01 ’02 ’03OtherOverseasJapan12Billions of Yen1999 2000 2001 2002 2003Net Sales ¥966.1 ¥974.6 ¥984.8 ¥965.8 ¥926.1Other 117.8 117.4 119.6 107.3 104.0Sales by Sector Other 117.8 117.4 119.6 107.3 104.0Sales in Japan and Overseas Japan 114.0 116.6 119.0 105.8 100.9Overseas 3.8 0.8 0.6 1.5 3.1Sales in Other were ¥104.0 billion, 3.0% lower than the prior year,accounting for 11.2% of consolidated net sales. Domestic sales declined4.6%, to ¥100.9 billion. Overseas sales climbed 107.8%, to ¥3.1 billion.This segment consists primarily of vending machinery, electronic-equippedmachinery, air-conditioning equipment, and construction.Despite the reduction in publics works spending, domestic salesremained at the same level as the prior year. Sales of vending machineryand electronic-equipped machinery fell, owing to reduced capital expenditurein the private sector. Construction projects in Southeast Asiancountries led to the increase in overseas sales.
Five-Year Financial SummaryKubota Corporation and Subsidiaries Years Ended March 31, 2003, 2002, 2001, 2000, and 1999Thousands ofU.S. DollarsMillions of Yen(Except Per Share(Except Per Share Information)Information)2003 2002 2001 2000 1999 2003For the yearNet sales ¥ 926,145 ¥ 965,791 ¥ 984,767 ¥ 974,586 ¥ 966,145 $7,717,875Percentage of previous year 95.9% 98.1% 101.0% 100.9% 95.1%Cost of sales 695,571 729,863 742,516 738,838 729,488 5,796,425Selling, general, and administrative expenses 181,353 188,713 198,569 200,078 203,854 1,511,275Loss from disposal and impairment of businesses and fixed assets 19,608 12,791 489 6,499 1,819 163,400Operating income 29,613 34,424 43,193 29,171 30,984 246,775Cumulative effect of an accounting change — — (21,559) — — —Net income (loss) (8,004) 9,530 9,795 16,428 15,106 (66,700)Percentage of previous year — 97.3% 59.6% 108.8% 54.6%Percentage of net sales (0.9%) 1.0% 1.0% 1.7% 1.6%Net income (loss) per 5 common shares(Yen and U.S. Dollars):Basic ¥(29) ¥34 ¥35 ¥58 ¥54 $(0.24)Diluted (29) 33 34 55 51 (0.24)Pro forma amounts assumingaccounting change was applied retroactively:Net income (loss) ¥31,354 ¥14,881 ¥(1,137)Net income (loss) per 5 common shares:(Yen):Basic ¥111 ¥53 ¥(4)Diluted 104 50 (4)Cash dividends per 5 common shares(Yen and U.S. Dollars): ¥30 ¥30 ¥30 ¥30 ¥30 $0.25At year-endTotal assets ¥1,139,011 ¥1,200,117 ¥1,290,756 ¥1,320,605 ¥1,378,324 $9,491,758Working capital 212,986 221,758 211,892 234,639 244,602 1,774,883Long-term debt 155,966 167,850 182,238 233,257 266,195 1,299,717Total shareholders’ equity 315,443 394,970 434,979 449,647 424,443 2,628,692Shareholders’ equityper 5 common shares outstanding(Yen and U.S. Dollars): ¥1,172 ¥1,420 ¥1,543 ¥1,595 ¥1,506 $9.77Notes:1. The U.S. dollar amounts in this report represent translations of Japanese yen, for convenience only, at the rate of ¥120=US$1. See Note 1 to the consolidated financial statements.2. The Company has not accounted for a nonmonetary security exchange transaction in accordance with accounting principles generally accepted in the United States of America. See Note 1 to the consolidatedfinancial statements.3. Pro forma data reflects the effect of an accounting change in retirement and pension costs described in Note 6 to the consolidated financial statements.4. Working capital is the amount of total current assets less total current liabilities in the consolidated balance sheets.13
Financial Review1. SALES AND EARNINGSDuring the year under review, the Japanese economy showed some indicationsof recovery, such as brisk exports in the first half of the year. Consumption andcapital expenditures, however, remained sluggish. In the second half of theyear, there were growing concerns regarding the future of the Japanese economydue to worsening deflation, sharp falls in stock prices, and increasedinternational uncertainties. As a result, the Japanese economy becamestagnant.Under such conditions, net sales were ¥926.1 billion ($7,718 million), adecrease of 4.1% from the prior year. Domestic sales were ¥684.2 billion($5,702 million), down 9.2%, largely due to the divestiture of the prefabricatedhousing business, of which sales during the prior year were ¥41.1 billion, andreduced sales for public works projects. Overseas sales were ¥241.9 billion($2,016 million), up 13.8%, largely due to the favorable sales by the tractorbusiness in North America. The percentage of overseas sales to total net saleswas 26.1%, 4.1 percentage points higher than the prior year.Sales in Internal Combustion Engine and Machinery were ¥444.2 billion($3,701 million), an increase of ¥29.0 billion from the prior year. Sales inPipes, Valves, and Industrial Castings were ¥177.2 billion ($1,477 million),a decrease of ¥7.3 billion from the prior year. Sales in Environmental Engineeringwere ¥136.4 billion ($1,137 million), a decrease of ¥11.6 billion. Sales inBuilding Materials and Housing were ¥64.3 billion ($536 million), a decreaseof ¥46.5 billion. Other sales were ¥104.0 billion ($867 million), a decreaseof ¥3.3 billion.Operating income decreased 14.0% from the prior year, to ¥29.6 billion($247 million), and as a percentage of net sales, decreased to 3.2%, down0.4 percentage point from the prior year. Operating income in each industrysegment (before elimination of the inter-segment profits and corporateexpenses) was: Internal Combustion Engine and Machinery, ¥56.7 billion($472 million), an 18.7% rise; Pipes, Valves, and Industrial Castings, ¥1.9 billion($16 million), an 82.8% fall; Environmental Engineering, ¥9.0 billion($75 million), a 14.3% rise; Building Materials and Housing, ¥0.03 billion($0.3 million), which regained profitability after the restructuring of the prefabricatedhousing business; and Other, an operating loss of ¥17.1 billion($143 million), which included an impairment loss of ¥16.8 billion relatedto a golf course owned and operated by a subsidiary.The cost of sales decreased 4.7% compared with the prior year, to¥695.6 billion ($5,796 million). The cost of sales as a percentage of net salesdecreased 0.5 percentage point, to 75.1%. Selling, general, and administrative(SG&A) expenses declined 3.9% compared to the prior year, to ¥181.4billion ($1,511 million). As in the prior year, this decline was attributed to thereduction in corporate office costs.Loss from disposal and impairment of businesses and fixed assets was¥19.6 billion ($163 million), an increase of ¥6.8 billion. This loss was primarilythe result of the aforementioned impairment loss related to a golf courseowned by a subsidiary.R&D expenses were ¥26.4 billion ($220 million). As a percentage ofnet sales, R&D expenses decreased by 0.2 percentage point, to 2.9%. R&Dexpenses were primarily related to the development of new models of tractorsand compact-sized generators as well as to improvements in roofing materialsand roofing-system fixed photovoltaic shingles incorporating amorphous solarbatteries.Other expenses, net, were ¥23.5 billion ($195 million), an increase of¥17.7 billion compared with the prior year. While interest expenses havebeen decreasing over the past four consecutive years due to the reductionof interest-bearing debt, valuation losses on short-term and other investmentsNet Sales(Billions of Yen)Cost of Sales(Billions of Yen)729.5738.8742.5729.9695.6966.1974.6984.8965.8926.176 76 75 76 75’99 ’00 ’01 ’02 ’03’99 ’00 ’01 ’02 ’03Cost of sales to net sales (%)14
jumped from ¥9.2 billion to ¥24.8 billion ($207 million). Due to the factorsabove, income before income taxes, minority interests in earnings of subsidiaries,and equity in net income (loss) of affiliated companies decreased¥22.5 billion, to ¥6.2 billion ($51 million).Income taxes decreased ¥5.0 billion compared with the prior year, to¥12.3 billion ($102 million). However, the effective tax rate increased 139.3percentage points, to 199.7%. Income tax—current was ¥21.5 billion ($179million), a decrease of ¥1.4 billion, and income tax—deferred increased by¥3.7 billion, to ¥9.2 billion ($77 million). The primary reasons for the increasein the effective tax rate were the non-deductibility of the impairment loss onthe golf course and the change in the valuation allowance for deferred tax assets.Minority interests in earnings of subsidiaries increased ¥0.4 billion, to¥2.1 billion ($17 million). Equity in net income of affiliated companies was¥0.2 billion ($2 million), compared with a loss of ¥0.2 billion in the previousyear. Net loss totaled ¥8.0 billion ($67 million), compared with income of¥9.5 billion in the previous fiscal year.From December 2001, the Company implemented a program to purchasetreasury stock. In June 2002, the Company resolved at the ordinary generalmeeting of shareholders that 50.0 million shares, or ¥20.0 billion of shares,would be purchased during fiscal 2003. As the result, the Company purchased43.9 million shares, or ¥14.6 billion of shares. The cumulative numberof shares of treasury stock was 64.4 million as of March 31, 2003, andthese shares were excluded on a weighted average basis from the calculationof net income (loss) per 5 common shares. In June 2003, the Company alsoresolved at the ordinary general meeting of shareholders that 50.0 millionshares, or ¥20.0 billion of shares, would be purchased during fiscal 2004.The Company’s basic policy for the allocation of profit is to “maintain orraise dividends.” To this end, the Company determines the most appropriateuse of retained earnings by considering current business operations as wellas the future business environment. A year-end cash dividend per AmericanDepositary Share of KUBOTA CORPORATION at the rate of ¥15 was approvedat the ordinary general meeting of shareholders, held on June 26, 2003. TheCompany also paid a ¥15 per 5 common shares interim dividend to eachshareholder. Accordingly, the annual cash dividends per 5 common shareswere ¥30 ($0.25).2. LIQUIDITY AND CAPITAL RESOURCESBasic policyThe Company’s financial policy is to maintain the strength of its balancesheet by assuring adequate financing and liquidity for its operations. Throughcash and cash equivalents or other current assets, free cash flow, and borrowingfrom the capital markets, the Company is in a position to finance theexpansion of its business, R&D, and capital expenditures for current andfuture business projects.Current financial strategies are the “Reduction of interest-bearing debt”and the “Maintenance of the balance sheet.” As for the reduction of interestbearingdebt, the Company set a target to reduce its debt to ¥315.0 billion atthe end of March 2003. At the end of March 2003, the amount of interestbearingdebt decreased to ¥327.4 billion ($2,728 million), which was overthe target due to the use of funds to expand business in North America andthe allocation of funds for the repayment of corporate bonds due during theyear ending March 2004. The Company intends to further reduce the interest-bearingdebt to ¥300.0 billion by March 2004. As for the maintenanceof the balance sheet, funding requirements for information technology, businessacquisitions, and other investments will be provided by net cash fromoperating activities.Total Shareholders’ Equity(Billions of Yen)Capital Expenditures & Depreciation(Billions of Yen)315.4424.4449.6435.0395.044.142.739.344.137.243.340.136.335.838.531 34 34 3328’99 ’00 ’01 ’02 ’03’99 ’00 ’01 ’02 ’03Shareholders’ equity ratio (%)Capital expendituresDepreciation15
In order to enhance financing efficiency, the Company has establishedcommitment lines of credit totaling ¥30.0 billion ($250 million) with specificbanks for maintaining liquidity, while reducing surplus cash as much aspossible. Furthermore, the Company implemented Group financing toimprove the efficiency of domestic subsidiaries.The Company also maintains a commercial paper program allowing for theissuance of commercial paper up to a maximum of ¥100.0 billion ($833 million).Its financial subsidiaries raise money mainly through net cash providedby operating activities and borrowings from financial institutions. Currently,the Company has adequate financing resources. The currency in which theCompany has its debt is mainly Japanese yen. There is no restriction regardingthe manner in which the funds may be spent. There is some seasonality inthe financing demand. From April to June, the Company usually has surplusfunds due to the timing of collections of notes and accounts receivablesfrom local governments.AssetsTotal assets at fiscal year-end amounted to ¥1,139.0 billion ($9,492 million),¥61.1 billion less than at the prior fiscal year-end. This was mainly due toa decline in the valuation of investment securities and a reduction of currentassets.Cash and cash equivalents increased ¥6.4 billion, to ¥67.4 billion($561 million). Notes and accounts receivable decreased ¥40.2 billion,to ¥420.4 billion ($3,503 million). These fluctuations are due to the timingof a holiday for Japanese financial institutions, which occurred on March 31,2002. Inventories decreased ¥4.1 billion, to ¥151.2 billion ($1,260 million),due to the implementation of the Company’s “Maintenance of the balancesheet” policy. The inventory turnover was 6.0 times, 0.2 point higher thanthe prior year. Total current assets were ¥692.4 billion ($5,770 million),a decrease of ¥31.4 billion. Investments decreased ¥49.5 billion, to¥92.1 billion ($767 million). This decline included a ¥19.0 billion decreasein gross unrealized holding gains and valuation losses on short-term andother investments of ¥24.8 billion. Property, plant and equipment decreased¥23.7 billion, to ¥252.6 billion ($2,105 million). Capital expenditures were¥35.8 billion ($299 million), a decrease of ¥0.5 billion. The Company managedthe amount of capital expenditures so that they would not exceed the amountof cash flows generated by operating activities. The amount of depreciationexpense incurred by operating activities was ¥38.5 billion ($321 million). Otherassets were ¥102.0 billion ($850 million), an increase of ¥43.5 billion. This wasbecause noncurrent deferred tax assets increased by ¥37.1 billion due primarilyto the sharp decrease in unrealized gains on investment securities and theincrease in minimum pension liability adjustment.LiabilitiesTotal liabilities amounted to ¥810.3 billion ($6,753 million), an increase of¥17.7 billion from the prior year. Short-term borrowings decreased ¥27.4 billion,to ¥95.6 billion ($796 million), but the current portion of long-termdebt increased ¥33.8 billion, to ¥75.8 billion ($632 million). Trade notesand accounts payable were ¥205.8 billion ($1,715 million), a decrease of¥19.8 billion. Reflecting these changes, total current liabilities decreased¥22.6 billion, to ¥479.4 billion ($3,995 million).Long-term liabilities increased ¥40.4 billion, to ¥331.0 billion ($2,758 million).Long-term debt decreased ¥11.9 billion, to ¥156.0 billion ($1,300 million),thanks to the repayment of corporate bonds in the prior year. However,accrued retirement and pension costs increased ¥53.6 billion, to ¥159.8 billion($1,332 million). This increase resulted from the decrease of plan assetsattributed to falling stock prices and from the increase in pension liabilitiesdue to the reduction of the discount rate.Net Income (Loss)(Billions of Yen)Total Assets(Billions of Yen)–8.015.116.49.89.51,378.31,320.61,290.81,200.11,139.0’99 ’00 ’01 ’02 ’03’99 ’00 ’01 ’02 ’0316
The Company’s bonds are rated “A+” by Rating & Investment Information,Inc., as of March 31, 2003. The Company’s credit rating is stable.Working capital at the fiscal year-end decreased ¥8.8 billion, to ¥213.0 billion($1,775 million). The ratio of current assets to current liabilities remainedat the same level of 144%.Total shareholders’ equity decreased ¥79.5 billion, to ¥315.4 billion($2,629 million). The ratio of shareholders’ equity to total assets decreased5.2 percentage points, to 27.7%. This decrease resulted from the increaseof ¥48.2 billion in accumulated other comprehensive loss, from the decreaseof ¥16.3 billion in retained earnings, and from the increase of ¥15.0 billionin treasury stock, at cost. The increase of ¥48.2 billion in accumulated othercomprehensive loss was mainly due to the minimum pension liability adjustmentof ¥30.4 billion (net-of-tax amount) and the unrealized losses on securitiesof ¥11.6 billion (net-of-tax amount).In order to enhance capital efficiency and create more value for shareholders,the Company commenced a program for the purchase of treasury stockin December 2001. The cumulative amount of purchases at March 31, 2003,¥21.9 billion, was deducted from shareholders’ equity, and the number ofshares of treasury stock as of March 31, 2003, was 64.4 million, 4.8% oftotal shares outstanding. For these purchases, the Company used net cashprovided by operating activities. As for next fiscal year, the Company plansto continue the purchase of treasury stock, up to the maximum additional50.0 million shares, or ¥20.0 billion.The debt-to-equity ratio was 103.8%, up 19.5 percentage points comparedwith 84.3% in the prior year. Interest-bearing debt was reduced based onfinancial policy, but such reduction was offset by the decrease in shareholders’equity due to above-mentioned factors.*Debt-to-equity ratio = interest-bearing debt / shareholders’ equity3. CASH FLOWSNet cash provided by operating activities was ¥64.3 billion ($535 million).The Company recorded a net loss of ¥8.0 billion ($67 million), but this lossincludes ¥24.8 billion of valuation losses on short-term and other investmentsand ¥17.4 billion of an impairment loss on fixed assets. The decrease in notesand accounts receivable exceeded the decrease in notes and accountspayable by ¥11.3 billion, which partially offset the decrease in net cashprovided by operating activities.Net cash used in investing activities amounted to ¥27.6 billion ($230 million).This amount includes purchases of fixed assets of ¥33.8 billion. TheCompany contained capital expenditures in recent years, but due to thecompletion of its “Hanshin Office” in October 2002, the amount of purchasesof fixed assets was larger than that of the prior year.Net cash used in financing activities amounted to ¥30.0 billion ($250 million).The Company used cash for the repayments of long-term debt of¥45.4 billion and reduction in short-term borrowings of ¥26.5 billion. TheCompany restrained the issuance of long-term debt to ¥65.6 billion and continuedto reduce total interest-bearing debt. Additionally, the Company paidcash dividends of ¥8.3 billion and spent ¥15.0 billion on the purchase oftreasury stock.As a result, including the negative effect of exchange rates, cash andcash equivalents at the end of March 2003 were ¥67.4 billion ($561 million),an increase of ¥6.4 billion as compared with the prior year.4. CRITICAL ACCOUNTING POLICIESThe consolidated financial statements are prepared in accordance withaccounting principles generally accepted in the United States of America(“US GAAP”). The preparation of the consolidated financial statementsrequires management to make estimates and assumptions on the selectionand application of significant accounting policies. The Company reviewsthese estimates and assumptions periodically. Actual results may differfrom estimated results.The following critical accounting policies that affect financial conditionand operations require management to make significant estimates andassumptions.1. Inventory valuationCompleted real estate projects are stated at the lower of acquisition cost orfair value, less estimated costs to sell. The fair values of those assets areestimated based on the appraised values in the market. Land to be developedand projects under development are carried at cost unless those assets areimpaired. If carrying amounts of those assets exceed the undiscounted futurecash flows expected to be realized from them, those assets are consideredimpaired and an impairment loss is measured based on the amount by which17
the carrying value exceeds the fair value of those assets. If the market conditionsand demand in the housing business are less favorable than management’sprojection, additional write-downs may be required.2. Collectibility of receivablesThe Company estimates the credibility of the notes and account receivable,with the estimate based on various judgments, including customers’ financialconditions, historical experience, and the current economic circumstances. Ifcustomers’ financial conditions or current economic circumstances becomeworse, additional allowances may be required in the future.3. Deferred tax assetsThe Company records deferred tax assets with a valuation allowance to adjusttheir carrying amounts when it is more likely than not that the deferred taxassets will not be realized. The valuation of deferred tax assets principallydepends on the estimation of future taxable income and tax planning strategies.If future taxable income is lower than expected due to a change ineconomic circumstances and poor operating results, significant adjustmentsto deferred tax assets may be required.4. Impairment of long-lived assetsWhen events and circumstances indicate that the carrying amount of longlivedassets to be held and used may not be recoverable and the carryingamounts of those assets exceed the undiscounted future cash flows, animpairment loss is recognized based on the amount by which the carryingvalue exceeds the fair value of the long-lived assets. Fair value is determinedprimarily using anticipated cash flows discounted at a rate commensurate withthe risk involved. If estimates of future cash flows fall below management’sprojection due to the unexpected change in economic circumstances, additionalimpairment may be required.5. Retirement and pension plansBenefit obligations and plan assets are dependent on assumptions usedby actuaries in calculating such amounts. These assumptions include thediscount rate, retirement rate, rate of compensation increase, mortality rate,expected return on plan assets, and other factors. These assumptions arebased upon current statistical data and are reviewed every fiscal year.Differences in actual experience or changes in assumptions may affectthe benefit obligations and future pension costs.5. BUSINESS RISKSThe variety and breadth of the Company’s products and customers significantlymitigate the risk that a severe impact will occur in the near term as a resultof changes in the Company’s customer base, competition, sources of supply,or composition of its markets. Additionally, such diversification enables theCompany to significantly minimize the risk of loss associated with an environmentaldisaster or political crisis in one of the countries in which the Companymanufactures or sells its products. The Company has also established a qualitycontrol program designed to ensure the safety of the Company’s products. TheCompany believes that this quality control program reduces the risk of productliability claims, from which historically the Company has not experienced anysignificant losses. As a result, it is unlikely that any one event would have asevere impact on the Company’s consolidated financial position, results ofoperations, or cash flows.6. DERIVATIVESTo offset currency and interest rate fluctuation risks, the Company usesvarious types of derivatives, including foreign exchange forward contracts,currency swaps, and interest rate swaps. As a basic policy, Kubota conductsits derivatives transactions within the range of its outstanding credits andobligations, and the Company does not engage in speculative derivativestransactions. Because the counterparties for derivatives transactions arefinancial institutions with high creditworthiness, the Company does notanticipate any credit losses on such transactions. For more specific details,please refer to Note 12 to the consolidated financial statements.7. COUNTERMEASURES FOR THE REMOVALOF GOVERNMENT DEPOSIT GUARANTEESEffective from April 2002 in Japan, limits were placed on governmentguarantees of certain short-term deposits held by financial institutions. Asa countermeasure, the Company maintains its deposits with a diverse groupof financial institutions with high credit ratings. In addition, the Companycentralized its risk management with financial institutions mainly throughconcentrating cash within the parent company.18
8. OUTLOOK FOR THE NEXT FISCAL YEARThe Company expects that the economic conditions in Japan will remain weakbecause of higher unemployment and a poor economic outlook, which arenegatively affecting personal consumption and capital expenditures. Publicinvestment in Japan also is expected to be reduced, and the U.S. economy,which impacts the world economy, is experiencing uncertainty.Under such conditions, the Company will make every effort to overcomethe difficult business environment, and it continues to work hard towardsthe vigorous and steady implementation of the Medium-Term ManagementStrategy, thus accelerating the process and attaining further improvement.Looking ahead, the Company forecasts consolidated net sales for the yearending March 31, 2004, at ¥910.0 billion, down ¥16.1 billion compared withthe prior year.The Company expects a significant increase in pension expense, due tothe deterioration in the return on investments in the pension assets and thelarge increase in pension liabilities due to the reduction of the discount rate.The Company forecasts the amount of pension expense for the year endingMarch 31, 2004, will increase approximately ¥46.0 billion. Negatively affectedby this increase, operating income is expected to be ¥7.0 billion, down ¥22.6 billion.The Company expects income before income taxes, minority interests inearnings of subsidiaries, and equity in net income of affiliated companies willbe ¥10.0 billion, up ¥3.8 billion. Finally, net income is expected to be ¥5.0 billion,up ¥13.0 billion as compared with the fiscal year under review. (Theseforecasts anticipate an exchange rate of ¥116=US$1.)Notes1. Pension expenseThe Company recognizes immediately actuarial gains and losses in excess of 20% of the larger of benefitobligations or plan assets and amortizes actuarial gains and losses between 10% and 20% overthe average participants’ remaining service period (about 15 years).The Company recognized the expense of ¥5.6 billion for the actuarial gains and losses for the yearended March 31, 2003. The Company forecasts the expense for actuarial gains and losses of approximately¥52.0 billion for the year ending March 31, 2004.Kubota Corporation was given an approval for its application for an exemption from the obligation topay benefits for future employee service related to the substitutional portion of its employee benefitpension plan on January 30, 2003. The Company will recognize the gains related to the transfer whenit completes the transfer to the government of the substitutional portion of the benefit obligation andrelated plan assets based upon US GAAP. The forecast of the above number does not include thesegains, because there is no specific schedule for the transfer.2. Segment reportingIn order to clarify the relationship between management structure and industry segments, the Companyincreased the industry segments from three to five. The five new industry segments are as follows:“Internal Combustion Engine and Machinery,” “Pipes, Valves, and Industrial Castings,” “EnvironmentalEngineering,” “Building Materials and Housing,” and “Other.”19
SEGMENT INFORMATIONThe following segment information for the years ended March 31, 2003 and2002, which is required under the regulations of the Securities and ExchangeLaw of Japan, is not consistent with accounting principles generally acceptedin the United States of America. The Company has changed the industrysegments, effective from the year ended March 31, 2003. The industry segmentinformation for the year ended March 31, 2002 has been restated toconform with the change in the industry segments of 2003.Industry SegmentsMillions of YenInternal Pipes,Combustion Valves, Building CorporateEngine & & Industrial Environmental Materials & &Year Ended March 31, 2003 Machinery Castings Engineering Housing Other Total Eliminations ConsolidatedNet sales:Unaffiliated customers ¥444,169 ¥177,217 ¥136,381 ¥64,350 ¥104,028 ¥ 926,145 ¥ — ¥ 926,145Intersegment 480 7,678 1,053 20 19,983 29,214 (29,214) —Total 444,649 184,895 137,434 64,370 124,011 955,359 (29,214) 926,145Cost of sales and operating expenses 387,953 182,963 128,423 64,338 141,153 904,830 (8,298) 896,532Operating income (loss) ¥ 56,696 ¥ 1,932 ¥ 9,011 ¥ 32 ¥ (17,142) ¥ 50,529 ¥ (20,916) ¥ 29,613Identifiable assets at March 31, 2003 ¥487,841 ¥222,708 ¥116,136 ¥77,515 ¥106,027 ¥1,010,227 ¥128,784 ¥1,139,011Depreciation 13,717 8,032 748 2,820 10,571 35,888 2,606 38,494Capital expenditures 14,159 5,354 782 1,117 8,582 29,994 5,851 35,845Millions of YenInternal Pipes,Combustion Valves, Building CorporateEngine & & Industrial Environmental Materials & &Year Ended March 31, 2002 Machinery Castings Engineering Housing Other Total Eliminations ConsolidatedNet sales:Unaffiliated customers ¥415,122 ¥184,540 ¥147,988 ¥110,859 ¥107,282 ¥ 965,791 ¥ — ¥ 965,791Intersegment 402 7,003 818 7 28,227 36,457 (36,457) —Total 415,524 191,543 148,806 110,866 135,509 1,002,248 (36,457) 965,791Cost of sales and operating expenses 367,754 180,308 140,925 123,867 134,722 947,576 (16,209) 931,367Operating income (loss) ¥ 47,770 ¥ 11,235 ¥ 7,881 ¥ (13,001) ¥ 787 ¥ 54,672 ¥ (20,248) ¥ 34,424Identifiable assets at March 31, 2002 ¥478,390 ¥231,832 ¥122,879 ¥ 76,979 ¥129,614 ¥1,039,694 ¥160,423 ¥1,200,117Depreciation 14,125 9,002 720 2,968 10,767 37,582 2,492 40,074Capital expenditures 14,107 7,181 534 2,892 8,786 33,500 2,842 36,342Thousands of U.S. DollarsInternal Pipes,Combustion Valves, Building CorporateEngine & & Industrial Environmental Materials & &Year Ended March 31, 2003 Machinery Castings Engineering Housing Other Total Eliminations ConsolidatedNet sales:Unaffiliated customers $3,701,408 $1,476,809 $1,136,508 $536,250 $ 866,900 $7,717,875 $ — $7,717,875Intersegment 4,000 63,983 8,775 167 166,525 243,450 (243,450) —Total 3,705,408 1,540,792 1,145,283 536,417 1,033,425 7,961,325 (243,450) 7,717,875Cost of sales and operating expenses 3,232,941 1,524,692 1,070,192 536,150 1,176,275 7,540,250 (69,150) 7,471,100Operating income (loss) $ 472,467 $ 16,100 $ 75,091 $ 267 $ (142,850) $ 421,075 $ (174,300) $ 246,775Identifiable assets at March 31, 2003 $4,065,342 $1,855,900 $ 967,800 $645,958 $ 883,558 $8,418,558 $1,073,200 $9,491,758Depreciation 114,308 66,933 6,233 23,500 88,092 299,066 21,717 320,783Capital expenditures 117,991 44,617 6,517 9,308 71,517 249,950 48,758 298,70820
Geographic SegmentsMillions of YenCorporate&Year Ended March 31, 2003 Japan North America Other Areas Total Eliminations ConsolidatedNet sales:Unaffiliated customers ¥712,964 ¥158,051 ¥55,130 ¥ 926,145 ¥ — ¥ 926,145Intersegment 124,213 2,439 1,268 127,920 (127,920) —Total 837,177 160,490 56,398 1,054,065 (127,920) 926,145Cost of sales and operating expenses 807,122 144,348 52,720 1,004,190 (107,658) 896,532Operating income ¥ 30,055 ¥ 16,142 ¥ 3,678 ¥ 49,875 ¥ (20,262) ¥ 29,613Identifiable assets at March 31, 2003 ¥840,053 ¥161,664 ¥42,623 ¥1,044,340 ¥ 94,671 ¥1,139,011Millions of YenCorporate&Year Ended March 31, 2002 Japan North America Other Areas Total Eliminations ConsolidatedNet sales:Unaffiliated customers ¥773,114 ¥143,959 ¥48,718 ¥ 965,791 ¥ — ¥ 965,791Intersegment 103,428 2,907 656 106,991 (106,991) —Total 876,542 146,866 49,374 1,072,782 (106,991) 965,791Cost of sales and operating expenses 841,152 129,213 46,596 1,016,961 (85,594) 931,367Operating income ¥ 35,390 ¥ 17,653 ¥ 2,778 ¥ 55,821 ¥ (21,397) ¥ 34,424Identifiable assets at March 31, 2002 ¥847,749 ¥144,964 ¥37,858 ¥1,030,571 ¥ 169,546 ¥1,200,117Thousands of U.S. DollarsCorporate&Year Ended March 31, 2003 Japan North America Other Areas Total Eliminations ConsolidatedNet sales:Unaffiliated customers $5,941,367 $1,317,092 $459,416 $7,717,875 $ — $7,717,875Intersegment 1,035,108 20,325 10,567 1,066,000 (1,066,000) —Total 6,976,475 1,337,417 469,983 8,783,875 (1,066,000) 7,717,875Cost of sales and operating expenses 6,726,017 1,202,900 439,333 8,368,250 (897,150) 7,471,100Operating income $ 250,458 $ 134,517 $ 30,650 $ 415,625 $ (168,850) $ 246,775Identifiable assets at March 31, 2003 $7,000,441 $1,347,200 $355,192 $8,702,833 $ 788,925 $9,491,758Sales by RegionMillions of YenThousands ofU.S. DollarsYears Ended March 31, 2003 and 2002 2003 2002 2003Japan ¥684,254 73.9% ¥753,175 78.0% $5,702,117Overseas:North America 158,386 17.1 144,207 14.9 1,319,883Other Areas 83,505 9.0 68,409 7.1 695,875Subtotal 241,891 26.1 212,616 22.0 2,015,758Total ¥926,145 100.0% ¥965,791 100.0% $7,717,875Sales by region represent sales to unaffiliated customers based on the customers’ locations.21
Consolidated Balance SheetsKubota Corporation and Subsidiaries March 31, 2003 and 2002Thousands ofU.S. DollarsMillions of Yen (Note 1)ASSETS 2003 2002 2003Current assets:Cash and cash equivalents ¥ 67,362 ¥ 60,983 $ 561,350Short-term investments (Note 4) 10 1,394 83Notes and accounts receivable (Note 3):Trade notes 81,588 103,701 679,900Trade accounts 252,537 271,635 2,104,475Finance receivables—net 90,338 89,253 752,817Less: Allowance for doubtful notes and accounts receivable (4,089) (4,052) (34,075)Inventories (Note 2) 151,245 155,354 1,260,375Other current assets (Note 9) 53,359 45,496 444,658Total current assets 692,350 723,764 5,769,583Investments:Investments in and advances to affiliated companies (Note 3) 12,119 12,740 100,992Other investments (Note 4) 79,959 128,876 666,325Total investments 92,078 141,616 767,317Property, plant, and equipment (Note 5):Land 78,552 88,315 654,600Buildings 195,497 197,603 1,629,142Machinery and equipment 447,956 452,156 3,732,966Construction in progress 5,451 4,253 45,425Total 727,456 742,327 6,062,133Accumulated depreciation (474,901) (466,116) (3,957,508)Net property, plant, and equipment 252,555 276,211 2,104,625Other assets (Note 9) 102,028 58,526 850,233Total ¥1,139,011 ¥1,200,117 $9,491,758See notes to consolidated financial statements.22
Thousands ofU.S. DollarsMillions of Yen (Note 1)LIABILITIES AND SHAREHOLDERS’ EQUITY 2003 2002 2003Current liabilities:Short-term borrowings (Note 5) ¥ 95,568 ¥ 122,977 $ 796,400Trade notes payable 37,544 42,909 312,867Trade accounts payable 168,240 182,675 1,402,000Advances received from customers 7,244 7,886 60,367Notes and accounts payable for capital expenditures 14,803 15,746 123,358Accrued payroll costs 23,791 22,656 198,258Income taxes payable 10,150 12,587 84,583Other current liabilities (Note 14) 46,194 52,494 384,950Current portion of long-term debt (Note 5) 75,830 42,076 631,917Total current liabilities 479,364 502,006 3,994,700Long-term liabilities:Long-term debt (Note 5) 155,966 167,850 1,299,717Accrued retirement and pension costs (Note 6) 159,805 106,206 1,331,708Other long-term liabilities (Note 9) 15,184 16,537 126,533Total long-term liabilities 330,955 290,593 2,757,958Commitments and contingencies (Note 14)Minority interests 13,249 12,548 110,408Shareholders’ equity (Notes 7 and 11):Common stock,authorized 2,000,000,000 shares; outstanding 1,345,450,014 sharesand 1,390,419,012 shares in 2003 and 2002, respectively 78,156 78,156 651,300Additional paid-in capital 87,263 87,263 727,192Legal reserve 19,539 19,539 162,825Retained earnings 200,517 216,810 1,670,975Accumulated other comprehensive income (loss) (48,095) 128 (400,792)Treasury stock (64,358,964 shares and 19,389,966 shares in 2003 and 2002, respectively), at cost (21,937) (6,926) (182,808)Total shareholders’ equity 315,443 394,970 2,628,692Total ¥1,139,011 ¥1,200,117 $9,491,75823
Consolidated Statements of IncomeKubota Corporation and Subsidiaries Years Ended March 31, 2003, 2002, and 2001Thousands ofU.S. DollarsMillions of Yen (Note 1)2003 2002 2001 2003Net sales (Note 3) ¥926,145 ¥965,791 ¥984,767 $7,717,875Cost of sales 695,571 729,863 742,516 5,796,425Selling, general, and administrative expenses 181,353 188,713 198,569 1,511,275Loss from disposal and impairment of businesses and fixed assets (Note 13) 19,608 12,791 489 163,400Operating income 29,613 34,424 43,193 246,775Other income (expenses):Interest and dividend income 7,622 7,506 10,042 63,517Interest expense (4,818) (6,697) (8,140) (40,150)Gain on contribution of securities to the employee retirement benefit trust (Notes 4 and 6) — — 19,277 —Valuation losses on short-term and other investments (24,822) (9,166) (2,922) (206,850)Other—net (Note 8) (1,439) 2,616 (662) (11,992)Other income (expenses), net (23,457) (5,741) 17,595 (195,475)Income before income taxes, minority interests in earnings of subsidiaries,equity in net income (loss) of affiliated companies,and cumulative effect of an accounting change 6,156 28,683 60,788 51,300Income taxes (Note 9):Current 21,538 22,905 25,192 179,483Deferred (9,242) (5,591) 3,038 (77,016)Total income taxes 12,296 17,314 28,230 102,467Minority interests in earnings of subsidiaries 2,097 1,660 1,439 17,475Equity in net income (loss) of affiliated companies (Note 3) 233 (179) 235 1,942Income (loss) before cumulative effect of an accounting change (8,004) 9,530 31,354 (66,700)Cumulative effect of an accounting change (Note 6) — — (21,559) —Net income (loss) ¥ (8,004) ¥ 9,530 ¥ 9,795 $ (66,700)U.S. DollarsYen (Note 1)Net income (loss) per 5 common shares (Note 10):Basic:Income (loss) before cumulative effect of an accounting change ¥(29) ¥34 ¥111 $(0.24)Cumulative effect of an accounting change — — (76) —Net income (loss) (29) 34 35 (0.24)Diluted:Income (loss) before cumulative effect of an accounting change (29) 33 104 (0.24)Cumulative effect of an accounting change — — (70) —Net income (loss) (29) 33 34 (0.24)See notes to consolidated financial statements.24
Consolidated Statements of Comprehensive Income (Loss)Kubota Corporation and Subsidiaries Years Ended March 31, 2003, 2002, and 2001Thousands ofU.S. DollarsMillions of Yen (Note 1)2003 2002 2001 2003Net income (loss) ¥ (8,004) ¥ 9,530 ¥ 9,795 $ (66,700)Other comprehensive income (loss), net of tax (Note 11):Foreign currency translation adjustments (6,366) 9,094 5,657 (53,050)Unrealized losses on securities (11,602) (32,187) (38,568) (96,683)Minimum pension liability adjustment (30,386) (10,671) 16,807 (253,217)Unrealized gains (losses) on derivatives 131 (390) — 1,092Other comprehensive loss (48,223) (34,154) (16,104) (401,858)Comprehensive loss ¥(56,227) ¥(24,624) ¥ (6,309) $(468,558)See notes to consolidated financial statements.Consolidated Statements of Shareholders’ EquityKubota Corporation and Subsidiaries Years Ended March 31, 2003, 2002, and 2001Millions of YenShares ofAccumulatedCommon Stock Additional Other TreasuryOutstanding Common Paid-in Legal Retained Comprehensive Stock(Thousands) Stock Capital Reserve Earnings Income (Loss) at CostBalance, March 31, 2000 1,409,655 ¥78,107 ¥87,213 ¥19,527 ¥214,414 ¥ 50,386 ¥ —Stock issued on conversion of debt 154 49 50Net income 9,795Other comprehensive loss (16,104)Cash dividends, ¥30 per 5 common shares (8,458)Transfer to legal reserve 12 (12)Balance, March 31, 2001 1,409,809 78,156 87,263 19,539 215,739 34,282 —Net income 9,530Other comprehensive loss (34,154)Cash dividends, ¥30 per 5 common shares (8,459)Purchases of treasury stock (19,390) (6,926)Balance, March 31, 2002 1,390,419 78,156 87,263 19,539 216,810 128 (6,926)Net loss (8,004)Other comprehensive loss (48,223)Cash dividends, ¥30 per 5 common shares (8,289)Purchases of treasury stock (44,969) (15,011)Balance, March 31, 2003 1,345,450 ¥78,156 ¥87,263 ¥19,539 ¥200,517 ¥(48,095) ¥(21,937)Thousands of U.S. Dollars (Note 1)AccumulatedAdditional Other TreasuryCommon Paid-in Legal Retained Comprehensive StockStock Capital Reserve Earnings Income (Loss) at CostBalance, March 31, 2002 $651,300 $727,192 $162,825 $1,806,750 $ 1,066 $ (57,716)Net loss (66,700)Other comprehensive loss (401,858)Cash dividends, $0.25 per 5 common shares (69,075)Purchases of treasury stock (125,092)Balance, March 31, 2003 $651,300 $727,192 $162,825 $1,670,975 $(400,792) $(182,808)See notes to consolidated financial statements. 25
Consolidated Statements of Cash FlowsKubota Corporation and Subsidiaries Years Ended March 31, 2003, 2002, and 2001Thousands ofU.S. DollarsMillions of Yen (Note 1)2003 2002 2001 2003Operating activities:Net income (loss) ¥ (8,004) ¥ 9,530 ¥ 9,795 $ (66,700)Adjustments to reconcile net income (loss) to net cash providedby operating activities:Cumulative effect of an accounting change — — 21,559 —Depreciation and amortization 38,804 40,535 43,926 323,366Provision for doubtful receivables 817 210 1,090 6,808Provision for (reversal of) accrued retirement and pension costs (4,416) 1,267 3,896 (36,800)Loss (gain) on sales of securities 5 (2,578) (821) 42Valuation losses on short-term and other investments 24,822 9,166 2,922 206,850Loss (gain) on disposals of fixed assets 2,484 1,725 (1,532) 20,700Impairment loss on fixed assets 17,403 4,734 — 145,025Gain on contribution of securities to the employee retirement benefit trust — — (19,277) —Equity in net loss (income) of affiliated companies (233) 179 (235) (1,942)Deferred income taxes (9,242) (5,591) 3,038 (77,016)Change in assets and liabilities, net of effects from sales of businesses:Decrease (increase) in notes and accounts receivable 31,649 12,752 (46,549) 263,742Decrease in inventories 2,455 23,260 3,474 20,458Decrease (increase) in other current assets (5,637) 75 854 (46,975)Increase (decrease) in trade notes and accounts payable (20,315) (9,958) 19,053 (169,292)Increase (decrease) in income taxes payable (2,332) (1,310) 2,526 (19,433)Decrease in other current liabilities (3,340) (3,575) (3,919) (27,833)Other (667) (2,595) 8,727 (5,558)Net cash provided by operating activities 64,253 77,826 48,527 535,442Investing activities:Purchases of fixed assets (33,838) (32,473) (36,250) (281,984)Purchases of investments and change in advances (2,056) (2,333) (327) (17,133)Proceeds from sales of property, plant, and equipment 1,803 2,002 5,519 15,025Proceeds from sales of investments 5,153 7,916 2,955 42,942Net decrease in short-term investments 1,384 1,102 5,565 11,533Cash transferred in sale of business — (10,237) — —Other (39) (435) (486) (325)Net cash used in investing activities (27,593) (34,458) (23,024) (229,942)Financing activities:Proceeds from issuance of long-term debt 65,627 28,202 11,416 546,892Repayments of long-term debt (45,447) (71,034) (49,365) (378,725)Net increase (decrease) in short-term borrowings (26,548) (2,846) 20,460 (221,233)Cash dividends (8,289) (8,459) (8,458) (69,075)Purchases of treasury stock (15,011) (6,926) — (125,092)Other (341) (231) (171) (2,842)Net cash used in financing activities (30,009) (61,294) (26,118) (250,075)Effect of exchange rate changes on cash and cash equivalents (272) 276 606 (2,267)Net increase (decrease) in cash and cash equivalents 6,379 (17,650) (9) 53,158Cash and cash equivalents, beginning of year 60,983 78,633 78,642 508,19226Cash and cash equivalents, end of year ¥67,362 ¥60,983 ¥78,633 $561,350See notes to consolidated financial statements.
Notes to Consolidated Financial StatementsKubota Corporation and Subsidiaries Years Ended March 31, 2003, 2002, and 20011. SUMMARY OF SIGNIFICANT ACCOUNTING POLICIESDescription of BusinessKubota Corporation (the “parent company”) and subsidiaries (collectively the“Company”) are one of Japan’s leading manufacturers of a comprehensiverange of machinery and other industrial and consumer products, including farmequipment, engines, pipe and fluid systems engineering, industrial castings,environmental control plant, and housing materials and equipment.The manufacturing operations of the Company are conducted primarilyat 21 plants in Japan and at 5 overseas plants located in the United States andcertain other countries. Farm equipment, construction machinery, ductile ironpipe, and certain other products are not only sold in Japan but are also sold inoverseas markets which consist mainly of North America, Europe, and Asia.Basis of Financial StatementsThe consolidated financial statements, stated in Japanese yen, reflect certainadjustments, not recorded in the books of account of the Company, to presentthese statements in accordance with accounting principles generally accepted inthe United States of America (“US GAAP”) with the exception of FASB EmergingIssues Task Force (“EITF”), Issue No. 91-5, “Nonmonetary Exchange of Cost-Method Investments” (see Investments). The principal adjustments include:(1) valuation of inventories, (2) accrual of certain expenses, (3) accountingfor retirement and pension plans, including the effect of the transfer to theJapanese government of the substitutional portion of employee pension fundliabilities, (4) recognition of warrant values, (5) accounting for stock dividendsapproved by shareholders in prior years at market value, (6) accounting forderivatives, and (7) recognition of deferred income tax relating to these adjustments.The presentation of segment information required by Statement ofFinancial Accounting Standards (“SFAS”) No. 131, “Disclosures about Segmentsof an Enterprise and Related Information,” also has been omitted.Certain reclassifications have been made to the consolidated financialstatements for 2002 and 2001 to conform with classifications usedin 2003.Translation into United States DollarsThe parent company and its domestic subsidiaries maintain their accounts inJapanese yen, the currency of the country in which they are incorporated andprincipally operate. The United States dollar amounts included herein representa translation using the approximate exchange rate at March 31, 2003 of¥120=US$1, solely for convenience. The translation should not be construedas a representation that the yen amounts have been, could have been, orcould in the future be, converted into United States dollars.ConsolidationThe consolidated financial statements include the accounts of the parent companyand all majority-owned subsidiaries. Significant intercompany items havebeen eliminated in consolidation.Investments mainly in 20%~50%-owned companies (the “affiliated companies”)are stated at cost plus equity in undistributed net income from acquisitionor formation.Revenue RecognitionThe Company recognizes revenue when (1) persuasive evidence of an arrangementexists, (2) delivery has occurred or services have been rendered, (3) thesales price is fixed or determinable, and (4) collectibility is reasonably assured.As for environmental and other plant and equipment, sales are recorded atthe time when the installation of plant and equipment is completed and acceptedby the customer. For long-term contracts, such sales are recorded underthe percentage-of-completion method of accounting. Housing real estate salesare recorded when the title is legally transferred to the customer in accordancewith the underlying contract and real estate laws and regulations. Estimatedlosses on sales contracts are recorded in the period in which they are identified.In the case of finance receivables in which the face amount includes financecharges (principally retail financing), income is recorded over the terms of thereceivables using the interest method.On April 1, 2002, the Company adopted EITF 01-9, “Accounting forConsideration Given by a Vendor to a Customer (Including a Reseller of theVendor’s Products).” As a result, sales incentives previously classified as selling,general, and administrative expenses for the years ended March 31, 2002 and2001 have been reclassified as a reduction of revenues to conform to the presentationfor the year ended March 31, 2003. The impact of this change on theoperating income and net income (loss) of the Company is not material.Foreign Currency TranslationUnder the provisions of SFAS No. 52,“Foreign Currency Translation,” assetsand liabilities of foreign subsidiaries are translated into Japanese yen at yearendexchange rates, and income and expenses are translated at the averageexchange rates for the year. The resulting translation adjustments are includedin accumulated other comprehensive income (loss) in the accompanying consolidatedbalance sheets. Exchange gains and losses resulting from foreigncurrency transactions and translation of assets and liabilities denominated inforeign currencies are included in the consolidated statements of income.InventoriesManufacturing inventories are stated at the lower of cost, substantially determinedusing the average-cost method, or market, representing the estimatedselling price less costs to sell. Completed real estate projects are stated at thelower of acquisition cost or fair value less estimated costs to sell. The fair valuesof those assets are estimates based on the appraised values in the market.Land to be developed and projects under development are carried at costunless an impairment loss is required. An impairment loss on those assets isrecognized when their carrying amounts exceed the undiscounted future cashflows expected to be realized from them and is measured based on the presentvalues of those expected future cash flows.InvestmentsUnder SFAS No. 115, “Accounting for Certain Investments in Debt and EquitySecurities,” the Company classifies all its debt securities and marketable equitysecurities as available for sale and carries them at fair value with a correspondingrecognition of the net unrealized holding gain or loss (net of tax) as an othercomprehensive income item of shareholders’ equity. The fair values of those27
securities are determined based on quoted market prices.Gains and losses on sales of available-for-sale securities as well as othernonmarketable equity securities which are carried at cost are computed on theaverage-cost method. Losses from the impairment of marketable and nonmarketablesecurities, if any, are charged to expenses in the period in which adecline in fair value is determined to be other than temporary.On April 1, 1996, The Bank of Tokyo, Ltd. (“BOT”) and The Mitsubishi Bank,Limited, merged. Upon the merger, each common share of BOT owned by theCompany which had been carried at cost was converted into 0.8 share of thecombined entity, The Bank of Tokyo-Mitsubishi, Ltd. (currently part ofMitsubishi Tokyo Financial Group, Inc.) For purposes of comparability withfinancial statements under Japanese GAAP, the Company did not account forthe exchange under EITF 91-5, which requires recognition of a nonmonetaryexchange gain on the common shares of BOT.If EITF 91-5 had been adopted, net loss would have increased by¥545 million ($4,542 thousand) for the year ended March 31, 2003. Netincome would have decreased by ¥603 million for the year ended March 31,2002, decreased by ¥1,650 million for the year ended March 31, 2001, andincreased by ¥3,081 million for the year ended March 31, 1997. Retainedearnings would have decreased by ¥380 million ($3,167 thousand) at March31, 2003, and increased by ¥165 million at March 31, 2002, with a correspondingincrease (decrease) in accumulated other comprehensive income.These amounts primarily reflect the unrecognized gain on the initial nonmonetaryexchange in 1997 and subsequent losses on impairment of theinvestment in 2003, 2002, and 2001.Property, Plant, and EquipmentProperty, plant, and equipment are stated at cost less accumulated depreciation.Depreciation of plant and equipment is principally computed using thedeclining-balance method based on the estimated useful lives of the assets.The estimated useful lives are principally as follows:Buildings10~50 yearsMachinery and equipment2~14 yearsIncome TaxesThe Company accounts for income taxes in accordance with SFAS No. 109,“Accounting for Income Taxes.” Under SFAS No. 109, deferred tax assets andliabilities are computed based on the differences between the financial statementand the income tax bases of assets and liabilities and tax loss and othercarryforwards using the enacted tax rate. A valuation allowance is established,when necessary, to reduce deferred tax assets to the amount that managementbelieves will more likely than not be realized.AdvertisingThe costs of advertising are expensed as incurred.Shipping and Handling CostsShipping and handling costs are included in selling, general, and administrativeexpenses.Net Income and Cash Dividends per 5 Common SharesPer share amounts have been calculated per 5 common shares since eachAmerican Depositary Share represents 5 shares of common stock.Basic net income per 5 common shares has been computed by dividing netincome available to common shareholders by the weighted average number ofcommon shares outstanding for the period.Diluted net income per 5 common shares reflects the potential dilutionand has been computed on the basis that all convertible debentures wereconverted at the beginning of the year or at the time of issuance (if later).Cash dividends per 5 common shares are based on dividends paid duringthe year.Derivative Financial InstrumentsOn April 1, 2001, the Company adopted SFAS No. 133, “Accounting forDerivative Instruments and Hedging Activities,” and No. 138, “Accounting forCertain Derivative Instruments and Certain Hedging Activities, an amendmentof FASB Statement No. 133.” Both standards establish accounting and reportingstandards for derivative instruments and for hedging activities, and requirethat an entity recognize all derivatives as either assets or liabilities in the balancesheet and measure those instruments at fair value.On the date the derivative contract is entered into, the Company designatesthe derivative as a hedge of a forecasted transaction or the variability of cashflows to be received or paid related to a recognized asset or liability (“cashflow” hedge). The Company formally documents all relationships betweenhedging instruments and hedged items, as well as its risk management objectiveand strategy for undertaking various hedge transactions. This processincludes linking all derivatives that are designated as cash flow hedges to specificassets and liabilities on the consolidated balance sheet or to specific firmcommitments or forecasted transactions. The Company considers all hedgesto be highly effective in offsetting changes in cash flows of hedged items,because the currency, index of interest rates, amount, and terms of thederivatives correspond to those of the hedged items in accordance with theCompany’s policy.Changes in the fair value of a derivative that is highly effective and that isdesignated and qualifies as a cash flow hedge are recorded in other comprehensiveincome (loss), until earnings are affected by the variability in cashflows of the designated hedged item.The transition adjustment upon the adoption of SFAS 133 and 138, net ofthe related income tax effect, was not material.Prior to the adoption of SFAS 133 and 138, gains and losses on forwardcontracts were recognized based on changes in exchange rates and were offsetagainst foreign exchange gains or losses on the hedged financing obligationsand accounts receivable or payable. Interest rate derivatives and changesin their fair values were not included in the consolidated financial statements.Instead, interest differentials paid or received under interest rate derivativesdesignated as hedges of exposures to changes in interest rates associatedwith short- or long-term debt were recorded in interest expense over thecontract period as an adjustment to the effective yields of the related debt.28
Impairment of Long-Lived AssetsOn April 1, 2002, the Company adopted SFAS No. 144, “Accounting for theImpairment or Disposal of Long-Lived Assets,” which supersedes certain provisionsof APB Opinion No. 30, “<strong>Report</strong>ing the Results of Operations—<strong>Report</strong>ingthe Effects of Disposal of Segment of a Business, and Extraordinary, Unusualand Infrequently Occurring Events and Transactions,” and supersedes SFASNo.121, “Accounting for the Impairment of Long-Lived Assets and for Long-Lived Assets to Be Disposed Of.” SFAS No. 144 provides a single accountingmodel for long-lived assets to be disposed of. Although SFAS No.144 retainsthe fundamental provisions of SFAS No.121, it establishes criteria to determinewhen a long-lived asset is held for sale, provides guidance on how a long-livedasset that is used should be evaluated for impairment, and prescribes theaccounting for a long-lived asset that will be disposed of other than by sale.SFAS No.144 retains the basic provision of APB Opinion No. 30 on how topresent discontinued operations in the statement of income but broadens thatpresentation to include a component of an entity (rather than a segment of abusiness). In accordance with SFAS No. 144, the Company reviews the carryingvalue of long-lived assets when events and circumstances indicate that thecarrying amount of an asset may not be recoverable. In such an event, the estimatedfuture undiscounted cash flows associated with the asset is comparedwith the carrying value of the asset to determine if a write-down is required. Ifthis evaluation indicates that the carrying value exceeds its estimated futurecash flows of the long-lived asset, the Company recognizes an impairment lossbased on the amount by which the carrying value exceeds the fair value of thelong-lived asset. Fair value is determined primarily using anticipated cash flowsdiscounted at a rate commensurate with the risk involved.The adoption of SFAS No. 144 had no effect on the Company’s consolidatedfinancial statements for the year ended March 31, 2003. Prior to the adoptionof SFAS No. 144, the Company accounted for long-lived assets in accordancewith SFAS No.121.Cash Flow InformationThe Company considers all highly liquid investments with an original maturityof three months or less to be cash equivalents. At March 31, 2003, 2002,and 2001, time deposits of which original maturities were three months orless amounting to ¥14,945 million ($124,542 thousand), ¥13,209 million,and ¥13,176 million, respectively, were included in cash and cash equivalents.Cash paid for interest amounted to ¥4,759 million ($39,658 thousand),¥7,123 million, and ¥8,048 million, and for income taxes amounted to¥24,117 million ($200,975 thousand), ¥24,351 million, and ¥22,800 millionin 2003, 2002, and 2001, respectively.Noncash transactions in 2001 included a contribution of securities witha fair value of ¥33,116 million to the employee retirement benefit trust.Use of Estimates in the Preparation of the Financial StatementsManagement uses estimates in preparing the consolidated financial statementsin conformity with US GAAP. Significant estimates used in the preparation ofthe consolidated financial statements are primarily in the areas of collectibilityof private-sector notes and accounts receivable, inventory valuation, impairmentof long-lived assets, valuation allowance for deferred tax assets, andaccruals for employee retirement and pension plans. These estimates areassessed by the Company on a regular basis and management believes thatmaterial changes will not occur in the near term, although actual results couldultimately differ from these estimates.New Accounting StandardsIn April 2003, the Financial Accounting Standards Board (“FASB”) issued SFASNo.149, “Amendment of Statement 133 on Derivative Instruments and HedgingActivities,” which is effective for contracts entered into or modified after June30, 2003. The Statement amends and clarifies accounting for derivative instruments,including certain derivative instruments embedded in other contracts,and for hedging activities under Statement 133. The Company is currentlyreviewing this statement to determine its impact on future financial statements.2. INVENTORIESInventories at March 31, 2003 and 2002 were as follows:Thousands ofMillions of YenU.S. Dollars2003 2002 2003Manufacturing:Finished products ¥ 88,810 ¥ 89,969 $ 740,083Spare parts 16,869 18,589 140,575Work in process 23,860 22,721 198,833Raw materials and supplies 14,804 15,565 123,367Subtotal 144,343 146,844 1,202,858Real estate:Completed projects, land to be developed, and projects under development 6,902 8,510 57,517¥151,245 ¥155,354 $1,260,375The Company wrote down the value of completed projects, land to be developed,and projects under development by ¥45 million ($375 thousand) and¥4,132 million in 2003 and 2002, respectively. These amounts were includedin cost of sales in the consolidated statements of income.29
3. INVESTMENTS IN AND ADVANCES TO AFFILIATED COMPANIESInvestments in and advances to affiliated companies at March 31, 2003 and 2002 consisted of the following:Thousands ofMillions of YenU.S. Dollars2003 2002 2003Investments ¥10,069 ¥ 9,967 $ 83,909Advances 2,050 2,773 17,083A summary of financial information of affiliated companies is as follows:¥12,119 ¥12,740 $100,992Thousands ofMillions of YenU.S. DollarsAt March 31, 2003 and 2002 2003 2002 2003Current assets ¥ 65,787 ¥ 76,381 $ 548,225Noncurrent assets 54,961 59,125 458,008Total assets 120,748 135,506 1,006,233Current liabilities 70,055 81,852 583,792Noncurrent liabilities 23,839 26,180 198,658Net assets ¥ 26,854 ¥ 27,474 $ 223,783Millions of YenYears ended March 31, 2003, 2002, and 2001 2003 2002 2001 2003Thousands ofU.S. DollarsNet sales ¥174,233 ¥183,161 ¥182,855 $1,451,942Cost of sales 133,671 140,597 140,668 1,113,925Other income—net 1,860 2,010 1,731 15,500Net income 1,711 2,167 482 14,258Trade notes and accounts receivable from affiliated companies at March 31,2003 and 2002 were ¥27,164 million ($226,367 thousand) and ¥29,754 million,respectively.Sales to affiliated companies aggregated ¥82,433 million ($686,942 thousand),¥86,250 million, and ¥80,339 million in 2003, 2002, and 2001, respectively.Cash dividends received from affiliated companies were ¥523 million($4,358 thousand), ¥457 million, and ¥448 million in 2003, 2002, and2001, respectively.30
4. SHORT-TERM AND OTHER INVESTMENTSThe cost, fair value, and gross unrealized holding gains and losses for securities by major security type at March 31, 2003 and 2002 were as follows:Millions of Yen2003 2002Gross Gross Gross GrossUnrealized Unrealized Unrealized UnrealizedHolding Holding Holding HoldingCost Fair Value Gains Losses Cost Fair Value Gains LossesShort-term investments:Available-for-sale:Governmental and corporate debt securities ¥ 10 ¥ 10 ¥ — ¥ — ¥ 1,394 ¥ 1,394 ¥ — ¥ —Other investments:Available-for-sale:Equity securities of financial institutions 24,477 33,033 8,558 2 48,726 68,720 20,019 25Other equity securities 21,961 32,361 12,369 1,969 25,620 44,582 19,900 938Other 1,593 1,639 72 26 2,391 2,392 79 78¥48,041 ¥67,043 ¥20,999 ¥1,997 ¥78,131 ¥117,088 ¥39,998 ¥1,041Thousands of U.S. Dollars2003Gross GrossUnrealized UnrealizedHolding HoldingCost Fair Value Gains LossesShort-term investments:Available-for-sale:Governmental and corporate debt securities $ 83 $ 83 $ — $ —Other investments:Available-for-sale:Equity securities of financial institutions 203,975 275,275 71,317 17Other equity securities 183,008 269,675 103,075 16,408Other 13,275 13,658 600 217$400,341 $558,691 $174,992 $16,642Investments in non-traded and unaffiliated companies, for which there isno readily determinable fair value, were stated at cost of ¥12,926 million($107,717 thousand) and ¥13,182 million at March 31, 2003 and 2002,respectively.Proceeds from sales of available-for-sale securities and gross realized gains and losses that have been included in earnings as a result of those sales for the yearsended March 31, 2003, 2002, and 2001, were as follows:Thousands ofMillions of YenU.S. Dollars2003 2002 2001 2003Proceeds from sales ¥5,153 ¥7,916 ¥2,955 $42,942Gross realized gains 654 3,739 1,354 5,450Gross realized losses (659) (1,161) (533) (5,492)In addition to these sales, the Company contributed available-for-salemarketable equity securities with a fair value of ¥33,116 million to a newlyestablished employee retirement benefit trust, and recognized a gain on thiscontribution of ¥19,227 million, in the year ended March 31, 2001. Therewere no proceeds to the Company from this transaction (also see Note 6).At March 31, 2003, the cost of debt securities classified as available-for-saledue after one year through five years and due after five years were ¥793 million($6,608 thousand) and ¥800 million ($6,667 thousand), respectively.At March 31, 2003, the Company had no debt securities classified asavailable-for-sale due within one year.For the years ended March 31, 2003, 2002, and 2001, valuation losseson short-term and other investments were recognized to reflect the declinein fair value considered to be other than temporary totaling ¥24,822 million($206,850 thousand), ¥9,166 million, and ¥2,922 million, respectively.31
5. SHORT-TERM BORROWINGS AND LONG-TERM DEBTThe balances of short-term borrowings at March 31, 2003 and 2002 consistedof notes payable to banks. Stated annual interest rates of short-term borrowingsranged primarily from 0.29% to 2.07% and from 0.3% to 3.03% at March 31,2003 and 2002, respectively. The weighted average interest rates on suchshort-term borrowings at March 31, 2003 and 2002 were 1.1% and 1.4%,respectively.Available lines of credit with certain banks totaled ¥30,000 million($250,000 thousand) at March 31, 2003 and 2002, respectively. Noamounts were outstanding as of March 31, 2003 and 2002.Long-term debt at March 31, 2003 and 2002 consisted of the following:Millions of YenThousands ofU.S. DollarsYears Ending March 31 2003 2002 2003Unsecured bonds:1.51% Yen bonds 2003 ¥ — ¥ 10,000 $ —1.475% Yen bonds 2004 10,000 10,000 83,3332.7% Yen bonds 2004 10,000 10,000 83,3331.8% Yen bonds 2006 10,000 10,000 83,333Unsecured convertible bonds:1.6% Yen bonds 2003 — 9,772 —0.8% Yen bonds 2004 29,756 29,756 247,9670.85% Yen bonds 2005 19,513 19,513 162,6090.9% Yen bonds 2006 18,627 18,627 155,225Loans, principally from banks and insurance companies,maturing on various dates through 2013:Collateralized 179 243 1,492Unsecured 133,721 92,015 1,114,342Total 231,796 209,926 1,931,634Less current portion (75,830) (42,076) (631,917)¥155,966 ¥167,850 $1,299,717The interest rates on unsecured bonds and unsecured convertiblebonds were fixed. The interest rates of the long-term loans from banksand insurance companies were principally fixed and the weighted averagerates at March 31, 2003 and 2002 were 1.6% and 1.7%, respectively.<strong>Annual</strong> maturities of long-term debt at March 31, 2003 are as follows:Thousands ofYears ending March 31, Millions of Yen U.S. Dollars2004 ¥ 75,830 $ 631,9172005 36,639 305,3252006 55,776 464,8002007 22,308 185,9002008 21,447 178,7252009 and thereafter 19,796 164,967Total ¥231,796 $1,931,63432
At March 31, 2003, property, plant, and equipment with net book value of¥133 million ($1,108 thousand) were pledged as collateral on long-term debtof ¥179 million ($1,492 thousand), including current portion of ¥179 million($1,492 thousand).The conversion price of the unsecured yen convertible bonds is ¥769 pershare, which exceeded the fair value of the stock on the debt issuance date,and the number of shares into which outstanding bonds were convertibleat March 31, 2003 totaled 88,291 thousand shares.As is customary in Japan, the Company maintains deposit balances withbanks and other financial institutions with which the Company has short- orlong-term borrowing arrangements. Such deposit balances are not legallyor contractually restricted as to withdrawal.Certain of the loan agreements provide that the lender or trustees for lendersmay request the Company to submit for approval proposals to pay dividends.Certain of the loan agreements also provide that the lender may request theCompany to provide additional collateral. As is customary in Japan, collateralmust be pledged if requested by a lending bank, and banks have the right tooffset cash deposited with them against any long- or short-term debt orobligation that becomes due and, in case of default and certain other specifiedevents, against all debt payable to the banks. The Company has never receivedany such requests.6. RETIREMENT AND PENSION PLANSThe parent company and its domestic subsidiaries have a number of unfundedseverance indemnity plans and defined benefit pension plans covering substantiallyall Japanese employees. Most employees of overseas subsidiaries arecovered by defined benefit pension plans or defined contribution pension plans.Among them, the parent company has an unfunded severance indemnityplan partly supplemented by a noncontributory defined benefit pension planwhich covers substantially all of its employees (the “Noncontributory Plan”).Employees who terminate their employment at the mandatory retirement agereceive benefits in the form of annuity payments and/or lump-sum paymentswhich are principally provided by the Noncontributory Plan and the remainingportion is provided by the unfunded severance indemnity plan. The coverageof the Noncontributory Plan is approximately 80%. Employees who terminatetheir employment before the mandatory retirement age receive lump-sumpayments from the unfunded severance indemnity plan. The pension and theseverance payment are determined based on the rate of pay at the time oftermination, length of service, and certain other factors. The parent company’sfunding policy with respect to the Noncontributory Plan is generally to contributeamounts considered deductible under applicable income tax regulations. Planassets are managed principally by insurance companies and are investedprimarily in fixed income and equity securities of Japanese and foreign issuers.The parent company also has a contributory defined benefit pension plancovering all of its employees (the “Contributory Plan”), which provides lifetimeannuity payments commencing at mandatory retirement age. The ContributoryPlan consists of a substitutional portion based on the pay-related part of theold-age pension benefits prescribed by the Japanese Welfare PensionInsurance Law and a corporate portion based on a contributory defined benefitpension arrangement established at the discretion of the management. Benefitsare determined based on the average pay for the periods of service and a factordetermined by the date of birth and length of service for the substitutional portion,and on the rate of pay at the time of termination, the length of service,and reason for retirement for the corporate portion. <strong>Annual</strong> contributions aremade by the parent company and employees in accordance with the contributionformula stipulated by the government for the substitutional portion and withan amount determined on the basis of an accepted actuarial method for thecorporate portion. The Contributory Plan is administered by a board of trusteescomposed of management and employee representatives. Plan assets, whichare managed by trust banks, are invested primarily in corporate and governmentbonds and stocks.During the year ended March 31, 2001, the Company established the EmployeeRetirement Benefit Trust (the “Trust”). The purpose of the Trust is to hold andadminister certain securities contributed to the Contributory Plan. Additionally,during the year ended March 31, 2001, the Company contributed marketableequity securities valued at ¥33,116 million to the Trust.In June 2001, the Japanese government issued a new law that regulatesretirement benefit plans. Under the new law, effective April 1, 2002, theCompany can transfer the obligation for the substitutional portion and relatedplan assets to the government subject to approval by the government.In December 2002, the Company made applications for an exemption fromthe obligation to pay benefits for future employee service related to the substitutionalportion and received approval from the Japanese Ministry of Health,Labour and Welfare on January 30, 2003. EITF No. 03-2, “Accounting for theTransfer to the Japanese Government of the Substitutional Portion of EmployeePension Fund Liabilities,” requires employers to account for the entire separationprocess of a substitutional portion from an entire plan (including the corporateportion) upon completion of the transfer to the government of thesubstitutional portion of the benefit obligation and related plan assets as theculmination of a series of steps in a single settlement transaction. The differencebetween the fair value of the obligation and the assets required to betransferred to the government should be accounted for and separately disclosedas a subsidy. The Company plans to submit another application for the transferof the substitutional portion related to past services to the Japanese government.After the applications are approved by the government, the remainingbenefit obligation of the substitutional portion as well as the related government-specifiedportion of the plan assets of the Contributory Plan will be transferredto the government. The effect of the transfer on the Company’sconsolidated financial statements has not yet been determined.33
Net periodic benefit cost for the Noncontributory Plan and the Contributory Planof the parent company and for the unfunded severance indemnity plans andnoncontributory defined benefit pension plans of certain subsidiaries for theyears ended March 31, 2003, 2002, and 2001 consisted of the following components:Thousands ofMillions of YenU.S. Dollars2003 2002 2001 2003Service cost ¥10,128 ¥10,884 ¥13,970 $ 84,400Interest cost 9,600 9,719 10,563 80,000Expected return on plan assets (5,862) (6,099) (6,817) (48,850)Amortization of transition obligation 1,615 1,615 1,615 13,458Amortization of prior service cost (benefit) (797) 594 981 (6,642)Recognized actuarial loss 5,591 590 210 46,592Actuarial periodic benefit cost 20,275 17,303 20,522 168,958Employee contributions (1,005) (1,260) (1,288) (8,375)Net periodic benefit cost ¥19,270 ¥16,043 ¥19,234 $160,583The above net periodic benefit cost excludes the cumulative effect of ¥46,716 million of an accounting change in 2001, described below.34
Reconciliations of beginning and ending balances of the benefit obligations and the fair value of the plan assets, together with actuarial assumptions and aggregateinformation for accumulated benefit obligations in excess of plan assets, are as follows:Thousands ofMillions of YenU.S. Dollars2003 2002 2003Change in benefit obligations:Benefit obligations at beginning of year ¥ 331,827 ¥ 336,359 $ 2,765,225Service cost, less employee contributions 9,123 9,624 76,025Interest cost 9,600 9,719 80,000Employee contributions 1,005 1,260 8,375Amendments 3,164 (5,454) 26,367Actuarial loss (gain) 23,915 (2,216) 199,292Benefits paid (settlement) (13,154) (6,818) (109,617)Benefits paid (other) (12,126) (10,834) (101,050)Foreign currency exchange rate changes (216) 187 (1,800)Benefit obligations at end of year ¥ 353,138 ¥ 331,827 $ 2,942,817Change in plan assets:Fair value of plan assets at beginning of year ¥ 188,749 ¥ 207,519 $ 1,572,908Actual return on plan assets (31,587) (18,258) (263,225)Employer contributions 12,792 11,728 106,600Employee contributions 1,005 1,260 8,375Benefits paid (settlement) (2,669) (2,839) (22,242)Benefits paid (other) (12,126) (10,834) (101,050)Foreign currency exchange rate changes (175) 173 (1,458)Fair value of plan assets at end of year ¥ 155,989 ¥ 188,749 $ 1,299,908Plans’ funded status at end of year:Funded status ¥(197,149) ¥(143,078) $(1,642,909)Unrecognized actuarial loss 121,036 65,263 1,008,634Unrecognized prior service benefit (5,580) (9,541) (46,500)Unrecognized net obligation at the date of initial application of SFAS No. 87* 1,124 2,739 9,367Net amount recognized ¥ (80,569) ¥ (84,617) $ (671,408)Amounts recognized in the consolidated balance sheets:Accrued retirement and pension costs ¥(159,805) ¥(106,206) $(1,331,708)Prepaid expenses for benefit plans, included in other assets 497 433 4,142Intangible assets, included in other assets 7,951 2,757 66,258Accumulated other comprehensive income 70,788 18,399 589,900Net amount recognized ¥ (80,569) ¥ (84,617) $ (671,408)Actuarial assumptions:Discount rate 2.5% 3.0%Expected return on plan assets 3.5% 3.5%Rate of compensation increase 6.5% 6.5%Retirement and pension plans with accumulated benefit obligationsin excess of plan assets:Projected benefit obligations ¥ 352,018 ¥ 330,675 $ 2,933,483Accumulated benefit obligations 317,294 296,163 2,644,117Fair value of plan assets 154,768 187,464 1,289,733* SFAS No. 87, “Employers’ Accounting for Pensions”35
The unrecognized net obligation at the date of initial application and the priorservice costs (benefits) due to amendments of the benefit plans are beingamortized over approximately 14 years.Prior to April 1, 2000, the Company amortized unrecognized actuarial gainsand losses in excess of 10% of the larger of the benefit obligations or plan assetsover the average plan participants’ remaining service period. From April 1, 2000,the Company changed its method of accounting to immediately recognize actuarialgains and losses in excess of 20% of the larger of the benefit obligationsor plan assets, and amortize actuarial gains and losses between 10% and20% percent over the average participants’ remaining service period (approximately15 years). The Company believes that this accelerated recognition ofthe unrecognized gains or losses more appropriately records the pension liabilityat an amount closer to its economic liability.As a result of the change, net income for the year ended March 31, 2001,decreased by ¥19,610 million, including a charge for the cumulative effect onprior years of ¥21,559 million, net of tax benefit of ¥25,157 million. Basic netincome per 5 common shares and diluted net income per 5 common sharesdecreased by ¥70 and ¥63, respectively.7. SHAREHOLDERS’ EQUITYJapanese companies are subject to the Japanese Commercial Code (the“Code”) to which certain amendments became effective October 1, 2001.Effective October 1, 2001,The Code requires at least 50% of the issue price of new shares to be designatedas stated capital as determined by resolution of the Board of Directors.Proceeds in excess of amounts designated as stated capital, as reduced bystock issue expenses less the applicable tax benefit, are credited to additionalpaid-in capital. Under the Code, shares are recorded with no par value.Under the Code, companies may issue new common shares to existingshareholders without consideration as a stock split pursuant to a resolutionof the Board of Directors.The Code permits companies to transfer a portion of additional paid-incapital and legal reserve to stated capital by resolution of the Board ofDirectors. The Code also permits companies to transfer a portion of unappropriatedretained earnings, available for dividends, to stated capital byresolution of the shareholders.The Code allows for an appropriation of retained earnings applicable toeach fiscal period to be set aside as a legal reserve until the total additionalpaid-in capital and legal reserve equals 25% of stated capital. The amountof total additional paid-in capital and legal reserve which exceeds 25% ofstated capital can be transferred to retained earnings by resolution of theshareholders, which may be available for dividends.Dividends are approved by the shareholders at a meeting held subsequentto the fiscal year to which the dividends are applicable. Semiannualinterim dividends may also be paid upon resolution of the Board ofDirectors, subject to certain limitations imposed by the Code.Under the Code, the amount available for dividends is based on retainedearnings, less treasury stock, as recorded on the books of the parent company.Certain adjustments, not recorded on the parent company’s books, are reflectedin the consolidated financial statements as described in Note 1. At March31, 2003, retained earnings, less treasury stock, recorded on the parent company’sbooks of account were ¥152,913 million ($1,274,275 thousand).The Code allows companies to repurchase treasury stock by a resolutionof the shareholders at the general shareholders’ meeting and dispose of suchtreasury stock by resolution of the Board of Directors after March 31, 2002.The repurchased amount of treasury stock cannot exceed the amount availablefor future dividends plus the amount of stated capital, additional paid-in capital,or legal reserve to be reduced in the case where such reduction was resolvedat the general shareholders’ meeting.In addition, pursuant to a resolution of the Board of Directors, the parentcompany may purchase its own shares for their retirement, up to 50 millionshares or ¥20,000 million ($166,667 thousand), commencing after the generalshareholders’ meeting on June 26, 2002 through the general shareholders’meeting in June 2003, and also could purchase up to 140 million shares inaccordance with its article of incorporation until the general shareholders’meeting on June 26, 2002. Any shares of common stock, in whole or in part,are subject to such purchases made for the purpose of retirement. Approximately45 million shares and 19 million shares amounting to ¥14,875 million($123,958 thousand) and ¥6,641 million were purchased under the aboveresolution during the years ended March 31, 2003 and 2002, respectively.Prior to October 1, 2001,The Code required at least 50% of the issue price of new shares, with a minimumof the par value thereof, to be designated as stated capital. Under theCode, the amount calculated by dividing the total amount of shareholders’equity by the number of outstanding shares after the stock split could notbe less than ¥50. The Code also provided that an amount at least equal to10% of the aggregate amount of cash dividends and certain other cash paymentswhich were made as an appropriation of retained earnings applicableto each fiscal period shall be appropriated and set aside as a legal reserveuntil such reserve equals 25% of stated capital. In addition, the Codeimposed certain restrictions on the repurchase and use of treasury stock.36
8. OTHER INCOME (EXPENSES), NETOther—net as shown in other income (expenses) for the years ended March 31, 2003, 2002, and 2001 consisted of the following:Thousands ofMillions of YenU.S. Dollars2003 2002 2001 2003Gain (loss) on sales of securities—net ¥ (5) ¥2,578 ¥ 821 $ (42)Foreign exchange gain (loss)—net (2,482) 561 (2,368) (20,683)Other—net 1,048 (523) 885 8,733¥(1,439) ¥2,616 ¥ (662) $(11,992)9. INCOME TAXESThe approximate effects of temporary differences and tax loss and credit carryforwards that gave rise to deferred tax balances at March 31, 2003 and 2002were as follows:Millions of YenThousands of U.S. Dollars2003 2002 2003Deferred Deferred Deferred Deferred Deferred DeferredTax Tax Tax Tax Tax TaxAssets Liabilities Assets Liabilities Assets LiabilitiesAllowance for doubtful receivables ¥ 2,960 ¥ 61 ¥ 3,302 ¥ 266 $ 24,667 $ 508Intercompany profits 11,497 — 12,312 — 95,808 —Adjustments of investment securities 15,051 8,508 6,020 17,229 125,425 70,900Write-downs of inventories and fixed assets 13,494 — 8,165 — 112,450 —Enterprise tax 832 — 1,021 — 6,933 —Accrued bonus 5,448 — 4,495 — 45,400 —Retirement and pension costs 64,032 — 44,198 — 533,600 —Unremitted earnings of foreign subsidiaries and affiliates — 2,748 — 3,106 — 22,900Other temporary differences 11,673 3,252 9,982 3,264 97,275 27,100Tax loss and credit carryforwards 8,276 — 8,592 — 68,967 —Subtotal 133,263 14,569 98,087 23,865 1,110,525 121,408Less valuation allowance 20,759 — 15,878 — 172,992 —¥112,504 ¥14,569 ¥82,209 ¥23,865 $ 937,533 $121,408Net deferred tax balances at March 31, 2003 and 2002 were reflected in the accompanying consolidated balance sheets under the following captions:Millions of YenThousands ofU.S. Dollars2003 2002 2003Other current assets ¥23,781 ¥21,517 $198,175Other assets 74,451 37,382 620,425Other long-term liabilities (297) (555) (2,475)Net deferred tax assets ¥97,935 ¥58,344 $816,12537
During the year ended March 31, 2003, the normal statutory tax rate used in thecalculation of deferred tax assets and deferred tax liabilities was decreased from42.0% to 40.6% effective April 1, 2004.The provision for income taxes for the year ended March 31, 2003 includes a¥1,789 million ($14,908 thousand) adjustment to record the impact on deferred taxassets and liabilities for the change in the enacted tax rate.At March 31, 2003, a valuation allowance of ¥20,759 million ($172,992 thousand)was recorded against the deferred tax assets for items which may not berealized. The net changes in the valuation allowance for the years ended March31, 2003, 2002, and 2001 were an increase of ¥4,881 million ($40,675 thousand),an increase of ¥3,424 million, and an increase of ¥2,268 million,respectively. Such changes were due primarily to the realization or nonrealizationof tax benefits regarding operating losses of subsidiaries.Based upon the level of historical taxable income and projections for futuretaxable income over the periods which the net deductible temporary differencesare expected to reverse and/or the tax losses and credits are carried forward,management believes it is more likely than not that the Company will realizethe benefits of these deferred tax assets, net of the existing valuationallowances at March 31, 2003.At March 31, 2003, the tax loss carryforwards in the aggregate amounted toapproximately ¥20,000 million ($166,667 thousand), which are available tooffset future taxable income, and will expire substantially in the period from2004 through 2008.The effective income tax rates of the Company for each of the three years in the period ended March 31, 2003 differed from the normal Japanese statutory taxrates as follows:2003 2002 2001Normal Japanese statutory tax rates 42.0% 42.0% 42.0%Increase (decrease) in taxes resulting from:Increase in valuation allowance 108.8 11.9 3.7Permanently nondeductible expenses 14.0 2.7 1.1Nontaxable dividend income (3.0) (2.0) (1.1)Inhabitant tax per capita 3.0 0.6 0.3Change in tax rate 29.1 — —Provisions for taxes on unremitted earnings of foreign subsidiaries — 5.1 —Other—net 5.8 0.1 0.4Effective income tax rates 199.7% 60.4% 46.4%Provisions have been recorded for unremitted earnings of all foreign subsidiariesand affiliates of which earnings are not deemed to be permanentlyreinvested. Substantially all of the undistributed earnings of domesticsubsidiaries and affiliates would not, under present Japanese tax law, besubject to tax through tax-free distributions.10. NET INCOME PER 5 COMMON SHARESA reconciliation of the numerators and denominators of the basic and diluted net income per 5 common shares computation for the years ended March 31, 2003,2002, and 2001 is as follows:Thousands ofMillions of YenU.S. Dollars2003 2002 2001 2003Income (loss) before cumulative effect of an accounting change ¥(8,004) ¥9,530 ¥31,354 $(66,700)Effect of dilutive convertible bonds — 428 770 —Diluted income (loss) before cumulative effect of an accounting change ¥(8,004) ¥9,958 ¥32,124 $(66,700)Number of Shares (Thousands)Weighted average common shares outstanding 1,370,382 1,405,564 1,409,758Effect of dilutive convertible bonds — 88,291 137,278Diluted common shares outstanding 1,370,382 1,493,855 1,547,03638
11. OTHER COMPREHENSIVE INCOME (LOSS)Each component of other comprehensive income (loss), including reclassification adjustments and tax effects for the years ended March 31, 2003, 2002, and 2001,was as follows:Millions of YenThousands of U.S. Dollars2003 2003Before-Tax Net-of-Tax Before-Tax Net-of-TaxAmount Tax Benefit Amount Amount Tax Benefit AmountForeign currency translation adjustments:Foreign currency translation adjustments arising during period ¥ (6,482) ¥ 316 ¥ (6,166) $ (54,016) $ 2,633 $ (51,383)Reclassification adjustment for gains realized in net income (200) — (200) (1,667) — (1,667)(6,682) 316 (6,366) (55,683) 2,633 (53,050)Unrealized losses on securities:Unrealized losses on securities arising during period (44,827) 18,825 (26,002) (373,558) 156,875 (216,683)Reclassification adjustment for losses realized in net income 24,827 (10,427) 14,400 206,892 (86,892) 120,000(20,000) 8,398 (11,602) (166,666) 69,983 (96,683)Minimum pension liability adjustment (52,389) 22,003 (30,386) (436,575) 183,358 (253,217)Unrealized gains on derivatives:Unrealized gains on derivatives arising during period 1,043 (442) 601 8,691 (3,683) 5,008Reclassification adjustments for gains realized in net income (811) 341 (470) (6,758) 2,842 (3,916)232 (101) 131 1,933 (841) 1,092Other comprehensive loss ¥(78,839) ¥30,616 ¥(48,223) $(656,991) $255,133 $(401,858)Millions of Yen2002Before-TaxNet-of-TaxAmount Tax Benefit AmountForeign currency translation adjustments:Foreign currency translation adjustments arising during period ¥ 9,571 ¥ (492) ¥ 9,079Reclassification adjustment for losses realized in net income 15 — 159,586 (492) 9,094Unrealized losses on securities:Unrealized losses on securities arising during period (62,084) 26,076 (36,008)Reclassification adjustment for losses realized in net income 6,588 (2,767) 3,821(55,496) 23,309 (32,187)Minimum pension liability adjustment (18,399) 7,728 (10,671)Unrealized losses on derivatives:Unrealized losses on derivatives arising during period (2,673) 1,122 (1,551)Reclassification adjustments for losses realized in net income 2,001 (840) 1,161(672) 282 (390)Other comprehensive loss ¥(64,981) ¥30,827 ¥(34,154)39
Millions of Yen2001Before-TaxNet-of-TaxAmount Tax Benefit AmountForeign currency translation adjustments:Foreign currency translation adjustments arising during period ¥ 5,686 ¥ 13 ¥ 5,699Reclassification adjustment for gains realized in net income (42) — (42)5,644 13 5,657Unrealized losses on securities:Unrealized losses on securities arising during period (49,321) 20,715 (28,606)Reclassification adjustment for gains realized in net income (17,176) 7,214 (9,962)(66,497) 27,929 (38,568)Minimum pension liability adjustment 38,522 (21,715) 16,807Other comprehensive loss ¥(22,331) ¥ 6,227 ¥(16,104)The balances of each classification within accumulated other comprehensive income were as follows:Millions of YenMinimum Unrealized AccumulatedCumulative Unrealized Pension Gains OtherTranslation Gains (Losses) Liability (Losses) on ComprehensiveAdjustments on Securities Adjustment Derivatives Income (Loss)Balance, April 1, 2002 ¥ 2,456 ¥ 8,733 ¥(10,671) ¥(390) ¥ 128Current—period change (6,366) (11,602) (30,386) 131 (48,223)Balance, March 31, 2003 ¥(3,910) ¥ (2,869) ¥(41,057) ¥(259) ¥(48,095)Thousands of U.S. DollarsMinimum Unrealized AccumulatedCumulative Unrealized Pension Gains OtherTranslation Gains (Losses) Liability (Losses) on ComprehensiveAdjustments on Securities Adjustment Derivatives Income (Loss)Balance, April 1, 2002 $ 20,466 $ 72,775 $ (88,925) $(3,250) $ 1,066Current—period change (53,050) (96,683) (253,217) 1,092 (401,858)Balance, March 31, 2003 $(32,584) $(23,908) $(342,142) $(2,158) $(400,792)12. FINANCIAL INSTRUMENTSIn the normal course of business, the Company invests in various financialassets and incurs various financial liabilities. The Company also enters intoagreements involving derivative instruments to manage its exposure to fluctuationsin foreign exchange and interest rates.Market Risk ManagementMarket Risk ExposuresThe Company is subject to market rate risks due to fluctuation of foreign currencyexchange rates, interest rates, and equity prices. Among these risks, theCompany manages foreign currency exchange and interest rate risks by usingderivative financial instruments in accordance with established policies and procedures.The Company does not use derivative financial instruments for tradingpurposes. The credit risks associated with these instruments are not consideredto be significant since the counterparties are reliable major internationalfinancial institutions and the Company does not anticipate any such losses. Thenet cash requirements arising from the previously mentioned risk managementactivities are not expected to be material.Foreign Currency Exchange RisksThe Company’s foreign currency exposure relates primarily to its foreign currencydenominated assets in its international operations and long-term debtdenominated in foreign currencies. The Company entered into foreignexchange forward contracts and currency swaps designated to mitigate itsexposure to foreign currency exchange risks.The following table provides information regarding the Company’s derivativefinancial instruments related to foreign currency exchange transactionsas of March 31, 2003, which was translated into Japanese yen at the yearendcurrency exchange rate.40
Foreign Exchange Forward Contracts and Currency SwapsMillions of YenThousands ofU.S. DollarsMaturities, Years Ending March 31 2004 2005 2004 2005Sell U.S. Dollar, buy Yen Receive ¥25,143 ¥— $209,525 $—Pay 25,200 — 210,000 —Sell Euro, buy Yen Receive 6,968 — 58,066 —Pay 7,150 — 59,584 —Sell Sterling Pound, buy Euro Receive 240 — 2,000 —Pay 230 — 1,917 —Sell Yen, buy U.S. Dollar Receive 782 13 6,517 108Pay 774 14 6,450 117Interest Rate RisksThe Company is exposed to interest rate risks mainly inherent in its debt obligationswith both fixed and variable rates. Debt obligations that are sensitiveto interest rate changes are disclosed in Note 5. In order to hedgethese risks, the Company uses interest rate swap contracts to change thecharacteristics of its fixed and variable rate exposures.The following table provides information, by maturity date, about theCompany’s interest rate swap contracts. The table represents notional principalamounts and weighted average interest rates by expected maturity dates.Notional principal amounts are used to calculate the contractual payments tobe exchanged under the contracts as of March 31, 2003, which are translatedinto Japanese yen at the year-end currency exchange rate.Interest Rate Swap ContractsWeighted Average RateNotional AmountThousands ofMaturities, Years Ending March 31, Receive Pay Millions of Yen U.S. Dollars2004 0.88% 2.03% ¥18,284 $152,3672005 0.77 1.78 15,844 132,0332006 0.56 1.44 9,564 79,7002007 0.30 0.74 5,500 45,8332008 0.24 0.73 2,000 16,667Cash Flow HedgesChanges in the fair value of foreign exchange contracts and interest rateswap agreements designated and qualifying as cash flow hedges are reportedin other comprehensive income (loss). These amounts are subsequentlyreclassified into earnings through other income (expense) in the same periodas the hedged items affect earnings. For most forward exchange contracts,the amounts are reclassified when products related to hedgedtransactions are sold from overseas subsidiaries to customers. In the case ofinterest rate swaps, the amounts are reclassified when the related interestexpense is recognized. Substantially all of the net losses on derivativesincluded in accumulated other comprehensive loss at March 31, 2003 willbe reclassified into earnings within the next 12 months.Equity Price RisksThe Company’s short-term and other investments are exposed to changes inequity price risks and consist entirely of available-for-sale securities. Fair valueand other information for such equity securities is disclosed in Note 4.Fair Value of Financial InstrumentsThe Company had the following financial instruments at March 31, 2003 and 2002:Millions of YenThousands of U.S. Dollars2003 2002 2003Carrying Value Fair Value Carrying Value Fair Value Carrying Value Fair ValueFinancial assets:Finance receivables ¥ 89,280 ¥ 87,408 ¥ 88,002 ¥ 88,051 $ 744,000 $ 728,400Other investments 79,959 79,959 128,876 128,876 666,325 666,325Financial liabilities:Long-term debt (231,796) (233,449) (209,926) (211,602) (1,931,634) (1,945,408)Derivative financial instruments recorded as liabilities:Foreign exchange instruments (145) (145) (374) (374) (1,208) (1,208)Interest rate swaps and other instruments (283) (283) (313) (313) (2,358) (2,358)41
The fair values of finance receivables, other investments, and long-termdebt are based on quoted market prices when available or discounted cashflows using the current interest rate on similar financing investments or borrowings.The fair value estimates of the financial instruments are not necessarilyindicative of the amounts the Company might pay or receive from actualmarket transactions.The carrying amounts of cash and cash equivalents, short-term investments,notes and accounts receivable and payable, and short-term borrowings approximatethe fair value because of the short maturity of those instruments.Concentration of Credit RisksA certain level of group concentrations of the Company’s business activitiesis found in the domestic farm equipment sales through the National Federationof Agricultural Cooperative Associations and affiliated dealers. The concentratedcredit risk of the domestic farm equipment business consists principally of notesand accounts receivable and financial guarantees, for which the Company historicallyhas not experienced any significant uncollectibility. Additionally,transactions associated with country risk are limited.13. SUPPLEMENTAL EXPENSE INFORMATIONAmounts of certain costs and expenses for the years ended March 31, 2003, 2002, and 2001 were as follows:Millions of YenThousands ofU.S. Dollars2003 2002 2001 2003Research and development expenses ¥26,405 ¥30,186 ¥30,257 $220,042Advertising costs 9,534 10,464 9,608 79,450Shipping and handling costs 37,725 36,858 37,668 314,375Loss from disposal and impairment of business and fixed assets for theyear ended March 31, 2003 includes a loss of ¥16,792 million ($139,933thousand) resulting from the impairment of long-lived assets, primarily theland and buildings of a golf course held and operated by the Company witha fair value of ¥730 million ($6,083 thousand). As a result of the significantdeterioration of the golf business, the Company evaluated the recoverabilityof related assets and recognized an impairment loss. The fair value of thegolf course was determined by the expected cash flow approach.Loss from disposal and impairment of businesses and fixed assets for theyear ended March 31, 2002 includes a loss of ¥4,734 million resulting fromwrite-down of long-lived assets to be disposed of, primarily land and rentalproperty with a fair value of ¥2,120 million. Also included is a loss of¥6,332 million mainly resulting from the disposal of the prefabricated housingbusiness, and mergers and integration of farm machinery distributors, inconnection with the Company’s efforts to streamline operations. Certain ofthese actions have already been completed and others are expected to becompleted within the next 12 months.14. COMMITMENTS AND CONTINGENCIESCommitments for capital expenditures outstanding at March 31, 2003 approximated¥1,259 million ($10,492 thousand).The Company leases certain offices and other facilities under lease agreements,all of which are substantially cancelable at the Company’s option.Rental expenses for the years ended March 31, 2003, 2002, and 2001amounted to ¥8,182 million ($68,183 thousand), ¥9,220 million, and ¥9,472million, respectively.The Company adopted FASB Interpretation No. 45 (“FIN 45”), “Guarantor’sAccounting and Disclosure Requirements for Guarantees, Including IndirectGuarantees of Indebtedness of Other.” FIN 45 requires that a guarantor berequired to recognize a liability at the inception of a guarantee. FIN 45 alsorequires disclosure about the guarantees that the entity has issued.The Company issues contractual product warranties under which it generallyguarantees the performance of products delivered and services rendered for acertain period or term.The Company determines its reserve for product warranties based on ananalysis of the historical data of costs to perform under product warranties.The change in the accrued product warranty cost for the year ended March 31, 2003 was as follows:Millions of YenThousands ofU.S. DollarsBalance, April 1, 2002 ¥1,672 $13,933Addition 2,786 23,217Utilization (2,676) (22,300)Other (34) (283)Balance, March 31, 2003 ¥1,748 $14,567Balances were included in other current liabilities in the consolidated balance sheets.42
At March 31, 2003, the Company was contingently liable for trade noteswith maturities of principally one to three months discounted with banks in theamount of ¥3,036 million ($25,300 thousand), which are accounted for assales when discounted. The banks retain a right of recourse against theCompany in the event of nonpayment by customers, for which the Company’smanagement believes that the recourse is remote from exercise.The Company is contingently liable as guarantor of the indebtedness ofdistributors, including affiliated companies, and customers for their borrowingsfrom financial institutions.The Company is also contingently liable as guarantor of the housing loansof employees. The Company would have to perform under these guarantees inthe events of default on a payment within the guarantee periods of 1 year to 10years for distributors and customers and of 1 year to 20 years for employeeswith housing loans.Maximum potential amounts of undiscounted future payments of these financial guarantees as of March 31, 2003 were as follows:Millions of YenThousands ofU.S. DollarsBorrowings of distributors and customers ¥3,074 $25,617Housing loans of employees 2,848 23,733Total ¥5,922 $49,350The Company recognized liabilities for the guarantees for borrowings of distributorsand customers in the amount of ¥358 million ($2,983 thousand) as ofMarch 31, 2003. The liabilities for other financial guarantees, including tradenotes discounted with banks, which were issued after December 31, 2002,were not material.In the fiscal year ended March 31, 1999, the Fair Trade Commission ofJapan (the “FTCJ”) began an investigation of the Company for an allegedviolation of the Anti-Monopoly Law (prohibition of private monopoly or unfairtrade restraint) relating to participation in fixing the shares of ductile iron straightpipe orders in Japan. In March 1999, the Company received a cease anddesist recommendation from the FTCJ, which was accepted by the Companyin April 1999.In connection with this investigation, on December 24, 1999, the Companyreceived a surcharge order of ¥7,072 million from the FTCJ. The Company haschallenged this order and filed a petition for the initiation of hearing proceduresthat were started in March 2000 and continued through the year ended March31, 2003. Under Section 49 of the Anti-Monopoly Law, upon the initiation ofthe procedures, the surcharge order lost effect. In addition, Section 7-2 of thelaw stipulates that surcharges are imposed in cases where price cartels or cartelsthat influence prices by curtailing the volume of supply are carried out. TheCompany believes that the alleged share cartel does not meet the requirementof Section 7-2 and has not established any provision for the ultimate liability, ifany, which may result from the settlement of this matter. An unfavorable outcomefrom this issue could materially affect the Company’s results of operationsor cash flows in a given year. The Company is not able to estimate thelikelihood of such an unfavorable outcome.15. SUBSEQUENT EVENTOn May 22, 2003, the Company’s Board of Directors resolved the payment of acash dividend to shareholders of record on March 31, 2003 of ¥3 per commonshare (¥15 per 5 common shares) or a total of ¥4,038 million ($33,650thousand). The Company’s Board of Directors also resolved the purchase ofup to 50,000,000 shares, or up to ¥20,000 million ($166,667 thousand), ofthe parent company’s common stock on the open market, commencing afterthe general shareholders’ meeting through the next general shareholders’meeting. Both authorizations are subject to shareholders’ approval at thegeneral meeting to be held on June 26, 2003.43
Independent Auditors’ <strong>Report</strong>To the Board of Directors and Shareholders of Kubota Corporation:We have audited the accompanying consolidated balance sheets of Kubota Corporation and subsidiaries as of March 31, 2003 and 2002, and the relatedconsolidated statements of income, comprehensive income (loss), shareholders’ equity, and cash flows for each of the three years in the period endedMarch 31, 2003, all expressed in Japanese yen. These financial statements are the responsibility of the Company’s management. Our responsibility is toexpress an opinion on these financial statements based on our audits.We conducted our audits in accordance with auditing standards generally accepted in the United States of America. Those standards require that we planand perform the audit to obtain reasonable assurance about whether the financial statements are free of material misstatement. An audit includes examining,on a test basis, evidence supporting the amounts and disclosures in the financial statements. An audit also includes assessing the accounting principlesused and significant estimates made by management, as well as evaluating the overall financial statement presentation. We believe that our auditsprovide a reasonable basis for our opinion.Certain information required by Statement of Financial Accounting Standards (“SFAS”) No. 131, “Disclosures about Segments of an Enterprise and RelatedInformation” has not been presented in the accompanying consolidated financial statements. In our opinion, presentation concerning operating segmentsand other information is required for a complete presentation of the Company’s consolidated financial statements.The Company has not accounted for a nonmonetary security exchange transaction, that occurred during the year ended March 31, 1997, in accordancewith accounting principles generally accepted in the United States of America. In our opinion, the recognition of the nonmonetary exchange gain, and therelated impact in subsequent periods, is required by accounting principles generally accepted in the United States of America. The Company has disclosedthe effects of the departure and other relevant information in Note 1 to the consolidated financial statements.In our opinion, except for the omission of segment and other information required by SFAS No. 131 and the effect of not properly recording a nonmonetarysecurity exchange transaction, as discussed in the preceding paragraphs, such consolidated financial statements present fairly, in all material respects,the financial position of Kubota Corporation and subsidiaries as of March 31, 2003 and 2002, and the results of their operations and their cash flows foreach of the three years in the period ended March 31, 2003 in conformity with accounting principles generally accepted in the United States of America.As discussed in Note 6 to the consolidated financial statements, the Company changed its method of amortizing unrecognized actuarial gains and lossesrelated to accounting for retirement and pension costs effective April 1, 2000.Our audits also comprehended the translation of Japanese yen amounts into U.S. dollar amounts and, in our opinion, such translation has been made inconformity with the basis stated in Note 1. Such U.S. dollar amounts are presented solely for the convenience of readers outside Japan.Osaka, JapanJune 2, 200344
DirectoryKUBOTA CORPORATIONHead Office2-47, Shikitsuhigashi 1-chome,Naniwa-ku, Osaka 556-8601, JapanPhone: (81)-6-6648-2111Facsimile: (81)-6-6648-3862Tokyo Office1-3, Nihonbashi-Muromachi 3-chome,Chuo-ku, Tokyo 103-8310, JapanPhone: (81)-3-3245-3111Facsimile: (81)-3-3245-3049OVERSEAS OFFICESBeijing OfficeRoom 1551,New Century Office Tower,No. 6 Southern Road,Capital Gym., Beijing 100044,People’s Republic of ChinaPhone: (86)-10-6849-2277Facsimile: (86)-10-6849-2280Telex: 22990 MZHTL CNOVERSEAS SUBSIDIARIESAND AFFILIATESNORTH AMERICAKubota Tractor Corporation3401 Del Amo Blvd.,Torrance, California 90503, U.S.A.Phone: (1)-310-370-3370Facsimile: (1)-310-370-2370URL: http://www.kubota.comKubota Credit Corporation, U.S.A.3401 Del Amo Blvd.,Torrance, California 90503, U.S.A.Phone: (1)-310-370-3370Facsimile: (1)-310-370-2370URL: http://www.kubota.com/kccusa.cfmKubota Manufacturingof America CorporationGainesville Industrial Park North,2715 Ramsey Road,Gainesville, Georgia 30501, U.S.A.Phone: (1)-770-532-0038Facsimile: (1)-770-532-9057Kubota Engine AmericaCorporation505 Schelter Road,Lincolnshire, Illinois 60069, U.S.A.Phone: (1)-847-955-2500Facsimile: (1)-847-955-2501URL: http://www.kubotaengine.com/Auburn ConsolidatedIndustries, Inc.2100 South “J” Street,(P.O. Box 350) Auburn,Nebraska 68305-0350, U.S.A.Phone: (1)-402-274-4911Facsimile: (1)-402-274-5031Kubota Finance (U.S.A.), Inc.3401 Del Amo Blvd.,Torrance, California 90503, U.S.A.Phone: (1)-310-370-3370Facsimile: (1)-310-370-2370Kubota Canada Ltd.5900 14th Avenue, Markham,Ontario L3S 4K4, CanadaPhone: (1)-905-294-7477Facsimile: (1)-905-294-6651URL: http://www.kubota.ca/Kubota Metal Corporation(Fahramet Division)25 Commerce Road, Orillia,Ontario L3V 6L6, CanadaPhone: (1)-705-325-2781Facsimile: (1)-705-325-5887URL: http://www.kubotametal.com/OCEANIAKubota Tractor AustraliaPty Ltd100 Keilor Park Drive, Tullamarine,Victoria 3043, AustraliaPhone: (61)-3-9279-2000Facsimile: (61)-3-9279-2030URL: http://www.kubota.com.au/45
EUROPEKubota Europe S.A.S.19-25, Rue Jules Vercruysse,Z.I., BP88 95101 Argenteuil,Cedex, FrancePhone: (33)-1-3426-3434Facsimile: (33)-1-3426-3499Kubota (Deutschland) GmbHSenefelder Straße 3-5,63110 Rodgau/Nieder-Roden,GermanyPhone: (49)-6106-873-0Facsimile: (49)-6106-873-198URL: http://www.kubota.de/Kubota Baumaschinen GmbHSteinhauser Straße 100,66482 Zweibrücken, Rheinlandpfalz,GermanyPhone: (49)-6332-4870Facsimile: (49)-6332-487-101Kubota Servicios España S.A.Ctra. del Barrio de la Fortuna s/nCuatro Vientos,28044 Madrid, SpainPhone: (34)-91-508-6442Facsimile: (34)-91-508-0522Kubota (U.K.) LimitedDormer Road, Thame,Oxfordshire OX9 3UN, U.K.Phone: (44)-1844-214500Facsimile: (44)-1844-261568URL: http://www.kubota.co.uk/Kubota Membrane Europe Ltd.8 Hanover Street, London W1S 1YE, U.K.Phone: (44)-(0) 20-7290-2730Facsimile: (44)-(0) 20-7290-2733ASIAShin Taiwan AgriculturalMachinery Co., Ltd.16, Fengping 2nd Road,Taliao Shiang Kaohsiung,Hsien 83107, Taiwan, R.O.C.Phone: (886)-7-702-2333Facsimile: (886)-7-702-2303Kubota Agricultural Machinery(Suzhou) Co., Ltd.No. 220, Xing Ming Street,Suzhou Industrial Park,Suzhou Municipality, Jiangsu,People’s Republic of ChinaPhone: (86)-512-6716-3122Facsimile: (86)-512-6716-3344The Siam Kubota IndustryCo., Ltd.101/19-24 Navanakorn,Tambol Klongneung, AmphurKlongluang, Pathumthani 12120,ThailandPhone: (66)-2-529-0363Facsimile: (66)-2-529-0081P.T. Kubota IndonesiaJL. Setyabudi 279,Semarang, IndonesiaPhone: (62)-24-7472849Facsimile: (62)-24-7472865P.T. Metec SemarangTanjung Emas Export ProcessingZone, JL. Coaster No. 8 Block B,12A-16 Semarang, Central Java,IndonesiaPhone: (62)-24-3520435Facsimile: (62)-24-3520432Kubota Agro-IndustrialMachinery Philippines, Inc.155 Panay Avenue,South Triangle Homes,1103 Quezon City, PhilippinesPhone: (63)-2-9201071Facsimile: (63)-2-9241848Sime Kubota Sdn. Bhd.No. 3 Jalan Sepadu,25/123 Taman Perindustrian Axis,Seksyen 25, 40400 Shah Alam,Selangor Darul Ehsan, MalaysiaPhone: (60)-3-5122-1288Facsimile: (60)-3-5124-8798Jiangsu Biaoxin KubotaIndustrial Co., Ltd.186 Lishiqiao South Avenue, Xin qiao Town,Jingjiang City, Jiangsu,People’s Republic of ChinaPhone: (86)-523-433-3999Facsimile: (86)-523-433-399946
Directorsand Corporate AuditorsInvestor InformationPresident and Representative DirectorDaisuke HatakakeExecutive Vice Presidentsand Representative DirectorsTomomi SohMikio KinoshitaExecutive Managing DirectorsTsuyoshi HayashiTadahiko KinoshitaManaging DirectorsAkio NishinoMasaru IshiguroAkira SeikeToshiyuki YotsumotoYoshihiro FujioMoriya HayashiDirectorsTadahiko UrabeMasateru YoshikawaToshihiro FukudaYasuo MasumotoJunichi MaedaYoshiharu NishiguchiEisaku ShinoharaNobuo IzawaStock ListingsDomestic: Tokyo, Osaka,and three other stock exchangesOverseas: New York and FrankfurtTransfer Agent for Common StockThe Chuo Mitsui Trustand Banking Company, Limited2-21, Kitahama 2-chome, Chuo-ku,Osaka 541-0041, JapanDepositary for ADR HoldersJPMorgan Chase Bank60 Wall Street, New York,New York 10260-0060, U.S.A.Investor InquiriesHead OfficeFinance & Accounting Dept.2-47, Shikitsuhigashi 1-chome,Naniwa-ku, Osaka 556-8601, JapanPhone: (81)-6-6648-2111Facsimile: (81)-6-6648-3862Tokyo OfficeTokyo Administration Dept.1-3, Nihonbashi-Muromachi 3-chome,Chuo-ku, Tokyo 103-8310, JapanPhone: (81)-3-3245-3111Facsimile: (81)-3-3245-3049Corporate AuditorsMasayoshi FujitaMasamichi NakahiroSusumu SumikuraTeisuke SonoFinancial information and environmental reportsare available on Kubota’s Web site:http://www.kubota.co.jp/This annual report is printed on recycled paper.47
Kubota Corporation <strong>Annual</strong> <strong>Report</strong> 2003Kubota Corporation2-47, Shikitsuhigashi 1-chome, Naniwa-ku, Osaka 556-8601, JapanPhone: (81)-6-6648-2111 Facsimile: (81)-6-6648-3862http://www.kubota.co.jp/Printed in Japan