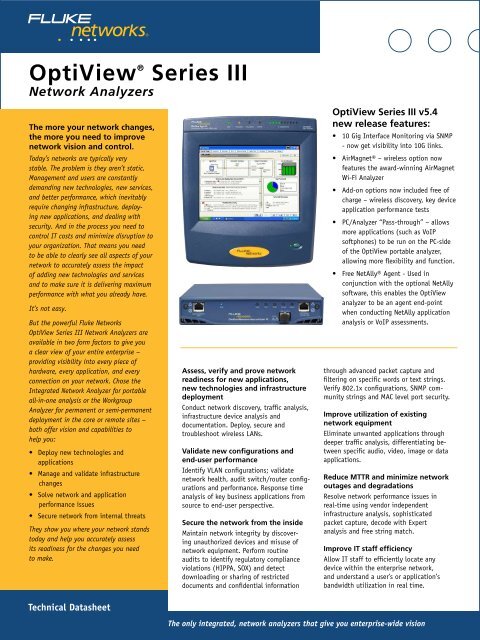
OptiView® Series III Network Analyzers - FLUKE TESTERY.CZ
OptiView® Series III Network Analyzers - FLUKE TESTERY.CZ
OptiView® Series III Network Analyzers - FLUKE TESTERY.CZ
You also want an ePaper? Increase the reach of your titles
YUMPU automatically turns print PDFs into web optimized ePapers that Google loves.
Vendor independent infrastructuredevice analysisGet visibility into switches and routers located anywhere on theenterprise network. With this information, you can optimize networkperformance, improve efficiency and reduce costs while improvingreliability and security. Easily manage and validate infrastructureconfigurations when deploying SNMPv3 with the analyzers capabilityof supporting configurable credential sets including authenticationwith and without privacy.Multi-port switch statisticsIn-depth analysis on 10/100/1000 and 10 Gig interfaces, including:• A tabular view of all switch port configurations, including theidentity of each host and where it is connected to the switchfor both layer 2 and 3.• A graphical view of utilization and error rates on each switchport to see over subscribed or errored ports at a glance.Detect over-utilization, excessive errors, and locate inactive switchports to determine if performance problems are related to link speedor duplex mis-configurations, or are related to the number of hostson a port.VLAN analysisDetermine if connectivity problems are related to VLANconfiguration by seeing information such as:• VLANs that are configured on the switch.• Interfaces that are members of each VLAN.• Identification of trunk or uplink ports, together with the trunkingprotocol in use.• Identification of which hosts are members of each VLAN.Multi-port statisticsVLAN discoveryTrace SwitchRoute Trace SwitchRoute allows you to see the exact path two devicesuse to communicate through your switch fabric. Trace SwitchRoutebegins its discovery from the specified Source Device and tracesthe path to the specified Target Device. For each switch in the path,the displayed results include the DNS name and IP address, theinter- switch connections by port number, together with linkspeed and VLAN information. Highlighting any device in the TraceSwitchRoute name column and selecting Host Detail allows you toview that device’s network configuration information.Trace SwitchRoute4
Router and WAN link analysisIn-depth device analysis identifies Router ARP cache or routingtable errors and also provides visibility to manage and troubleshootcostly WAN links. See WAN link configuration, a graphical display ofutilization and error rates and identification of specific error typeson ISDN, Frame Relay, T1/E1, T3 and ATM links.Telnet and web browser links to allow reconfiguration of devicesdirectly from the analyzer.Traffic generation and throughputAssess network readiness for new deployments by determining theimpact of the new application, or the addition of network users,by stressing your network with simulated traffic – up to 1 Gbps.Protocol type, frame size, frame rate, percentage utilization andnumber of frames to transmit are user configurable, along with thetype of traffic: Broadcast, Multicast or Unicast.Selectable protocols include: Benign Ethernet, Benign LLC 802.2,NetBEUI, Benign IP, IP ICMP Echo, IP UDP Echo, IP UDP Discard,IP UDP NFS and IP UDP NetBIOS. Selecting an IP protocol allows youto select Time to Live (TTL) parameters and TOS (QOS) parameterssuch as Minimum Delay, Maximum Throughput, Maximum Reliability,Minimum Monetary Cost and Maximum Security to ensure correctrouting configurations.The throughput test will measure bidirectional data flowbetween two Fluke <strong>Network</strong>s devices to validate LAN and WANthroughput capabilities. The throughput test requires a seconddevice to communicate with on your network. That second devicecan either be an OptiView Integrated or Workgroup Analyzer, oran EtherScope or OneTouch <strong>Network</strong> Assistant, or LinkRunnerPro Reflector.The Throughput Option allows you to configure the followingparameters:• Data speed (up to 1 G bps) – maximum rate is determined bythe link speed and duplex.• Frame size – choose from seven different frame sizes or selectsweep to run the test on all seven frame sizes.• Content – select payload for all 1s, all 0s, alternating 1s and 0sor random.• Test duration can be 2 seconds to 18 hours.Test results can be viewed in a tabular or graphical format.The Rate format tabular view indicates the local and remotetransmit and receive rates together with the total percentage offrames received by both devices. Switching to tabular Frame Formatview shows the number of local and remote frames transmitted andreceived, together with the total percentage of frames receivedby both devices.WAN interface statisticsThroughput resultsPort based network access control (802.1X)To speed deployment of IEEE 802.1X, the OptiView <strong>Series</strong> <strong>III</strong>is capable of performing a full 802.1x transaction with anauthentication server to ensure correct credentials are beingdeployed. The analyzer supports 802.1X authentication throughmost common EAP (Extensible Authentication Protocol) types, 15 intotal, allows import of software certificates and can store multipleauthentication profiles to allow connectivity to different broadcastdomains or networks with multiple authentication servers fordeployment, validation and troubleshooting. A connection log fordetailed 802.1X protocol exchange analysis is also generated.5
Packet capture and decodeGet Gigabit line rate packet capture and filtering to troubleshootproblems where packet level analysis is required and performadvanced troubleshooting when deploying new applications.Sophisticated capture filters allow collection of more relevantdata and limit the amount of traffic to analyze by filtering onindividual addresses or conversation, address range for IPV4,IPv4 subnet, IPv6 prefix and protocols.The capture process may be started or stopped through a userdefined trigger event – capture the traffic before, after or around anevent occurrence without being present. This ensures you capture theevent the first time and avoids initiating random traffic captures thatmay not contain anything of interest.With the captured traffic, launch the OptiView IntegratedProtocol Expert to examine packet level decodes and detailin combination with a graphical representation of individualconversation threads. Captured data will automatically be sortedinto conversations and displayed by the timeline as an ApplicationBounce Chart to make application performance and troubleshootingeasier to visualize and resolve. For more detailed applicationperformance analysis, add the Expert option.Free String Match to find andcapture anythingMatch any set of words or phrases when detected (regardless of theposition in the packet – payload or header) in real-time to triggerthe analyzer to start or stop capturing and/or filter traffic. Use freestring match to capture traffic around any application error message,detect traffic containing certain words or phrases in non-encryptedemails, web pages, file transfers or documents to identify illicit useof the network or detect downloading of restricted documents basedon content or filenames (.doc, .xls, .pdf). Additionally, use freestring match to identify and track applications that are not allowedon the network such as streaming media that may consume valuablebandwidth, or P2P traffic that may pose a security risk. A total ofeight sets of triggers or filters can be defined to trigger a captureunattended for later analysis, allowing analysis when you have time,not when the event occurred.* Note: The OptiView Protocol Expert (OPV-PE/PRO) is required to beinstalled on the controlling PC of an OptiView Workgroup analyzerin order to decode captured traffic.Reporting/documentingPacket decode with applicationbounce chart displayFree String Match setupWhile viewing the statistics, discovery or detail screens, pressing theReports key will generate HTML reports on Protocols, Top Hosts, TopConversations, Devices, <strong>Network</strong>s, Problems and many more. Thesereports are saved and may be viewed locally or remotely using aweb browser. For advanced documentation, add OptiView Reporterand automatically import the OptiView Analyzer data for reporting,trending and event notification. OptiView Reporter’s integration withMicrosoft Office Visio diagramming program allows you to createnetwork maps showing the links between your servers, switches,routers and hosts.6
Remote user interfaceSimply point a web browser at the IP address of a correctlyconfigured OptiView <strong>Series</strong> <strong>III</strong> Integrated <strong>Network</strong> Analyzer toretrieve saved reports and capture files. You can also install a RemoteUser Interface (UI) and use your PC to obtain remote access to ananalyzer over a TCP/IP connection. Once the Remote UI is installed,simply give the interface the IP address of the analyzer to monitorand see an almost identical interface to the analyzer’s local interface.Communications between the analyzer and Remote UI can also beencrypted. A single integrated analyzer will support seven remotesessions (eight sessions on the Workgroup analyzer) for collaborativetroubleshooting or opening of multiple sessions on a PC to provide aremote dashboard view. Additionally, use the analyzers managementport to configure and monitor for out of band managementindependently of the network under test port.User accountsUser accountsThrough the user accounts screen, you can add and modify analyzersecurity information for each individual analyzer user, which preventsunauthorized use of certain analyzer features for easier compliancewith regulatory requirements. Features that can be disabled includepacket capture and decode, traffic generation, remote user interfaceand analyzer configuration.Context sensitive helpHelp is contextually linked to each screen in the analyzer. While thathelp screen is displayed, you may select other information from thetable of contents, choose an index entry, or perform a full text searchon any help topic or term.Integrated <strong>Network</strong> Analyzer removablehard drive option for classified environmentsSee what’s happening on your classified network by simplyconnecting one single tool that ensures any sensitive data stored onyour network analyzer’s hard drive never leaves that environment.Fluke <strong>Network</strong>s OptiView <strong>Series</strong> <strong>III</strong> Integrated <strong>Network</strong> Analyzerwith removable hard disk drive is a new approach to classifiedenvironment network analysis that provides you with the <strong>Network</strong>SuperVision you need for all seven layers, along with the speedand simplicity your organization demands. <strong>Network</strong> informationdiscovered by the OptiView <strong>Series</strong> <strong>III</strong> Integrated <strong>Network</strong> Analyzercan be stored on the removable hard drive which allows the analyzerto be moved from classified environments of different levels andbetween classified and unclassified systems by simply replacingthe hard drive.Optional removable hard drive7
OptiView ® Expert Analysis OptionWhen analyzing captured packets collected by the OptiViewanalyzer, the Expert Analysis Option provides detailed applicationflow analysis for various protocols such as DNS, DHCP, HTTP, HTTPS,SMTP and SMB and presents information such as:• an overview of the protocols on the trace• aggregate throughput for individual applications over time• a list of servers and clients by protocol• detailed transactions for each application layer protocolincluding a list of individual commands• application turns• throughput for each application transaction includingpayload vs. header data• server response time from client request to first datasent by server• connection setup time• any issues detected during the application sessionA bounce chart also shows at-a-glance information forconnection setup times, connection setup packets, error packetsand transport layer packets.For <strong>Network</strong> related performance problems, the expert willcategorize the problems detected by OSI layers. It summarizesthe address or name of the stations involved, and the position offrames in the capture file that trigger the Expert System to identifythe problem. The Expert System will identify symptoms suchas Excessive ARP, Excessive BOOTP, NFS Retransmission, TCP/IPchecksum error,TCP/IP Fast Retransmission, TCP/IP Retransmission, TCP/IPFrozen Window, TCP/IP Long Ack and TCP/IP SYN Attack and manyothers. Double clicking on the Expert Symptom button displays theExpert Diagnosis window that provides a description of the stationsymptom, a probable cause and recommended action(s).Expert analysis* Note: For post capture application analysis, the OptiView Protocol Expert (OPV-PE/PRO) is required to be installed on the controlling PC of an OptiView Workgroupanalyzer in order to decode captured traffic.8
OptiView ® Voice over IPVoice over IP is one of the most mission critical applications beingdeployed by IT organizations today. The rollout of VoIP servicesis accompanied by the expectation of toll availability and soundquality. It is therefore imperative IT organizations have the propertools to monitor VoIP call QoS during and after implementation.OptiView Integrated <strong>Network</strong> Analyzer with the VoIP option canprocess a capture file and use advanced algorithms to grade the voicequality being delivered. QoS assessments are generated for each callwithout the need to perform detailed decoding.“Quality Grading” thresholds can be set for key VoIP QoSparameters, such as R-Factor, Jitter, Packet Drop and Call Setup Time.The number of calls that fall within each Quality Grade is shown forkey QoS parameters. Detailed VoIP call information for every call isclearly shown in a tabular view to allow quick identification of theroute taken and the gateway involved, allowing you to troubleshootquickly. As networks evolve and traffic patterns change with newapplications and users, VoIP QoS can often degrade in imperceptiblesteps, or extreme failure. An initial VoIP deployment might run fineinitially, but incremental changes to the network can slowly erodeVoIP performance or completely eliminate availability. OptiViewensures visibility of VoIP performance and allows quick resolution ofissues due to network growth and development.The VoIP option provides detailed decodes of the most commonlyused VoIP protocols including H.323, Cisco Skinny (SCCP), MGCPVoIP call qualityand SIP. Detailed information supports quick isolation of call setupproblems. Combined with the easy-to-use single call filter andCall and Channel Table Views, call setup failures commonly causedby configuration errors, network equipment incompatibilities, orinteroperability can be easily solved.The Voice over IP Option helps you ensure Quality of Service(QoS) for this mission-critical application. And, by measuring callquality at different locations on the network, IT staff can isolatenetwork segments that need reconfiguration or upgrading.OptiView ® IPv6 Analysis OptionThe analyzer will discover and display complete IPv6 networkand device inventory including routers, switches, wireless AP's,DHCP6 servers and hosts. It enables you to identify active IPv6devices in the network and those that may have problems in singlestackIPv6 networks. Router Advertisements are analyzed and theanalyzer displays information gathered from routers (by subnet)such as the router name, auto configuration, MTU, preferred lifetime,valid lifetime, network name, subnet, local prefix, on link, and userdefinedname.Easily identify applications that may be communicating usingboth IPv4 and IPv6 protocols. In a dual stack network, IPv4 and IPv6can be running at the same time but if the network becomes pureIPv6, the application my not continue to run.Detect devices using tunneling mechanisms and identify thetunnels in use. Undetected or unauthorized tunneling could representa serious security risk.IPv6 Devices9
AirMagnet WiFi Analyzer OptionFluke <strong>Network</strong>s gives you the visibility you need to manage bothyour 802.11 a/b/g/n wireless and 10/100/1000 Ethernet copperand fiber wired networks. By extending the award-winning OptiViewIntegrated <strong>Network</strong> Analyzer with Wi-Fi detection, verification andtroubleshooting, Fluke <strong>Network</strong>s again ensures that OptiView is thenetwork visibility tool of choice.With the WiFi analyzer option, get total visibility into yournetwork. It’s a solution that brings value to key wireless networktasks such as:• Discovery of wireless access points and clients.• Detection and location of rogue APs.• Active client based connectivity testing.• Channel monitoring.• Packet capture and decode for complete analysis of802.11 a/b/g/n WLAN’s.In addition, load Fluke <strong>Network</strong>s’ powerful wireless stand-alonesoftware on the analyzer such as AirMagnet Survey Software for sitesurvey analysis to quickly optimize coverage and performance, orAnalyzeAir Wi-Fi Spectrum Analyzer to detect, identify and locateRF emitting devices that interfere with 802.11 and cause intermittentperformance problems.AirMagnet Wi-Fi Analyzer10
OptiView ® Fiber Inspector OptionDirt, dust and other contaminants are the enemy of high-speed datatransmission over optical fiber. With today’s network applicationsrequiring more bandwidth and loss budgets being tighter than everbefore, it is imperative that all optical connections are clean andfree of contaminants to ensure network operation. Fluke <strong>Network</strong>s’OptiView <strong>Series</strong> <strong>III</strong> Integrated <strong>Network</strong> Analyzer, together with theOptiView Fiber Inspector Option, is the solution.The OptiView Fiber Inspector Option, a portable video microscopethat connects to a USB port on an OptiView <strong>Series</strong> <strong>III</strong> Integrated<strong>Network</strong> Analyzer, gives you superior vision by enabling you to inspectall types of installed fiber terminations in hardware devices and patchpanels. It saves you time by eliminating the need to access the rearof patch panels or disassemble hardware devices prior to inspection.Instead of removing each individual fiber, you need only insert thevideo probe to inspect the fiber while it’s still in place.The OptiView Fiber Inspector:• Easily inspects fiber connectors already installed on patch panels.• Quickly determines whether fiber connectors on a hardwaredevice are clean and in good condition – without disassemblingthe device!• Eliminates the hazards of inspecting live fiber.• Is compatible with standard ST, SC, and FC connectors, and otherconnector types including small form factor connectors withoptional adapter tips.• Leverages the investment already made in the OptiView <strong>Series</strong> <strong>III</strong>Integrated <strong>Network</strong> Analyzer by eliminating the need for aseparate display.Vision SuitesThe Vision Suites turn the OptiView <strong>Series</strong> <strong>III</strong> <strong>Network</strong> <strong>Analyzers</strong>into a complete solution of visionary network management productsthat work with the Integrated <strong>Network</strong> Analyzer to monitor, analyzeand troubleshoot, giving you control of every situation that pops up.You get enterprise-wide vision with the power to drill down sevenlayers deep.You can identify problems through the application layer withOptiView Protocol Expert. It can analyze capture files from theOptiView analyzer for full seven-layer decodes with expert analysis.Advanced filtering and triggering let you find offending packets.And, OptiView Reporter software together with your hardwareagents allows trending of user defined ports in your switched network.Or, set it up to collect data from your analyzer. With a single click,you can generate network connection diagrams with our unique linkto Microsoft® Office Visio® software. And if a key device, router, orswitch port is overloaded, you’ll know about it in a heartbeat.Our <strong>Network</strong> SuperVision Gold Supportplans give you exclusive services and 24/7 technical assistance.Sign up for our Gold Support plan and you’ll enjoy outstandingprivileges to protect and add value to your investment inFluke <strong>Network</strong>s equipment. They include unlimited technicalassistance seven days a week, 24 hours a day via phone orat our web site support center. Repairs on covered itemsand “next day” dispatched loaner units for uninterruptedservice. Free software upgrades. Scheduled annual performanceverification service. Web based training. Access to our extensiveKnowledge Base library of operation and application relatedtechnical articles. And Gold “Members Only” special prices andpromotions. Some benefits are not available in all countries.See www.flukenetworks.com/goldsupport for moreinformation.11
Product ComparisonModelGeneralOperating SystemDisplayOptiView <strong>Series</strong> <strong>III</strong>Integrated <strong>Network</strong> AnalyzerMicrosoft® Windows Vista® Business(including a downgrade right toMicrosoft® Windows® XP Professional)VxWorks for <strong>Network</strong> Measurements800 x 600 pixels, active color panel, CCFT backlight and bezel,touch padIncludedOptiView <strong>Series</strong> <strong>III</strong>Workgroup AnalyzerRemote UI PC DependantVxWorks for <strong>Network</strong> MeasurementsNone;Requires remote user interface installed on a PCHard DriveUSB Ports 3 0PCMCIA 1 0SVGA Output 1 0Power Battery or AC AC Only<strong>Network</strong> ConnectionsRJ-45 RJ-45 10/100/1000BASE-T Ethernet RJ-45 10/100/1000BASE-T Ethernet1000BASE-SX SFP SFP1000BASE-LX, ZX Option (SFP) Option (SFP)802.11a/b/g/n Wireless Option Not availableTraffic Analysis • •Discovery • •Device Detail • •Application Troubleshooting<strong>Network</strong> Services test Option •TCP Port Connectivity Option •Port open response time Option •Post Capture application diagnostics Option Requires DSVS suite or OptiView Protocol Expert (OPV-PE/PRO)IPv6 Analysis Option OptionWireless LAN Infrastructure Analysis Option OptionUtilitiesOptiView Browser • From controlling PCTelnet/SSL • From controlling PCWeb Browser • From controlling PCFTP • From controlling PCMIB Browser • From controlling PCPacket Capture and DecodeCapture • •Decode • Requires DSVS suite or OptiView Protocol Expert (OPV-PE/PRO)Free String Match Trigger and Filter • •Capture Buffer Size 480MB 480MBVoIP Analysis Option - OPVS2-VOIP Option - OPV-PE/VOIPTraffic Generation • •Setup/Other • •Remote control sessions 7 8Cable TestOpens/shorts etc • •Length • •Fiber Microscope (OPV-FT500) Option Not available12
Models, Options and AccessoriesModelOPVS3-GIGOPVS3-GIG/WOPVS3-GIG/SOPVS3-GIG/RHDOPVS3-GIG/PSVSOPVS3-GIG/RHD/PSVSOPVS3-GIG/PSVS/WOPVS3-GIG/PSVS/SModelOPVS3-WGA/GIGOPVS3-WGA/GIG/DSVSModelOPVS3-IPV6OPV-RPTROPV-RPTR/PROLRPRO-REFLCTOPV-SFP-SXOPV-SFP-LXOPV-SFP-ZXOPV-SFP-100FXNF430ModelOPVS2-EXPTOPVS2-VOIPOPVS3-WFAOPVS3-WSPANALYZEAIROPVS3-WSPIOPVS3-WLOPVS2-KBOPVS2-BPOPVS3-RHDOPVS3-RHD/4OPV-FT600OPV-HCASEModelOPV-TCASEOPV-RMKOptiView <strong>Series</strong> <strong>III</strong> Integrated <strong>Network</strong> AnalyzerDescriptionOptiView <strong>Series</strong> <strong>III</strong> Integrated <strong>Network</strong> Analyzer Gigabit (1000BASE-SX)OptiView <strong>Series</strong> <strong>III</strong> Integrated <strong>Network</strong> Analyzer with Wireless (802.11 a/b/g/n) OptionOptiView <strong>Series</strong> <strong>III</strong> Integrated <strong>Network</strong> Analyzer Gigabit with Wireless (802.11 a/b/g/n), VoIP Analysis and Expert Analysis OptionsOptiView <strong>Series</strong> <strong>III</strong> Integrated <strong>Network</strong> Analyzer Gigabit with Removable Hard DriveProfessional Vision Suite with OptiView <strong>Series</strong> <strong>III</strong> Integrated <strong>Network</strong> Analyzer Gigabit.All Professional Vision Suites include OPV-PE/PRO - OptiView Protocol Expert, OPV-RPTR/PRO OptiView Reporter Pro,and OptiView Expert Analysis OptionProfessional Vision Suite with OptiView <strong>Series</strong> <strong>III</strong> Integrated <strong>Network</strong> Analyzer Gigabit with Removable Hard DriveProfessional Vision Suite with OptiView <strong>Series</strong> <strong>III</strong> Integrated <strong>Network</strong> Analyzer and Wireless (802.11 a/b/g/n) OptionProfessional Vision Suite with OptiView <strong>Series</strong> <strong>III</strong> Integrated <strong>Network</strong> Analyzer with Wireless and VoIP Analysis andExpert Analysis Options and AnalyzeAir Wi-Fi Spectrum AnalyzerOptiView <strong>Series</strong> <strong>III</strong> Workgroup AnalyzerDescriptionOptiView <strong>Series</strong> <strong>III</strong> Workgroup Analyzer Gigabit (1000BASE-SX)Distributed Vision Suite with OptiView <strong>Series</strong> <strong>III</strong> Workgroup Analyzer GigabitOptions and Accessories for INA and WGADescriptionOptiView IPv6 Analysis OptionOptiView ReporterOptiView Reporter (40 Devices)LinkRunner Pro Reflector850nm, 50 and 62.5 micron multi mode fiber. 1000BASE-SX SFP adapter1300 nm, 10 micron single mode fiber. 1000BASE-LX SFP adapter1550 nm fiber. 1000BASE-ZX SFP adapter100BASE-FX SFP adapterFiber Optic Cleaning KitOptions and Accessories for INA onlyDescriptionExpert Analysis OptionVoIP Analysis OptionOptiView AirMagnet WiFi Analysis Option 802.11 a/b/g/nOptiView AirMagnet Survey PRO & Planner SuiteAnalyzeAir Wi-Fi Spectrum AnalyzerOptiView Wireless Suite: includes AirMagnet Survey PRO, AirMagnet Planner Module, and AnalyzeAir Wi-Fi Spectrum AnalyzerOptiView WLAN Suite: includes AirMagnet Survey PRO, AirMagnet Planner Module, AnalyzeAir Wi-Fi Spectrum Analyzer, and OptiViewAirMagnet WiFi Analysis Option 802.11 a/b/g/nMini Keyboard (USB)External Battery PackRemovable Hard Drive for OPVS3-GIG/RHDPack of four Removable Hard Drives for OPVS3-GIG/RHDOptiView Fiber InspectorHard Carrying CaseAccessories for WGA onlyDescriptionHard shell transit caseRack Mount Kit for one or two Workgroup <strong>Analyzers</strong>13
SpecificationsGeneral SpecificationsWeightDimensionsDisplayIntegrated <strong>Network</strong> AnalyzerWithout external battery 2.2 kilograms (5.0 lbs)With external battery 3.0 kilograms (6.6 lbs)26.0 x 23.4 x 6.4 centimeters (10.3 x 9.2 x 2.5 inches)LCD touch screen, 800 x 600 pixels, active color panel,CCFT back-light and bezel, touch padWorkgroup Analyzer1.63 kilograms (3.6 lbs)4.1 x 21.1 x 32.8 cm (1.6 x 8.3 x 12.9 in), one half of astandard 19 in rack mount widthNot applicableLED Indicators 16 (21 with external battery) 6PowerBatteryInternal battery Lithium Ion 11.1 V DC (nominal), 2 AhExternal battery Lithium Ion 11.1 V DC (nominal), 6 AhNot applicableACExternal AC adapter/battery charger AC input: 120 V –240 V, 50/60 Hz, 1.5 A DC output: 15 V, 4.0 AAC input 85 to 265 VAC; 47/63 Hz; 25 wattsPortsCommunication and accessory ports 3 USB, 1 PC Card type II, 1 VGA out 15-pin connector Serial Configuration Port RS-232 (9-pin male)<strong>Network</strong> analysis portsRJ-45 10/100/1000BASE-T Ethernet, fiber 100/1000BASE-X SFP GBICManagement port10/100/1000BASE-T (RJ-45) Ethernet<strong>Network</strong> StandardsLAN InterfacesIEEE 10BASE-T, IEEE 100BASE-TX, IEEE 100BASE-FX, IEEE 1000BASE-XStandard SNMP MIBs Used RFCs: 1213, 1231, 1239, 1285, 1493, 1512, 1513, 1643, 1757, 2021, 2108, 2115, 2127, 2495, 2515, 2558MediaCable TypesUnshielded Twisted Pair LAN cables (100 and 120 Ohm UTP category 3, 4, 5, 5E, and 6 ISO/IEC Class C and D);Foil-screened Twisted Pair cables (100 and 120 Ohm ScTP category 3, 4, 5, and 6 ISO/IEC Class C and D)Cable Length 11 to 153 m (3 ft to 500 ft) +/- 2 m (6 ft)Environmental and SafetyOperating Temperature10°C to 30°C (50°F to 86°F) with up to 95% Relative Humidity10°C to 40°C (50°F to 104°F) with up to 75% Relative HumidityNon-Operating Temperature -40°C to +71°C (-40°F to +159.8°F) -20°C to +60°C (-4°F to +140°F)ApprovalsShock and vibrationMeets requirements of MIL-PRF-28800F for Class 3 equipmentLaserClass 1 Laser Product, complies with 21 CFR 1040.10 & 1040.11, CFR(J), and EN60825-1:1994/A1:1997/A2:2002SafetyComplies with CAN/CSA-C22.2 NO. 60950-1 Canadian Standards, and UL 60950-1 (U.S. standards)(CE) Complies with EN60950NETWORKSUPERVISIONFluke <strong>Network</strong>sP.O. Box 777, Everett, WA USA 98206-0777Note: All PSVS Suites include OPV-RPTR/PRO OptiView Reporter Pro, OPVS2-EXPT OptiView Expert Analysis Option and OPV-PE/PRO Protocol Expert Pro.All DSVS Suites include OPV-RPTR/PRO OptiView Reporter Pro and OPV-PE/PRO Protocol Expert Pro.Fluke <strong>Network</strong>s operates in more than 50 countriesworldwide. To find your local office contact details,go to www.flukenetworks.com/contact.©2010 Fluke Corporation. All rights reserved.Printed in U.S.A. 2/2010 1590227P14


