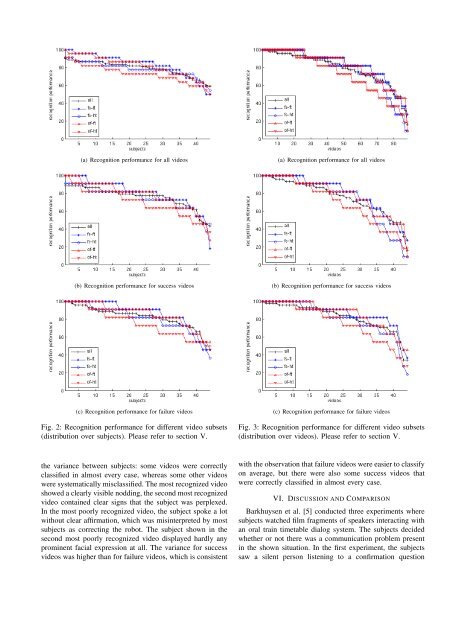
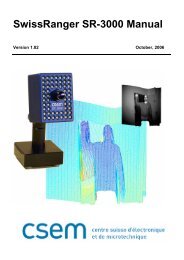
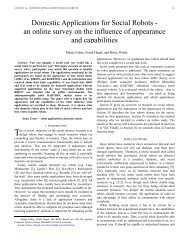
(a) Stationary scene camera (b) Stationary face camera (c) Biron’s pan tilt cameraFig. 1: The object teaching corpus contains videos from three perspectives showing (a) <strong>the</strong> whole scene, (b) <strong>the</strong> subject’sface, and (c) <strong>the</strong> view of Biron’s pan tilt camera.<strong>the</strong> o<strong>the</strong>r case. 2 All videos were presented without sound.The video sequences were distributed over <strong>the</strong> 44 subjectssuch that <strong>the</strong> following conditions were met:• Each subject saw each video sequence in one contextvariant only. To avoid <strong>the</strong> effect of priming, we decidednot to show <strong>the</strong> same sequence twice (in differentvariants) to <strong>the</strong> same person.• Each subject saw all 88 video sequenes (and thus foursuccess and four failure scenes for each of <strong>the</strong> 11subjects from <strong>the</strong> object–teaching study) in randomizedorder.• Each subject saw exactly 22 videos in each of <strong>the</strong>four context variants: 11 “success” and 11 “failure”interaction situations (in randomized order).• Summed up over all 44 subjects, each video was seenby 11 subjects in each of <strong>the</strong> four context variants.V. RESULTSOn average, <strong>the</strong> subjects of <strong>the</strong> feedback interpretation userstudy were able to classify <strong>the</strong> video segments with 79.1%recognition performance. We did not observe differencesbetween female and male subjects, <strong>the</strong> classification rate was79.1% for both. Figure 2 shows <strong>the</strong> recognition performancedistributed over all 44 subjects for all videos, only “success”videos, and only “failure” videos, in each case for all fourcontext variants:• all: average over all context variants• fs-ft: full scene and full time• fs-ht: full scene and half time• of-ft: only face and full time• of-ht: only face and half timeThe subjects are sorted by <strong>the</strong> recognition performance ineach case. Table II lists <strong>the</strong> mean recognition performanceand standard deviation.There were big differences between <strong>the</strong> subjects, rangingfrom 89% to 59% on average. The visual context helped2 The faces were located as rectangular regions using an automatic facedetection approach (based on <strong>the</strong> work of Castrillón et al. [16]) that ledto a kind of “glint” around <strong>the</strong> faces (as <strong>the</strong> face size varies somewhat) insome cases, also in a few cases <strong>the</strong> face detection got lost for a few frames.Videos where <strong>the</strong> face detection was too poor were rejected beforehand.sub- all videos success videos failure videosset mean std mean std mean stdall 79.1 8.2 75.8 11.9 82.4 12.0fs-ft 83.4 12.8 80.2 16.8 86.6 16.2fs-ht 78.2 8.1 75.0 12.6 81.4 15.3of-ft 82.0 11.1 78.1 16.3 86.0 13.5of-ht 72.8 9.9 69.8 15.9 75.8 15.9TABLE II: Mean value and standard deviation of <strong>the</strong> recognitionperformance for different video subsets (distributionover subjects). Please refer to section V.in <strong>the</strong> classification, as <strong>the</strong> performance was better for fullscene videos compared to face–only videos, significantly forhalf time videos (t–test, p < 0.01) and very slightly only(not significantly) for full time videos (p < 0.61). Thetemporal context seemed to be even more important, as <strong>the</strong>performance was higher for full time videos compared tohalf time videos, and <strong>the</strong> difference was greater than for <strong>the</strong>visual context. This effect was significant for both full scene(p < 0.03) and face–only (p < 0.001) videos. On average,it was easier to classify failure videos than to classifysuccess videos (p < 0.011). In both cases, <strong>the</strong> variance washigher than <strong>the</strong> total variance for all videos, because mostsubjects (26) were better in classifying failure videos thanin classifying success videos, but for some subjects (12) <strong>the</strong>opposite was <strong>the</strong> case (six subjects performed equally wellin ei<strong>the</strong>r case).Similar to Figure 2 and Table II, Figure 3 and Table IIIshow <strong>the</strong> recognition performace distributed over all videos.The variance between different videos was even greater thansub- all videos success videos failure videosset mean std mean std mean stdall 79.1 17.9 75.8 19.4 82.4 15.8fs-ft 83.4 18.1 80.2 21.1 86.6 14.1fs-ht 78.2 24.0 75.0 27.2 81.4 20.1of-ft 82.0 19.1 78.1 21.2 86.0 16.1of-ht 72.8 23.9 69.8 25.8 75.8 21.7TABLE III: Mean value and standard deviation of <strong>the</strong> recognitionperformance for different video subsets (distributionover videos). Please refer to section V.
(a) Recognition performance for all videos(a) Recognition performance for all videos(b) Recognition performance for success videos(b) Recognition performance for success videos(c) Recognition performance for failure videosFig. 2: Recognition performance for different video subsets(distribution over subjects). Please refer to section V.(c) Recognition performance for failure videosFig. 3: Recognition performance for different video subsets(distribution over videos). Please refer to section V.<strong>the</strong> variance between subjects: some videos were correctlyclassified in almost every case, whereas some o<strong>the</strong>r videoswere systematically misclassified. The most recognized videoshowed a clearly visible nodding, <strong>the</strong> second most recognizedvideo contained clear signs that <strong>the</strong> subject was perplexed.In <strong>the</strong> most poorly recognized video, <strong>the</strong> subject spoke a lotwithout clear affirmation, which was misinterpreted by mostsubjects as correcting <strong>the</strong> robot. The subject shown in <strong>the</strong>second most poorly recognized video displayed hardly anyprominent facial expression at all. The variance for successvideos was higher than for failure videos, which is consistentwith <strong>the</strong> observation that failure videos were easier to classifyon average, but <strong>the</strong>re were also some success videos thatwere correctly classified in almost every case.VI. DISCUSSION AND COMPARISONBarkhuysen et al. [5] conducted three experiments wheresubjects watched film fragments of speakers interacting withan oral train timetable dialog system. The subjects decidedwhe<strong>the</strong>r or not <strong>the</strong>re was a communication problem presentin <strong>the</strong> shown situation. In <strong>the</strong> first experiment, <strong>the</strong> subjectssaw a silent person listening to a confirmation question