Drawing Organization Charts Using VIVO
Drawing Organization Charts Using VIVO
Drawing Organization Charts Using VIVO

Create successful ePaper yourself
Turn your PDF publications into a flip-book with our unique Google optimized e-Paper software.
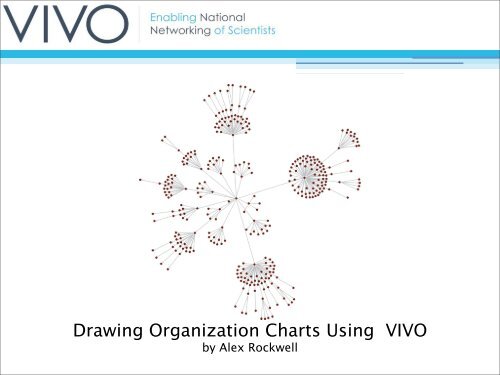
<strong>Drawing</strong> <strong>Organization</strong> <strong>Charts</strong> <strong>Using</strong> <strong>VIVO</strong>by Alex Rockwell
Introduction• Purpose• Program Design• Use Cases• Extending to People
Purpose• One of the goals of <strong>VIVO</strong> is to show whichorganizations faculty, staff, and studentsbelong to.• UF's academic structure is highly complexand does not correspond to its financialstructure.• UF does not have a facility to createorganizational charts. Most organizationcharts are created by hand.
Original Uses• Demonstrate how to work with <strong>VIVO</strong>'s linkeddata• Create org charts automatically for eachinstitution• Create poster sized drawings for marketingpurposes
Program Design
Art vs Science• More than 60% of my time on the projecthas been spent drawing graphs.• Over 100 graphs have been created.• <strong>Drawing</strong> graphs with 500+ nodes andincluding labels is extremely difficult.
First Graph• Extends several feet in both directions• This first result was so bad I nearly scrappedthe whole project...
Evolution
Evolution
Evolution
Evolution
Immediate Impact• The original picture generated substantialinterest in the program.• Showed that writing interesting 3rd partyapplications on the <strong>VIVO</strong> platform ispossible.• Many problems including missing,misplaced, and duplicated data have beenuncovered by the crawler.
Finding all UF organizations• Over 100 external organizations were addedto <strong>VIVO</strong> during CV entry of the showcasedepartments.• SPARQL cannot do recursive queries, so wedid not have a tool to automatically find allsub-organizations of UF.• Extended the ontology locally with aroot<strong>Organization</strong> data property to markorganizations as children of UF.
Finding Data Problems• Looking at graphs generated by the programhas uncovered many problems in our data,including missing, misplaced, andduplicated records.• We can understand the organizationalstructure much faster by looking at thegraph rather than manually following thelinks from one organization to another.
Extending to People• Plan to show the relationship betweenpeople and their affiliations withdepartments, centers and institutes.• Need to import data to show the heads ofdepartments.• Finding the right representation will bechallenging because UF's VVIO will includeclose to 30,000 people by the end of thegrant.
Interactive Graph Demo• Demo available at http://qa.vivo.ufl.edu/infovis/demo.html• Created with JavaScript InfoVis Toolkit(http://thejit.org)
Contact Information• Alex Rockwell (alexhr@ufl.edu)• Source code available atgithub.com/arockwell/vivo_org_chart