Chapter-III(59-80) - Pollution Control Board, Assam
Chapter-III(59-80) - Pollution Control Board, Assam
Chapter-III(59-80) - Pollution Control Board, Assam

You also want an ePaper? Increase the reach of your titles
YUMPU automatically turns print PDFs into web optimized ePapers that Google loves.
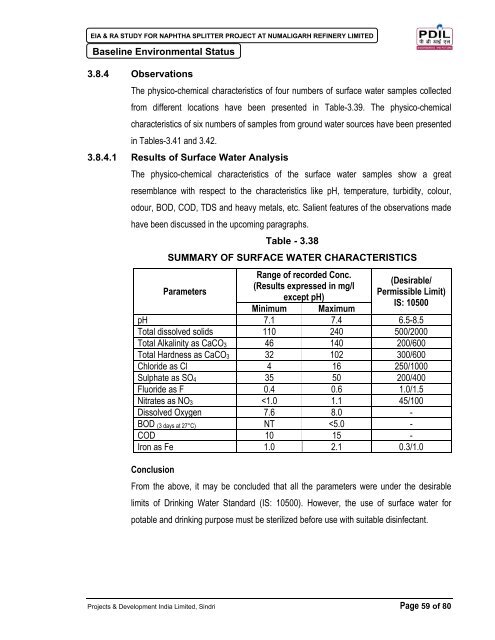
EIA & RA STUDY FOR NAPHTHA SPLITTER PROJECT AT NUMALIGARH REFINERY LIMITEDBaseline Environmental Status3.8.4 ObservationsThe physico-chemical characteristics of four numbers of surface water samples collectedfrom different locations have been presented in Table-3.39. The physico-chemicalcharacteristics of six numbers of samples from ground water sources have been presentedin Tables-3.41 and 3.42.3.8.4.1 Results of Surface Water AnalysisThe physico-chemical characteristics of the surface water samples show a greatresemblance with respect to the characteristics like pH, temperature, turbidity, colour,odour, BOD, COD, TDS and heavy metals, etc. Salient features of the observations madehave been discussed in the upcoming paragraphs.Table - 3.38SUMMARY OF SURFACE WATER CHARACTERISTICSParametersRange of recorded Conc.(Results expressed in mg/lexcept pH)(Desirable/Permissible Limit)IS: 10500Minimum MaximumpH 7.1 7.4 6.5-8.5Total dissolved solids 110 240 500/2000Total Alkalinity as CaCO 3 46 140 200/600Total Hardness as CaCO 3 32 102 300/600Chloride as Cl 4 16 250/1000Sulphate as SO 4 35 50 200/400Fluoride as F 0.4 0.6 1.0/1.5Nitrates as NO 3
EIA & RA STUDY FOR NAPHTHA SPLITTER PROJECT AT NUMALIGARH REFINERY LIMITEDBaseline Environmental StatusTable - 3.39PHYSICO-CHEMICAL CHARACTERISTICS OF SURFACE WATER SAMPLESPeriod : December 2007 to February 2008(Result are expressed in mg/l, unless otherwise stated)ANALYSIS RESULTSSl.No.PARAMETERSKalianiRiverDhansiriRiver(U/S)DhansiriRiver(D/S)DoirgrungRiverDesirable/PermissibleLimitIS: 10500PHYSICAL1 Temperature, O C 20.1 23.2 23.1 24.0 -2 pH 7.1 7.2 7.4 7.3 6.5-8.53 Colour, HU 3 2 2 2 5/254 Turbidity, NTU 10 15 15 15 5/105 Total dissolved solids 110 170 176 240 500/20006 Suspended Solids 12 10 15 15CHEMICAL1 Total Alkalinity as CaCO 3 46 90 84 140 200/6002 Total Hardness as CaCO 3 32 98 102 92 300/6003 Calcium Hardness as Ca 8 22 22 20 75/2004 Mag. Hardness as Mg 4 10 12 10 305 Chloride as Cl 8 4 6 16 250/10006 Sulphate as SO 4 50 36 40 35 200/4007 Nitrate as NO 3 1.1
EIA & RA STUDY FOR NAPHTHA SPLITTER PROJECT AT NUMALIGARH REFINERY LIMITEDBaseline Environmental Status3.8.4.2 Analytical Results of Ground WaterPhysico-chemicals characteristics of six ground water samples from the site collectedduring the study period are presented in Tables 3.41 and 3.42. The ground water samplescollected from the above locations show wide variations with respect to almost all theparameters.Table - 3.40SUMMARY OF CHARACTERISTICS OF GROUND WATER SAMPLESParametersRange of recorded Conc.(Results expressed inmg/l except pH)(Desirable /Permissible Limit)IS: 10500Minimum MaximumpH 6.2 7.1 6.5-8.5Total Dissolved Solids 128 238 500/2000Total Alkalinity as CaCO 3 44 124 200/600Total Hardness as CaCO 3 40 88 300/600Calcium Hardness as Ca 8 20 75/200Chloride as Cl 8 16 250/1000Sulphate as SO 4 30 75 200/400Iron as Fe 0.65 2.1 0.3/1.03.8.5 DiscussionThe concentration of iron in all ground water samples exceeds the desirable as well aspermissible limits of Drinking Water Standard IS: 10500. All the other parameters such aspH, TDS, Alkalinity, Hardness, Chloride are well below the specified limits of drinking waterstandard IS: 10500.Conclusion: The analysis results of ground water samples collected from differentlocations reveals that ground water is suitable for domestic, irrigation and industrialpurposes. Ground water from shallow aquifer has slightly higher pH whereas ground waterfrom deeper aquifer is slightly acidic in nature. The high concentration of iron beyondpermissible limit in ground water has been found in some areas, which can be lowered byaeration and filtration method. However, NRL doesn’t use ground water for any purpose.Projects & Development India Limited, Sindri Page 61 of <strong>80</strong>
EIA & RA STUDY FOR NAPHTHA SPLITTER PROJECT AT NUMALIGARH REFINERY LIMITEDBaseline Environmental StatusTable - 3.41CHARACTERISTICS OF GROUND WATER SAMPLESPeriod : December 2007 to February 2008Sl.No.PARAMETERS(Result are expressed in mg/l, unless otherwise stated)Hand PumpBaruagaonANALYSIS RESULTSHand PumpKomargaonHand PumpRong Bong(Desirable /PermissibleLimit)IS: 10500PHYSICAL1 Temperature, O C 22.2 19.1 25.8 -2 pH 6.5 6.2 6.4 6.5-8.53 Colour,HU 2 2 2 5/254 Turbidity, NTU 2 3 2 5/105 Total Dissolved Solids 223 227 158 500/2000CHEMICAL1 Total Alkalinity as CaCO 3 124 74 70 200/6002 Total Hardness as CaCO 3 82 78 52 300/6003 Calcium Hardness as Ca 20 18 12 75/2004 Magnesium Hardness as Mg 8 8 6 305 Chloride as Cl 10 16 8 250/10006 Sulphate as SO 4 40 70 35 200/4007 Nitrate as NO 3 1.2
EIA & RA STUDY FOR NAPHTHA SPLITTER PROJECT AT NUMALIGARH REFINERY LIMITEDBaseline Environmental StatusTable - 3.42CHARACTERISTICS OF GROUND WATER SAMPLESPeriod : December 2007 to February 2008Sl.No.(Result are expressed in mg/l, unless otherwise stated)PARAMETERSHand PumpNRLTownshipANALYSIS RESULTSBorewellTelgramHand PumpNumaligarhTown(Desirable /PermissibleLimit)IS: 10500PHYSICAL1 Temperature, O C 27.2 24.1 25.2 -2 pH 6.7 7.1 6.9 6.5-8.53 Colour,HU
EIA & RA STUDY FOR NAPHTHA SPLITTER PROJECT AT NUMALIGARH REFINERY LIMITEDBaseline Environmental Status3.8.6 Water Balance3.8.6.1 Source of WaterThe water requirement of NRL complex, Township, Numaligarh Marketing Terminal andCISF is met through the water intake well located near Dhansiri River. The intake well islocated in Lattakoojan village near Dhansiri River at a distance of about 2.5-kms fromrefinery. Water is discharged through pipeline of size about 24 inches and the total lengthof about 2.5-kms from Intake Well to raw water reservoire. Water is available in the regionthrough an extensive network of natural drainage/ river system leading towards Kaliani andDhansiri River, tributaries of Brahmaputra river catchement area.3.8.6.2 Water ConsumptionWater balance of Numaligarh Refinery may be summarized as under:Table - 3.43Details of Water BalanceSl. No. Description of Plants / Utilities m 3 /dayInput01 Total Raw Water Requirement 16,054Output02 Consumption in Fire Water System 3,98103 Consumption in RW Treatment Plant 12,08404 Treated Water Generated 11,78705 Effluent Loss 27106 Hume Pipe Loss 15Consumption of Treated Water07 DM Water Make up 5,01308 Service Water 1,66909 Drinking Water (Refinery) 38310 Drinking Water (NRL Township) 1,92211 Drinking Water (NRMT/CISF) 51512 Cooling Water Make-up 1,30813 Treated Water in Storage Tanks 977Total 11,7873.8.6.3 Wastewater GenerationThe total wastewater generation have been estimated as 2640 m 3 /day (110 m 3 /hr), whichincludes contaminated oily waste water, sanitary wastewater etc. The wastewatergenerated from different sources is segregated into Clean Stream of wastewater, OilyWastewater Stream (OWS) and Contaminated Rain Water Stream (CRWS). Clean StreamProjects & Development India Limited, Sindri Page 64 of <strong>80</strong>
EIA & RA STUDY FOR NAPHTHA SPLITTER PROJECT AT NUMALIGARH REFINERY LIMITEDBaseline Environmental Statuscomprises desludging at raw water treatment plant, DM Plant, Boiler Blowdown, CoolingTower Blowdown etc. OWS comprises desalter effluent, stripped sour water, processsteam condensate, floor washings etc. CRWS comprises oily effluents including sanitarywastewater etc. Details of waste water generation may be summarized as under:Table-3.44Sl. No. Source m 3 /day01. Oily Water Stream (OWS) 121502. Contaminated Rain Water Stream (CRWS) 71303. DM Plant 42204. CT Blow Down 290Total Waste Water Generation 2640All these effluents are treated in existing Effluent Treatment Plant which has beendesigned to treat 5,2<strong>80</strong> m 3 /day 220 m 3 /hr.There is a Sewage Treatment Plant (STP) meant for purification of the domestic sewageoriginating from NRL factory and NRL township. The direct discharge of raw sewage intothe inland surface water causes depletion of DO content in the receiving water bodycausing destruction of aquatic flora and fauna. This plant is designed to treat <strong>80</strong>0 m 3 /dayand conforms to the requisite standards.Projects & Development India Limited, Sindri Page 65 of <strong>80</strong>
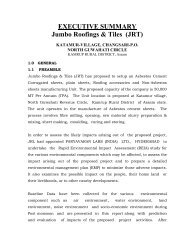
EIA & RA STUDY FOR NAPHTHA SPLITTER PROJECT AT NUMALIGARH REFINERY LIMITEDBaseline Environmental StatusFLOW DIAGRAM OF ETP (Contd.)PLATE - 3.8.1Projects & Development India Limited, Sindri Page 66 of <strong>80</strong>
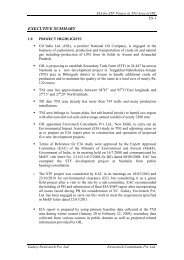
EIA & RA STUDY FOR NAPHTHA SPLITTER PROJECT AT NUMALIGARH REFINERY LIMITEDBaseline Environmental StatusFLOW DIAGRAM OF ETP (Contd.)PLATE - 3.8.2Projects & Development India Limited, Sindri Page 67 of <strong>80</strong>
EIA & RA STUDY FOR NAPHTHA SPLITTER PROJECT AT NUMALIGARH REFINERY LIMITEDBaseline Environmental StatusFLOW DIAGRAM OF ETPPLATE - 3.8.3Projects & Development India Limited, Sindri Page 68 of <strong>80</strong>
EIA & RA STUDY FOR NAPHTHA SPLITTER PROJECT AT NUMALIGARH REFINERY LIMITEDBaseline Environmental Status3.9 NOISE ENVIRONMENT3.9.1 IntroductionNoise can be defined as unwanted sound or sound in the wrong place at the wrong time.Noise can also be defined as any sound that is undesirable because it interferes withspeech and hearing, is intense enough to cause hearing impairment, or is otherwiseannoying. It has an adverse impact on human beings and environment, including land,structures and domestic animals. Noise can also disturb natural wildlife and eco-systems.The noise problem arises when the ambient sound level interferes with human activities.The general perception of noise varies depending on number of factors such asindividual’s natural sensitivity/ hearing ability, past experience, time of the day, socioculturalactivities at the time of exposure to sound etc. The impact of noise at communitylevel can have different effects varying from aesthetic impairment such as annoyance to ashigh as to cause hearing impairment. The health impact of noise on individual depends onseveral source factors, viz., intensity of sound pressure level, frequency spectrum, andintermittency as well as human factors such as sex, age, health condition, occupationalexposure, etc.3.9.2 Effects of NoiseAlmost all noise problems involve three basic elements, viz., the noise source, thetransmission path, and the receptor. In environmental noise, one is usually concerned withsound propagation through air. Sound, as a disturbance propagating through air, is awave-propagating phenomenon. Sound propagation from a source to a receptor dependsupon the properties of the atmosphere and the presence of any object in the transmissionpath. Sound, during transmittance, undergoes absorption, diffraction, scattering, reflection,etc. One of the most important considerations during assessment of noise impact is theeffect of wave divergence.Environmental noise can have several effects varying from hearing loss to annoyance.Sufficiently loud noise may* cause hearing loss or health damage;* interfere with work tasks, especially those involving concentration of mind;* interfere with speech communication;* affect inter-room privacy;* interfere with sleep; and* cause annoyance.Projects & Development India Limited, Sindri Page 69 of <strong>80</strong>
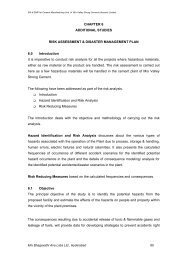
EIA & RA STUDY FOR NAPHTHA SPLITTER PROJECT AT NUMALIGARH REFINERY LIMITEDBaseline Environmental StatusThe damage risk criteria for hearing, enforced by the U.S. Occupational Safety and HealthAdministration to reduce hearing loss, are as follows:Maximum allowableduration/day, hoursTable - 3.45Damage Risk CriteriaNoise level, dB(A)(slow Response)8 906 924 953 972 1001.5 1021 1050.5 1100.25 or less 115Any community noise exposure comparable to those shown above is clearly unacceptableand constitutes a community health hazard. In community noise exposure, annoyance andphysiological damage can occur at much lower noise levels. For example, sleepinterference begins to occur at around 45 dB(A). Adverse community response andcomplaints start at around 70 dB(A) level. However, noise levels up to 65 dB(A) aregenerally acceptable and continued exposure to higher noise levels may cause hearingloss, leading to hearing handicap and deafness. In most cases, hearing loss is caused bya gradual shifting of threshold of hearing due to repeated exposure to noise. Backgroundnoise in the environment may interrupt speech communication, may cause awakeningfrom sleep, can keep one from falling asleep and can also affect the quality of sleep.3.9.3 Monitoring Methodology & Baseline Environmental StatusThe objective of ambient noise monitoring around NRL complex was to assess the backgroundnoise levels due to existing refinery operations and impact of noise from proposedNS project on human settlements in the study area. Methodology involved in datageneration of noise level may be summarized as under:• Identification and characterization of noise sources within NRL complex• Identification and characterization of noise sources around NRL complex in the studyarea• Measurement of noise level of different equipments of different plants within NRLcomplex including boundary area.Projects & Development India Limited, Sindri Page 70 of <strong>80</strong>
EIA & RA STUDY FOR NAPHTHA SPLITTER PROJECT AT NUMALIGARH REFINERY LIMITEDBaseline Environmental Status3.9.4 Sources of NoiseThe main sources of noise in existing NRL complex are the machines and equipmentswithin different process units and other off-site facilities and utilities. Major noise sourcesare GTG, Air Compressors, Feed Pumps, ID Fans, Cooling Towers, FD Fans, etc. Toevaluate the noise generated by different equipments, noise level measurements werecarried out near the major sources, in all the four directions i.e. north, south, east and westduring day and night periods. The average value of all the evaluations has been reportedin day and night periods.The movement of vehicles inside NRL complex also contribute to ambient noise levels. Anumber of heavy vehicles are operating every day within marketing terminal and along NH-39 which is a very busy highway, located just near the refinery complex.3.9.5 Existing Ambient Noise LevelTo evaluate the ambient noise level of major noise sources inside NRL complex, a studywas carried out during the study period from December 2007 to February 2008. The noiselevels were measured at a distance of 3 metres from major sources. An Integrated SoundLevel Meter was used in all the measurements. The measurements were carried outcontinuously, at hourly intervals, for the 24-hour period to obtain hourly sound pressurelevel. From these values, Leq values for day time, night time and 24-hour period werecalculated. The sampling locations are presented at Plate- 3.9.Table - 3.46DETAILS OF NOISE SAMPLING LOCATIONSLocation Code Description of sampling locationsDistance Directionw.r. to NRLNS1 Main Gate- Refinery - -NS2 Crude Distillation Unit (CDU) - -NS3 Hydrogen Plant (H 2 U) - -NS4 HCU - -NS5 SRU - -NS6 Captive Power Plant (CPP) - -NS7 Bishnupur 1.0 km WNS8 Rong Bong 2.0 km WSWNS9 Numaligarh Town 8.0 km NWNS10 Khumtai 3.5 km NENS11 Pura Bangla 7.0 km ESENS12 Lattakoojan 2.0 km SProjects & Development India Limited, Sindri Page 71 of <strong>80</strong>
EIA & RA STUDY FOR NAPHTHA SPLITTER PROJECT AT NUMALIGARH REFINERY LIMITEDBaseline Environmental Status3.9.6 Results & Discussion3.9.6.1 Ambient Noise Level within Refinery CampusThe ambient noise level recorded at the main plants has been presented in Table- 3.48.The 24 hour leq values of noise level in main Units was recorded in the range of <strong>59</strong>.5dB(A) to 61.5 dB(A). The noise level recorded during day time was in the range of 54.1 to70.0 dB(A) and the same was found in the range of 46.8 to 60.5 dB(A) during night time.It is concluded that the observed noise level values of the plants located within NRLcomplex are in compliance with and well below the noise level standards for industrialareas.3.9.6.2 Ambient Noise Level outside RefineryThe ambient noise level of the areas located outside NRL complex has been presentedthrough Tables - 3.49. The 24 hour leq values of ambient noise in the nearby villagesaround NRL have been found in the range of 41.5 to 48.4 dB(A). Noise levels in all thevillages located around NRL complex were recorded in the range of 39.5 to 54.5 dB(A)during day hours whereas the same were reported to be 38.4 to 47.9 dB(A) in night hours.It is concluded that the observed noise level values of the areas located outside therefinery complex are in compliance with and well below the noise level standards forresidential and rural areas.3.9.7 Ambient Noise Level StandardsThe Government of India, in exercise of its power under section 16(2)(h) of the Air(Prevention and <strong>Control</strong> of <strong>Pollution</strong>) Act 1981, notified the ambient air quality standardswith respect to noise (which has been included as an air pollutant under section 20 of theAmended Air Act of 1987) is presented in Table- 3.47.Table - 3.47National Ambient Air Quality Standard for NoiseAreaCategory of AreaLimits in Decibels, dB(A)Day TimeNight TimeA Industrial Area 75 70B Commercial Area 65 55C Residential Area 55 45D Silence Zone 50 40NOTE:1. Day Time is reckoned between 6 AM and 10 PM.2. Night Time is reckoned between 10 PM and 6 AM.Projects & Development India Limited, Sindri Page 72 of <strong>80</strong>
EIA & RA STUDY FOR NAPHTHA SPLITTER PROJECT AT NUMALIGARH REFINERY LIMITEDBaseline Environmental Status3. Silence Zone is defined as area up to 100 metres around such premises as hospitals,educational institutions and courts. The silence zones are to be declared by thecompetent authority. Use of vehicular horns, loudspeakers and bursting of crackersshall be banned in these zones.4. Mixed categories of areas may be declared as one of the four above mentionedcategories by the competent authority.‣ dB(A) Leq denotes the time weighted average of the level of sound in decibels onscale "A" which is related to human hearing.“A”, in dB(A), denotes the frequency weighing in the measurement of noise andcorresponds to frequency response characteristics of the human ear.Projects & Development India Limited, Sindri Page 73 of <strong>80</strong>
EIA & RA STUDY FOR NAPHTHA SPLITTER PROJECT AT NUMALIGARH REFINERY LIMITEDBaseline Environmental StatusTABLE - 3.48Noise level inside refinery complex(Industrial Area)Monitoring Period: December, 2007 to February, 2008Time: Hours NS1 NS2 NS3 NS4 NS5 NS66.00 <strong>59</strong>.1 58.3 55.7 55.9 57.7 58.87.00 60.2 <strong>59</strong>.4 56.8 57.0 58.8 <strong>59</strong>.98.00 64.3 61.7 <strong>59</strong>.1 <strong>59</strong>.3 61.1 62.29.00 65.8 63.1 <strong>59</strong>.8 60.0 62.5 61.810.00 66.7 64.0 60.8 61.1 63.4 62.711.00 64.2 64.1 61.7 62.0 63.5 62.812.00 64.3 63.4 61.8 62.1 62.8 62.913.00 67.0 64.3 62.7 63.0 63.7 63.814.00 68.1 65.4 63.8 64.1 64.8 64.915.00 67.2 66.3 65.5 65.8 65.7 65.816.00 70.0 67.3 66.5 66.8 66.7 67.917.00 69.0 66.3 65.5 65.8 65.7 66.918.00 66.1 65.2 64.4 64.7 64.6 65.819.00 63.9 64.3 63.5 63.8 63.7 63.820.00 <strong>59</strong>.5 62.9 60.5 60.8 62.3 62.421.00 55.1 61.5 58.6 58.4 60.9 61.022.00 54.1 60.5 57.6 57.4 <strong>59</strong>.9 60.023.00 52.1 <strong>59</strong>.6 56.7 56.5 <strong>59</strong>.0 <strong>59</strong>.124.00 51.2 58.7 55.8 55.6 58.1 58.21.00 50.1 57.6 55.5 55.3 57.0 57.12.00 49.1 56.6 54.5 54.3 56.0 56.13.00 48.8 56.3 54.2 54.0 55.7 55.84.00 48.1 55.6 53.5 53.3 55.0 55.15.00 46.8 54.3 53.0 52.8 53.7 53.824 hrs. Average <strong>59</strong>.6 61.5 <strong>59</strong>.5 <strong>59</strong>.6 60.9 61.2Day (Max.) 70.0 67.3 66.5 66.8 66.7 67.9Day (Min.) 54.1 58.3 55.7 55.9 57.7 58.8Night (Max.) <strong>59</strong>.1 60.5 57.6 57.4 <strong>59</strong>.9 60.0Night (Min.) 46.8 54.3 53 52.8 53.7 53.8Projects & Development India Limited, Sindri Page 74 of <strong>80</strong>
EIA & RA STUDY FOR NAPHTHA SPLITTER PROJECT AT NUMALIGARH REFINERY LIMITEDBaseline Environmental StatusTABLE - 3.49Ambient Noise Level in the Villages around Refinery(Residential Area)Monitoring Period: December, 2007 to February, 2008Time: Hours NS7 NS8 NS9 NS10 NS11 NS126.00 43.3 45.3 45.0 45.0 40.9 44.57.00 44.4 46.4 43.8 43.4 41.7 45.48.00 46.7 48.7 45.3 48.2 41.1 46.99.00 48.1 49.4 43.6 51.7 41.2 49.310.00 49.0 50.4 44.6 52.9 41.8 50.011.00 49.1 50.5 44.4 50.5 45.1 49.812.00 48.4 50.6 45.6 44.7 46.1 50.813.00 49.3 51.5 45.1 45.3 42.5 51.414.00 50.4 52.6 47.2 46.0 43.3 52.515.00 51.3 53.5 45.6 46.0 44.7 53.616.00 52.3 54.5 44.3 47.4 48.5 52.717.00 51.3 53.5 44.0 47.3 43.5 51.518.00 50.2 52.4 43.5 47.0 40.5 50.319.00 49.3 51.5 42.7 44.7 40.4 48.520.00 47.9 50.1 41.5 42.8 40.0 47.421.00 46.5 48.2 41.0 42.3 39.6 45.322.00 45.5 47.2 40.3 41.9 39.5 47.923.00 44.6 46.3 39.7 40.0 39.1 44.424.00 43.7 45.4 39.0 40.2 39.3 42.31.00 42.6 44.3 39.8 40.4 39.2 41.52.00 41.6 43.3 40.0 43.5 39.4 40.53.00 41.3 43.0 40.1 40.4 39.3 41.04.00 40.6 42.3 40.4 40.7 39.8 39.85.00 39.3 41.0 40.5 40.8 39.9 38.424 hrs. Average 46.5 48.4 42.8 44.7 41.5 46.9Day (Max.) 52.3 54.5 47.2 52.9 48.5 53.6Day (Min.) 43.3 45.3 40.3 41.9 39.5 44.5Night (Max.) 45.5 47.2 45.0 45.0 40.9 47.9Night (Min.) 39.3 41.0 39.0 40.0 39.1 38.4Projects & Development India Limited, Sindri Page 75 of <strong>80</strong>
EIA & RA STUDY FOR NAPHTHA SPLITTER PROJECT AT NUMALIGARH REFINERY LIMITEDBaseline Environmental StatusPLATE - 3.9MAP SHOWING LOCATION OF NOISE MONITORING STATIONSProjects & Development India Limited, Sindri Page 76 of <strong>80</strong>
EIA & RA STUDY FOR NAPHTHA SPLITTER PROJECT AT NUMALIGARH REFINERY LIMITEDBaseline Environmental Status3.10 SOLID & HAZARDOUS WASTESIn a broader sense, the solid wastes being generated from the refinery from varioussources can be classified as:a) Solid wastes generated in the process units and from other sources as a result ofmaintenance and operation activities, replacement of plant machinery etc., and otheractivities within the refinery premises.b) Solid wastes generated as a part of ETP operationsc) Solid wastes generated as a part of project activities.Solid and hazardous waste generated from processing plant and effluent treatment plantat Numaligarh Refinery Limited are as follows:• Oily Sludge• Chemical Sludge• Biological Sludge• Spent Catalyst• Tank bottom sludge• Miscellaneous wastes such as spent resins spent adsorbent, spent activated alumina,spent activated carbon and silica gel.3.10.1 Sludge GenerationThe different types of sludge generated at NRL may be summarized as under:Oily Sludge: The oily waste water is treated in API Separator and TPI Unit for recovery ofoil. After recovery of the oil, sludge is sent to the thickner and finally to the centrifuge fordewatering. The residue is stored in collection chamber.Chemical Sludge : Marginal quanity of chemical sludge is generated as sediments of sourwater tank and amine tank of SRU as oxidized amine residue. Chemical sludge resultsfrom caustic wash and Merox (Mercaptan Oxidation) treatment for removal of mercaptansand sulphides from lighter products of crude oil. Chemical sludge is also generated fromthe flocculation tanking during mixing of caustic treated effluent with ferric chloride andpolyelectrolytes. In raw water treatment plant, coagulation, flocculation, post-chlordinationalso contribute to chemical sludge generation.Projects & Development India Limited, Sindri Page 77 of <strong>80</strong>
EIA & RA STUDY FOR NAPHTHA SPLITTER PROJECT AT NUMALIGARH REFINERY LIMITEDBaseline Environmental StatusBiological Sludge: The biological sludge is generated during treatment of wastewater inbio-tower. The sludge generated from the process is bio-sludge. It is thickened in thethickner and finally centrifuged for dewatering.Tank Bottom Sludge: The crude oil tank is used to store crude oil. The sediment generatedis called crude oil tank bottom. The tank bottom oily sludge is generated in refinery once in5 to 10 years depeding on type of crude oil stored. The sludge is normally black in colourand viscous. This is generated during cleaning operation of the storage tank. Duringatmospheric distillation of crude oil, reduced crude oil is obtained. The sludge alsoobtained from this process is treated in melting pit to recover oil.3.10.2 Spent CatalystsVarious types of catalysts are used in different units to accelerate the process. Thecatalysts lose their activity due to sintering and over-heating, poisoning or build-up ofsurface deposits. The catalysts when lose their activities are treated as waste. Thegeneration of spent catalyst is not regular. Generally, it is replaced once in two to fiveyears. Details of catalysts used in various process units may be summarized as under:Table-3.50Details of CatalystsSl. No. Name of Unit Catalyst Life(Years)01. Hydrogen02. Hydrocraking03. Motor SpiritRegeneration(Yrs)Hydro-treating (Co-Mo based) 3 NAHydro-treating (ZnO based) 1 NAPre-Reformer 2 NAReformer 4 NAModerae temperature Catalyst 2 NALow temperature Catalyst 2 NAPressure Swing Absorber 5 NARB-1 4 2RB-2 4 2RB-3 6 3Naphtha hydrotreating catalyst 8 2Catalystic reforming catalyst 8 2Hydrogeneration 9 3Sulfur guard adsorbent 2 NAChloride guard adsorbent 3 NADryer adsorbent 2 NAIsomerization catalyst 9 3Claus catalyst 5 NAProjects & Development India Limited, Sindri Page 78 of <strong>80</strong>
EIA & RA STUDY FOR NAPHTHA SPLITTER PROJECT AT NUMALIGARH REFINERY LIMITEDBaseline Environmental Status3.10.3 Miscellaneous WastesMiscellaneous wastes include spent resins from DM Plant, spent absorbent from hydrogenunit, spent activated carbon, silica gels and sludge from treatment plants and storagetanks.Table-3.51QUANTITY OF SLUDGE/ SOLID WASTE GENERATEDWastes : Quantity (MTPA)Oily & Chemical Sludge : 100-120Tank Bottom Sludge : 20-30Spent Catalyst : 50-603.10.4 Existing Solid Waste Storage and Disposal FacilitiesOily sludge is initially collected in collection chamber. The sludge so collected is thenshifted in closed drums to secured landfill area for its disposal. The bio-sludge is stored insealed drums. A part of the bio-sludge is used in gardens and the remaining sludge isdisposed of in secured landfill area. The spent catalysts are also collected and stored insealed drums. Periodically the catalysts are sold to the CPCB authorized recyclers. Thespent resins are stored in solid waste stock yard.A storage and disposal facility for non-hazardous waste is available at NRL. All the nonhazardouswastes such as spent resin, paper, bags, electrical waste, PVC piping, hoses,rags etc are stored in solid waste disposal yard till its final disposal.3.11 ECOLOGYIn view of the ecological sensitivity of the project region and the need for conservation ofenvironmental quality and bio-diversity of the area, the study of biological environmentbecomes one of the most important aspects for Environmental Impact Assessment (EIA)study. Generally, biological communities are the good indicators of climatic and edaphicfactors. Studies on biological aspects of ecosystems are important in EIA study for safetyof natural flora and fauna. Information on the impact of environmental stress on thecommunity structure serves as an inexpensive and efficient early warning system to checkthe damage to a particular ecosystem. The biological environment includes mainlyterrestrial ecosystem and aquatic ecosystem.Projects & Development India Limited, Sindri Page 79 of <strong>80</strong>
EIA & RA STUDY FOR NAPHTHA SPLITTER PROJECT AT NUMALIGARH REFINERY LIMITEDBaseline Environmental StatusA natural ecosystem is a structural and functional unit of nature. It has components, whichexists in harmony and survives by inter dependence. Ecosystems have self-sustainingability and control the numbers of organisms at any level by cybernetic rules. The effects ofthese are that an ecosystem does not become imbalanced. The middle of the 18 th centurysaw the birth of industrialization, which increased in 19 th century and exploded in 20 thcentury. The resources produced over and sustained for thousands of years wereexploited and squandered for the luxuries of a few section of the population. Anunsustainable exploitation of natural resources promoted un-amiable pollution, so was theinevitable result. Thus, a chain of events of exploitation-consumption-pollution-depletionand further exploitation started.The resources depletion drove aborigine and advises out of their forest dwellings. Alongwith this was an assault on the lifestyle and culture, which has adopted by them forthousands of years. A prosperity and civilized life is the root cause of many of theenvironmental problems of today. The chase of this mirage has allured many people toabandon their traditional ways and join the race for richness.The last straw on the imbalanced ecosystem was laid by unchecked growth in humanpopulation, which may deplete the scare resources. The poor countries are rich inpopulation. Everything there becomes problematic and while solving one problem manynew problems are created.3.11.1 ReconnaissanceThe Numaligarh Refinery is located inecologically sensitive area. It is located on a flatterrain near National Highway No-39. Therefinery and its township as well as thesurrounding area is covered with naturalvegetation, tea gardens, paddy fieldsrepresenting a remote rural area look. Total geographicl area of Golaghat district is about3502 Square Kilometre, out of which about 1035 Square Kilometre which works out as32% of total area, is covered by forest including Reserved Forest, Protected Forest andUnclassified Forest.Projects & Development India Limited, Sindri Page <strong>80</strong> of <strong>80</strong>
![a]ÝĖ^į %XĮ[ýįV - Pollution Control Board, Assam](https://img.yumpu.com/50573985/1/190x245/ayei-xiyiv-pollution-control-board-assam.jpg?quality=85)