Part 6
Part 6
Part 6
Create successful ePaper yourself
Turn your PDF publications into a flip-book with our unique Google optimized e-Paper software.
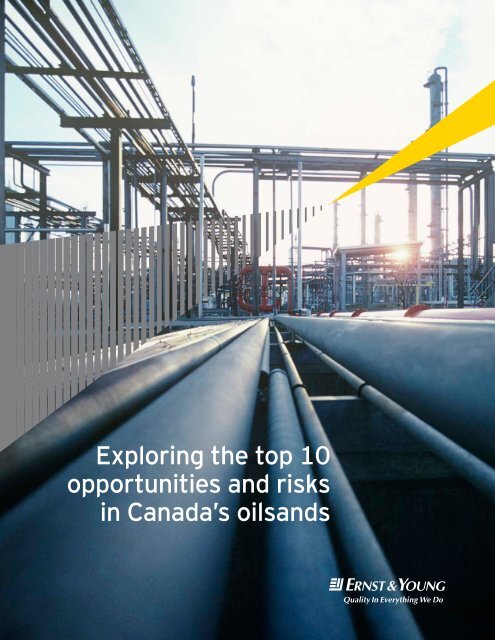
Exploring the top 10opportunities and risksin Canada’s oilsands
Aboutthis reportThis report consists of insight andperspectives from Ernst & Young’s CalgaryOil & Gas team, which has extensiveexperience helping oil and gas companiesin Western Canada achieve their potential.The research is drawn from the team’s ownconversations and experience advisinginternational, national and local oil companies.All monetary figures are in Canadian dollars unless otherwise specified.Key findingsIn this report, our oil and gas team has uncovered a number of wayscompanies can turn today’s challenges and opportunities into results.• One of the top trends we’re seeing today is the rising number of jointventures and partnerships in the industry, which is helpful for oilsands as itallows for sharing of resources, costs and skills.• The industry is investing more in technology, and is collaborating on its useand research.• With the rise of globalization in the economy, it’s becoming more andmore important for Canada’s oil and gas market to break into new marketsaround the world rather than solely relying on the US for trade.• With the rise of concern from stakeholders and the community, and withgovernment regulations, companies are focusing more on ways to curbtheir greenhouse gas emissions.• Due to the perceived negative environmental effects of oil and gasproduction, companies are working on their own public relationsmanagement. It is important for the government to support these effortsby coming up with a federal energy strategy.• In the wake of the global recession and crude price volatility, companiesare taking a fresh look at their strategies and improving their internalbusiness operations.2 Exploring the top 10 opportunities and risks in Canada’s oilsands
The top 10emerging opportunitiesAs Canada’s economy recovers from the global economicrecession, its oil and gas industry is gaining strength at afast pace — entering a boom cycle. During the recession,exploration, development and many capital projects wereput on hold, and now the industry is facing a growing globaldemand for resources — a demand that oil and gas companiesare scrambling to take advantage of. This increasing demandhas been a driving force in Canada’s recovery, and we believe itwill remain so well into the future.Demand for Canada’s oil resourcesis particularly evident in Alberta’sunconventional oil region, which playsan important role in the country’s oiland gas sector. The oilsands hold greatresource potential, and there are agrowing number of projects on the risethat consist heavily of an oil-focusedmix. The region has generated interestfrom foreign (notably Asian) investorsand partners as these countries lookto secure their oil supplies to fuelrapidly expanding populations. Tomany, Canada offers a stable businessenvironment that weathered theeconomic storm well, political stability,strong and transparent regulations,and the development of leading-edgetechnology and expertise in theoilsands.The oilsands sector is evolving quickly.Risk continues to dominate thebusiness agenda, but competition ina global marketplace is becoming adominant feature. Market volatility,pricing pressure, variations inmarket performance and demandingstakeholders have all contributed to aneconomy that encourages competitivedrive. And with that drive comesopportunity. After taking into accountthe many lessons learned from therecession, and the boom period from2005 to 2008, oilsands companies arebetter equipped to succeed today thanever before.The following are the top 10opportunities we see emerging inthe industry.4 Exploring the top 10 opportunities and risks in Canada’s oilsands
Global demand is growingThe demand for oil around the world remains crucial to the viability of oilsandsas a resource. The International Energy Agency forecasts continued growthand demand for fossil fuels of 36% between 2008 and 2035, with 36% of theincrease coming from China. The US is also an important customer of Canadianoilsands production, accounting for approximately 22% of the world’s oil andgas consumption. The agency also predicts that coal, oil and natural gas willremain prominent sources of energy into 2035, and that Canadian oilsands and1Venezuela heavy oil will dominate production mix in the future globally.2The oilsands are economically important to CanadaCanada’s oilsands play a significant contributing role in the oil and gas industry,and in giving Canada a global competitive edge. Canada’s current oilsandsproduction is disproportionate relative to its large reserves base owing to highcapital costs, restrictive regulatory requirements and the long lead times neededto bring oilsands production online.Exploring the top 10 opportunities and risks in Canada’s oilsands5
Here are some key numbers fromthe government of Alberta thathighlight how the oil and gas industrycontributes to the Canadian economy.•• The economic impact to Canadagenerated from the oil and gassector is $1.7 trillion per year(GDP); 90% of this comesfrom Alberta.•• Reserves base — Canada has ahuge resource base of oilsandsreserves comparable on a worldscale to countries like SaudiArabia and Venezuela.Another measure of government share or revenue from the development of the oilsands is to measure the direct and indirect revenues. This involves measuring thedirect royalty and taxes paid, as well as the taxes paid by those supplying goodsand services to the oilsands projects and paid by their employees. A CanadianEnergy Research Institute (CERI) study, titled The Economic Impact of Alberta’s OilSands, October 2005, quantified the measure of government revenue over the 20year period from 2000 to 2020 and found Canada’s governments in aggregatedcollected $123 billion, which was divided up as follows:Government revenue from oilsands 2000–2020$ in billions12010080604020$123 billion by jurisdiction14% – Municipalities9% – Provinces other than Alberta36% – Alberta government41% – Federal government0Source: CERI — Economic Impacts of Alberta’s Oilsands, Oct. 2005World oil reservesAccessible oil reservesState ownedor controlled78%Accessible52%Canada’soilsands30026048%Other accessiblereserves250211Billion barrels200150100175137Includes 170 billion barrelsof oilsands reserves115 102925060463730 25 20 190Saudi ArabiaVenezuelaCanadaIranIraqKuwaitAbu DhabiRussiaLibyaNigeriaKazakhstanQatarChinaUnited StatesSource: Oil & Gas Journal, December 20106 Exploring the top 10 opportunities and risks in Canada’s oilsands
3Oilsands are playing a more prominentrole in the oil production mixSupported by several oilsands assets in either operations or construction, andfuture growth plans both in-situ (drillable) and mining related, production isexpected to grow through 2025, according to the Canadian Association ofPetroleum Producers (CAPP).Production growth mainly fuelled by oilsands is expected to strengthen theenergy relationship between the US and Canada. In fact, CAPP expects oilsandsproduction to grow from 1.3 million barrels/day in 2009 to 2.2 million barrels/day by 2015 and 3.5 million barrels/day in 2025.Canadian oilsands and conventionaloil production forecast (2011–25)5ActualForecast4Atlantic CanadaMillion barrels/day321In-situMiningConventional heavyPentanes/condensate Conventional light02005 2007 2009 2011 2013 2015 2017 2019 2021 2023 2025Source: Canadian Association of Petroleum ProducersExploring the top 10 opportunities and risks in Canada’s oilsands7
4Canada is an attractive place to do businessLooking at the major global projects against the economics and political risk inCanada indicates SAGD oilsands and mining oilsands projects compare well on aglobal scale. Canada provides a politically stable economy and has a strong legal andbusiness system in which to operate. Canada’s vast oilsands reserves and proximity tothe US make it an ideal market for wealthy international and national oil companies.Major oil and gas projects evaluated by size and political riskTypical well economics (after-tax return rate)60%50%40%30%20%10%0%Australia LNGLowSAGD oilsandsHebronDeepwater GOMMining oilsandsPolitical riskGOM: Gulf of MexicoLNG: liquefied natural gasSAGD: steam-assistedgravity drainageTupi oil fieldPapua New Guinea LNGLibya redevelopmentIraq redevelopmentHighSource: Company reports and CIBC World Markets Inc.Asian investmentin Canada topped$10.9 billionin 2010.While Norway, France, the US and other international countries are heavy investorsin Canada’s oilsands resource plays, Asian countries are showing a significantinterest. In fact, the number of inbound oilsands-focused transactions from Asiatripled in 2010, as resource demand from China, Japan, Thailand and South Koreacontinues to grow. According to DBRS Limited, a globally recognized provider ofcredit rating opinions, consumption by non-Organisation for Economic Co-operationand Development countries grew by 12.5 million barrels/day from 2000 to 2010as a result of rapid industrialization and economic development. In particular,China’s consumption growth averaged 6.6% per year since 2000, and it’s expectedto remain as robust going forward. Demand is growing as many Asian countriesare actively seeking to secure natural resources around the world to support theirpopulation growth.Asia–Pacific has experienced significant growth with imports increasing by morethan 30% over the decade, according to DBRS. This growth has primarily been ledby China and India, whose imports increased 23% and 65%, respectively.Some examples of Asian investments and partnerships in Canada’s oilsandsinclude the following:••July 2011: CNOOC announced a $2.1 billion deal to acquire OPTI Canada.••June 2011: Petronas announced a joint venture with Progress Energyfor $1.07 billion.••January 2011: China’s Sinopec Corp. is one of the investors in its proposed$5.5 billion Northern Gateway pipeline with Enbridge.••November 2010: Statoil Canada entered a US$2.28 billion joint venture withThailand’s PTT Exploration and Production Public Company Limited.••May 2010: China’s main sovereign wealth fund entered into a partnership withPenn West Energy Trust to develop oilsands assets.••April 2010: Sinopec purchased a 9% stake in Syncrude Canada Ltd.••February 2010: State-run PetroChina Company Limited closed its agreementto purchase a majority stake in Athabasca Oilsands Corp. It paid $1.9 billion for a60% working interest in Athabasca’s MacKay and Dover assets.••April 2005: CNOOC Limited acquired a 16.7% stake in MEG Energy Corp.8 Exploring the top 10 opportunities and risks in Canada’s oilsands
5Increased crude prices expectedThe West Texas Intermediate (WTI) and Brent exchanges continue to showevidence that the market is uncertain over oil and gas prices. The current forwardstrip certainly appears to support oilsands, but it also makes it difficult for thosecompanies to plan and forecast accurately — especially recently with significantprice volatility caused by the S&P downgrade of the US credit rating.Forecasts reflect increased optimism over crude pricing, with most analystsexpecting levels to stay above $80 per barrel in the long term. Higher crudeprices are favourable for oilsands production as previous uneconomic assets andcostly projects suddenly become possible. The risk comes in when oil prices dropbelow the costs of extracting oilsands, which is more expensive to produce thanconventional oil production methods.Companies with deep pockets and low cost of capital can be expected to handlethe lower crude prices and take advantage of potential short-term lower materialand labour costs.West Texas Intermediate forecasted pricesAs of 30 June 2011140130(US$/bbl)120110100908020112012201320142015201620172018201920202021202220232024High forecast Investment banks Reserve engineers Low forecastSource: Ernst & Young LLP6The US as a key customer is evolvingThe US continues to be a very important customer of Canada’s crude oil production.Canada is the world’s sixth-largest crude oil producer, providing 21% of USimports. Canada has been able to double production since 1980, and its share ofUS imports compared to Saudi Arabia, Venezuela and Mexico is expected to increase.Most Americans strongly value Canada’s role as a secure, stable and friendlysupplier of oil to meet the needs of US families and businesses, according to a pollconducted by Harris Interactive for CAPP and the American Petroleum Institute.“Americans naturally want to reduce dependency on imported oil, but to theextent that the US continues to rely on supply from other countries, Canada isvery well regarded,” said Dave Collyer, President of CAPP. “Among Americans,Canada is seen as a friend and ally, with positive environmental values and acommitment to democracy, social justice and human rights.”Exploring the top 10 opportunities and risks in Canada’s oilsands9
However, reliance on the US is not without its challenges. US dependence onimported oil fell below 50% in 2010 for the first time in more than a decade —thanks in part to the weak economy and more fuel-efficient vehicles, theUS Department of Energy (DOE) has said. The DOE’s Energy InformationAdministration said it expected the moderating trend in US oil-import dependencyto continue through the next decade due to improvements in energy efficiencyand even higher fuel economy standards. Therefore, Canada needs to focus ondiversifying it’s oil and gas customers by building relationships globally. Suchrelationships are being formed with Asian countries and Canada is opening up manynew opportunities by securing its position in new markets.7Project activity increasing in a controlled wayAt Ernst & Young, we’re seeing renewed project activity in all facets of the oilsandssector. Projects that were shelved over the last few years are now coming back onstream. CAPP sees an increase in 2011 of $2 billion in capital spend in the oil andgas industry compared to 2010. Some examples of this include the Sunrise Project —Husky Energy’s joint venture with BP; Suncor Energy Inc.’s Firebag expansionstages three to six and the second stage of Mackay River; and Cenovus Energy Inc.’soilsands expansion project at Foster Creek and Christina Lake.Compared to the early 2000s, we are noticing some key differences in terms ofproject growth. These include fewer megaprojects with 100,000+ barrels of oil/dayproduction, more cross ownership and collaboration, and smaller average projectsize. Collaboration between companies is helping them better control risk anddeliver faster project results — it’s easier to get a smaller number of skilled resourcesto complete a project, rather than having to manage massive teams.CAPP sees anincrease of$2 billion over2011 in capitalspend in the oiland gas industry.Industry capital spending($ in billions)302520151050Northern CanadaOilsandsWestern CanadaEast Coast offshore23112009$34 billion1.70.2Source: Canadian Association of Petroleum Producers, January 201126 26132010$42 billion2.50.5152011(forecast)$44 billion30.310 Exploring the top 10 opportunities and risks in Canada’s oilsands
In 2010, crude oil pipelinecapacity was 3.3 millionbarrels/day compared to 2.5million barrels/day in 2007.8Infrastructure development continuesCanada has well-established oil and gas production infrastructure that has beenbuilt up over many years. This includes pipelines that supply the US and thepotential to export to Asia, politically stable government, skilled workers who areexperts in oilsands production, respect for contracts and low corruption levels.Future infrastructure development projects like TransCanada’s Keystone XLhave the potential to further support export growth and security of demand forproduction. The tightening of differentials in the past few years has influenced theexpanding pipeline capacity. In 2010, crude oil pipeline capacity was 3.3 millionbarrels/day compared to 2.5 million barrels/day in 2007.Once it’s built, Keystone will initially transport 435,000 barrels/day, andEnbridge’s Northern Gateway will transport 525,000 barrels/day.Canadian and US crude oil pipeline proposalsEnbridge pipelines, AB Clipperand connections to the US MidwestKinder Morgan ExpressKinder Morgan Trans MountainTransCanada KeystoneProposed pipelines to the West CoastExisting/proposed pipelines to PADD IIIExpansion in existing pipelineSource: Canadian Association of Petroleum ProducersExploring the top 10 opportunities and risks in Canada’s oilsands11
9Smaller players create diversificationWe are starting to see signs of a shift in industry emphasis and dynamics in afew areas. First, there are a greater number of SAGD projects moving forwardcompared with new oilsands mining projects. This is partly due to the lower breakevenpoints of SAGD projects (approximately $42/barrel) versus an upgradedmine project, which may require $90/barrel to break even.We’re also noticing that mining projects are more labour intensive, and thereforeface higher cost issues in a tight labour environment. SAGD projects are less labourand capital intensive, more environmentally friendly, easier to manage and seem tohave a better track record of being on time and budget compared to mining.The changing business model has allowed the emergence of smaller players likeMEG Energy and Athabasca Oilsands Corporation, which are focused on SAGDtypeprojects and operations with smaller production, high degree of control andno upgrading capacity. Recently, MEG was ranked the top oilsands producer in theindustry by Oilsands Review, and announced in April 2011 that its first quarterresults had increased based on strong production at Cristina Lake.The lower barriers to entry are helping to build a more diverse Canadian oilsandsindustry with smaller, more nimble players.10The increasing role of technologyTechnology and innovation continue to play an important role in supportingenhanced oil and gas recovery, and in reducing the environmental impact ofproduction. Some examples of innovative technologies being implemented, andthose to watch over the coming years include the following:••Different processes for using solvents together with SAGD production,improving recoveries and reducing greenhouse gas (GHG) emissions. Thesolvent-assisted process co-injects solvents such as butane and propane,reducing the need for large amounts of steam, which decreases the steam-tooilratio.••Technologies to process produced bitumen that remove the heaviest hydrocarboncomponents, facilitating transportation direct to refineries and eliminating theneed for a separate upgrade step.••Wedge wells, which involve drilling incremental horizontal wells between existingwell pairs to harness incremental production.••Toe-to-heel air-injection could help dramatically decrease costs usingcombustion technology and the vertical injection of air, creating a hightemperature that burns the oil and reduces the viscosity of the remaining oil.••The electro-thermal dynamic stripping process (ET-DSP) combines heattransfer mechanisms.– Privately held E-T Energy Ltd. is getting support from Total E&P Canada Ltd.to fund its patented ET-DSP technology for producing heavy oil and bitumenfrom oilsands. Total will provide financial and technical support for field testingas E-T prepares for its proposed 10,000 barrel/day phase one commercialdevelopment at Poplar Creek.“Working with E-T Energy is an excellent opportunity for Total to help advanceinnovative extraction methods that continue to build on the development ofenvironmentally sound practices in Canada’s oilsands,” said Jean-Michel Gires,President and CEO of Total E&P Canada Ltd.12 Exploring the top 10 opportunities and risks in Canada’s oilsands
••Combustion overhead gravity drainage uses combustion instead of steam toheat the reservoir.••Thermal-assisted gravity drainage inserts an electric wire into the well and heatsthe resevoir over a one-year period, avoiding the need for steam.••Non-aqueous extraction technologies that have the potential to eliminate theneed for water and the net for wet tailings ponds.Here are some additional examples of companies that are leveraging newtechnology to enhance in-situ oil recovery.Together with Saltworks Inc. Technologies, Cenovus Energy recently invested$6.3 million in energy and environmental technology, developing efficient ways toconvert saltwater to freshwater through desalinization. The technology removessalt from seawater and underground saline water by harnessing low-temperatureheat. The heat is created by solar energy and waste heat from a power generator,which produces mechanical and electrical energy.Cenovus is also working with General Fusion Inc. to find ways of combininghydrogen atoms that generate energy. The byproducts are considered safefor the environment and don’t emit GHGs.Imperial Oil is piloting new steam flooding techniques for late-life wells in whichit will drill new steam-only injector wells and continue to produce fromexisting wells. The company has also commercialized laser technology, in whichsolvent is added along with steam in mid-life wells, improving both recoveryand GHG intensity levels with no additional steam input. Over about two cycles,recovery is up about 35% compared to a typical cyclic steam stimulation well, andGHG emissions are down approximately 25%.Exploring the top 10 opportunities and risks in Canada’s oilsands13
The top 10 risksWith rapid growth and prosperity in Canada’s oilsands region,the industry is also facing many challenges and risks. Likemany others today, the oil and gas industry as a whole isdealing with changing regulations and compliance, new lawsaround transparency and reporting, environmental and climatechange pressures from the community, government andstakeholders, and price volatility in the market as people arestill uncertain about the state of the global recovery.With the fast pace of change in the economy today, those companies that willsucceed are nimble and can adapt quickly, innovate and come up with new waysto enter emerging markets. With the rise of global demand the industry will needthe support of Canada’s government for continued success and growth in the faceof today’s challeges. The following are the top 10 risks we believe the industry isdealing with today.14 Exploring the top 10 opportunities and risks in Canada’s oilsands
1Cost inflationThe markets in general are starting to see early signs of a cost-inflation issue,which is accentuated in the oilsands due to the higher lifting costs per barrel ofoil equivalent and break-even points. We see multiple factors at play in terms ofdriving costs depending on the oil or gas mix shown in the graph below.Here are some of the challenges companies are facing from a cost perspective:••Fear of making short-term cuts that impair the company’s long-term growth••Governing a company that tells existing operations to cut costs, while projectteams are spending••Difficulty for rapidly growing (and sometimes very large) organizations to knowexactly how to manage costs more effectively••Fear of losing suppliers to a competing project in a seller’s market••The traditional “boom and bust” mindset when companies are forging ahead onlong-term investments••The paradigm that a company can’t be low cost and grow at the same timeCost inflation — key driversOil price volatilityEscalating OPEXProfitabilitySustained low gas pricesCAPEX spendincreasing, which is usuallya sign of cost challengesNew regional playersreducing WCSB demand(Utica shale, United States)Commodity pricesincreasing (e.g., steel)Accelerating use ofalternative energysources (includes gas)Total shareholderreturnGas oversupply (shale)Drilling riguse high, driving dailyservice costs upLifting cost $/BOEof oilsands higher thanconventional sourcesFuture demand sources (NGVs,power generation) uncertainLabour shortages(talent increasing again,driving service costs up)Capital allocationGrowthUncertain global economy/geopolitical influencesNorth Africa and Middle EastOil Gas Trend up, down or stayNegative trend Positive trend No changeWCSB – Western Canadian Sedimentary BasinNGV – Natural gas vehicleSource: Ernst & Young LLPExploring the top 10 opportunities and risks in Canada’s oilsands15
There are a number of trends, statistics and indicators supporting the reasonswe think cost will become an important issue for oilsands companies, includingthe following:A) Operating costs for oilsands went from $19.6/barrel of oil equivalent in 2006to $25.5/barrel of oil equivalent in 2010. Development and operating costs foroilsands remain on the high end of the global scale.The CERI report Canadian Oilsands Supply Costs and Development Projects(2010–44) estimates that capital costs have declined by 3.6%, but operatingcosts have risen by 5.8%. CERI’s supply-cost model assumes a three-yearconstruction period for oilsands projects with construction beginning this year.Over the construction period (2011–14), construction and operating costs areexpected to rise by 19%.B) General and administrative costs are increasing, which is evident in thegraphs below.Operating cost per unit of productionTraditional oil and gas only20Cost ($ per barrel of oil equivilant)15105Operating costsensitivity to varyingrates of cost inflation10%5%2%01990 1995 2000 2005 2010 2015Focus periodForecastSource: Canadian Association of Petroleum Producers, ARC Financial Corp.16 Exploring the top 10 opportunities and risks in Canada’s oilsands
Operating cost per unit of productionOilsands only5040Operating costsensitivity to varyingrates of cost inflation10%5%Cost ($ per BOE)30202%1001990 1995 2000 2005 2010 2015Focus periodForecastSource: Canadian Association of Petroleum Producers, ARC Financial Corp.General and administrative costsTotal industry; per unit of production3.02.5Cost ($ per BOE)2.01.51.00.501990 1995 2000 2006 2010 2016Focus periodForecastSource: Canadian Association of Petroleum Producers, ARC Financial Corp.Exploring the top 10 opportunities and risks in Canada’s oilsands17
C) Labour costs — Alberta was the only province in Canada with increasedemployment in February 2011. According to Statistcs Canada, in June 2011,Alberta, Ontario and Nova Scotia had employment gains of 22,000 — growingby 3.5% between June 2010 and June 2011. At the same time, average hourlywages have continued to increase yearly.Since 2006, Alberta has had the highest average hourly wage rate in Canada.With increasing labour costs and the increasing difficulty of hiring strong talentnow that baby boomers are retiring, oilsands operators will need to be morecreative with their hiring plans, such as considering more talent from othercountries around the world, and ensuring they have strong knowledge transfer,training and integration programs in place to bring new workers up to speed onprocesses as quickly as possible. Operating costs are susceptible to inflation, andlabour and energy input costs are the primary drivers.Hourly wage rates in Alberta26Average hourly wage ($)24222018161412102000 2001 2002 2003 2004 2005 2006 2007 2008 2009 2010Source: Government of Alberta — Employment and ImmigrationAlberta weekly wage earningsMining, quarrying, oil and gas extraction2,200Weekly average earnings ($)2,0001,8001,6001,4001,2001,0002002 2003 2004 2005 2006 2007 2008 2009 2010Focus periodSource: Statistics Canada18 Exploring the top 10 opportunities and risks in Canada’s oilsands
D) Project costs — We continue to see signs of project-cost overruns, partly drivenby higher labour costs, service costs (including drilling) and commodity costs, suchas for steel and other raw materials. For example, the first phase of Imperial OilLtd.’s new Kearl oilsands mine in northern Alberta will now cost $10.9 billion — onethirdmore than the company first estimated at $8 billion. Imperial attributed thecost increase solely to a reconfiguration of the project, but some analysts suspectcosts may increase further as a result of cost inflation.Overall, the per-unit cost of steel, which is the primary material input for oilsandsprojects, is up almost 30% from the 2010 average, but it is still significantly belowthe 2008 high.As crude prices increase, usually steel prices will follow.Oilsands capital cost increasesGlobal, not just local120100Capital cost of 100,000 bbl/day project$3.3 billion $9–10 billionCapital $/bbl/day (upgraded)806040200MillenniumShell/AlbianAurora 2&UE 1*Nexen -OPTILongLakeCNRL -HorizonShellMuskeg&ScotfordPCA/UTSFort HillsProductionstart date20012003 2006 2007 2008 2010 2011* Syncrude includes base plant quality improvements and powerSource: Canadian Association of Petroleum ResourcesThe per-unit cost of steel, whichis the primary material input foroilsands projects, is up almost30% from the 2010 average.Exploring the top 10 opportunities and risks in Canada’s oilsands19
Correlation between steel prices and oil pricesHot-rolled steel imports (US$/short ton)1,5001,4001,300Steel1,200Crude1,0009008007006005004003002001000June 01 June 02 June 03 June 04 June 05 June 06 June 07 June 08 June 09 June 10 June 111501401301201009080706050403020100WTI price (US$/barrel)Current: US$763/short ton2011 YTD avg.US$690/short ton2010 avg. US$597/short ton2009 low US$335/short ton2009 avg. US$453/short ton2008 high US$1,138/short tonCurrent vs. 2008 high:down 33%Current vs. 2009 low:up 128%Current vs. 2010 avg.:up 28%Source: Bloomberg20 Exploring the top 10 opportunities and risks in Canada’s oilsands
E) Drill rig use — The year 2011 is shaping up to be robust in terms of rotary rigcounts compared to 2010 — a sign that there is service activity in the industry,which will most likely drive up service costs at a certain point. The followinggraphs show that there was less drilling activity during the recession in 2008–09,but that activity in 2011 is returning to pre-recession levels. In fact, the PetroleumServices Association of Canada’s revised forecast for 2011 is a total of 13,250wells drilled (rig released) across Canada, representing a 5.7% increase in totalwells drilled compared to last year.The Petroleum ServicesAssociation of Canada’srevised forecast for 2011is a total of 13,250 wellsdrilled (rig released) acrossCanada, representing a 5.7%increase in total wells drilledcompared to last year.Canada rotary rig countTotal active rigs800140Active rigs700600500400300200Rotary rig countCrude oil120100806040Crude oil prices US $/barrel10020091 92 93 94 95 96 97 98 99 00 01 02 03 04 05 06 07 08 09 10 110(January 1991–27 May 2011)Sources: Baker-Hughes, Energy Information Administration (DOE), WTRG EconomicsF) Commodity price volatility — Volatility in the commodity market is beingdriven by uncertainly in the global and local North American economy, especiallyduring times of unsettlement in North Africa and the Middle East. It’s also beingdriven by supply and demand imbalances, the influence of the Organization ofthe Petroleum Exporting Countries, S&P’s downgrade of the US credit rating,and inventory for oil storage and spare oil production capacity. These driversare making it very difficult for oilsands companies to manage their costs.Exploring the top 10 opportunities and risks in Canada’s oilsands21
Skilled labour shortagesUnemployment rates continue to decline in 2011, edging towards 2007–08 levelswhen service costs escalated out of control in the industry. We expect labouravailability will become an issue again, which will drive costs up in the coming year.With the large population of babyboomers retiring in the coming years, many ofthe skilled and qualified experts will be leaving the industry. A perfect demographicstorm is developing in Alberta leading to severe worker shortages for many years tocome. Thomas Lukaszuk, Alberta’s Minister of Employment and Immigration, saidthe province is already starting to see labour shortages in some sectors, and his2government expects to see a shortage of 77,000 workers in the next decade.Canadian unemployment rate9.0Unemploymentrates continue todecline in 2011.Percentage of total work force8.58.07.57.06.56.05.52008 2009 2010 2011Source: Statistics Canada3The need to break into new marketsCurrently, the US is the largest market for Canada’s oilsands. But long term, asthe US begins to look for more energy self-sufficiency and renewable sources ofenergy, it will be important for Canada to consider other sources of demand inAsia and Europe.Being dependent on a single market is a risk as it leaves the country unprepared ifits largest customer turns to a new supplier or is able to use a new product instead.A recent survey by the Asia Pacific Foundation of Canada identifies China as thesecond most important economy for Canada — after the US. In fact, a majority ofCanadians believe that the global influence of China will exceed that of the US in10 years. Asia is leading the global economic recovery, with most Asian economiesbuoyed by strong exports and vigorous domestic demand. And by 2040, China willbe the largest economy in the world.It is for these very reasons that we cannot underestimate the importance of thisregion — the future prosperity of our country may depend on it.In order to supply more product to existing and new customers around the world,the industry will need to develop the proper infrastructure and access to globalmarkets. Here are some of the challenges to consider around future demand:22 Exploring the top 10 opportunities and risks in Canada’s oilsands
In the US••New pipeline capacity is needed from Canada to the US: Suncor Energy Inc.President and CEO Rick George says he believes energy security will be the key tothe US government’s decision to approve the proposed Keystone XL pipeline thatwill carry Canadian crude to the concentration of refineries on the US Gulf Coast. Hesaid the crude that would travel down TransCanada Corp.’s proposed Keystone XLpipeline would displace heavy crudes from Mexico, Venezuela and Saudi Arabia. 1••Large inventories in the US could mean less demand for Canadian crudes:Inventories of WTI, the US crude benchmark, continue to rise in Cushing — thedelivery point of the NYMEX crude oil futures contract. This is pushing downthe price due to lack of transportation options from the region to the largeconcentration of refineries on the US Gulf CoastIn Asia••New pipelines and long-term contracts are needed if Canada wants to exportto Asia: It’s important for Canada to build long-term contracts with Asia in orderto secure future demand. Canada will also need to run crude pipelines to its WestCoast in order to increase its supply to Asia. Although, there is some resistancefrom First Nations around these proposed opportunities because of concernsthat tankers off the coast could harm the habitat.The map below compares the distances for oil tankers to transport their productfrom various ports. Canada’s West Coast is an attractive target for Asian countriesbecause the exporting distance from its West Coast to Asia is shorter than it is fromthe US or the Persian Gulf — which makes it cheaper for transportation.Competitive travel distances for Canadian supplyPrince Rupert/KitimatPersian GulfSouth KoreaChinaJapan•Taiwan••~ 4,500 N miles~ 8,600 N miles~ 1,400 N miles••Los Angeles~ 1,790 N milesSanta CruzSan Jose/La Cruz~ 5,400 N miles~ = approximateN miles = nautical miles•Far East Target markets US West Coast•Source: Enbridge Pipelines1 Source: Reuters and Daily Oilpatch BulletinExploring the top 10 opportunities and risks in Canada’s oilsands23
4CAPP expectsoilsandsproduction togrow from 1.3million barrels/day in 2009to 2.2 millionbarrels/day by2015 and 3.5million barrels/day by 2025.Large upfront capital investmentCAPP expects oilsands production to grow from 1.3 million barrels/day in 2009 to2.2 million barrels/day by 2015 and 3.5 million barrels/day by 2025. The capitalrequired to achieve this production is approximately $100 billion, not includingsustaining capital to maintain operations and production. Many analysts note thatthe annual sustaining capital and maintenance spend in the oilsands is greaterthan the capital for new projects. There are several challenges around capitalinvestment affecting the industry, including the fact that oilsands development isexpensive, especially in mining, where heavy equipment is used, and with in-situhorizontal drilling. Input costs are also high with the great need for water andnatural gas for production.In order to upgrade extracted bitumen and turn it into synthetic crude, companiesare required to use expensive upgraders for processing. Such high costs are thereason some companies, such as Canadian Oilsands Ltd. and MEG Energy arenot building large, integrated projects. Instead they are keeping projects smaller,lowering the execution risk and considering the upgrader at a later point.To help save costs, many oilsands companies extract the bitumen and then ship itto another country, such as the US, for upgrading and refining. But in the longterm,this process isn’t beneficial to Canada as we are exporting much of ourresources for processing rather than retaining the value and associated jobs.The industry is converting US refineries to take Alberta heavy oil. Thesechallenges may require new sources of capital from companies around the world,such as Asian national oil companies.24 Exploring the top 10 opportunities and risks in Canada’s oilsands
5Changing policy and regulationsPolicies and regulations around fiscal, labour, environmental and export issuescan be complex and overwhelming to many companies. It is not always clearto the industry where the federal and provincial government stand on itemsof importance, and the industry does not always have clear performancemanagement metrics and targets. The government needs to set the directionwhile collaborating with industry.Recently, there have been some changes in policy that have fundamental impactson the industry. For example, the government changed its position on incometrusts, which were phased out in January 2011. It introduced a more burdensomefiscal regime under the New Royalty Framework (NRF), and the governmentrestructured the NRF to provide incentives for companies to use new technologies.The Alberta government has created an integrated plan for oilsandsenvironmental monitoring. The plan will be carried out in collaborationbetween provincial, territorial and academic scientists, and includes provisionsfor monitoring air and water quality in the oilsands region. The plan willgive the scientific foundation the government and industry needs to ensureenvironmentally sustainable development of the oilsands resource.6Complexity of tailings pondsCreating and dealing with the politics around tailings ponds, which hold wastewater from oilsands processing methods, remain a challenge for the oil and gasindustry. The public has been concerned over the environmental impact of suchponds. There is also emotive interest involved when wildlife is unable to survive inthese areas, which has become a prominent news feature in the past.The ponds consist of a mixture of water, clay, sands and residual bitumen usedto settle solids and recycle water — 80%+ recycle ratio. Unfortunately, historicallythere hasn’t been a great deal of collaboration within the industry to deal with theenvironmental aspects and concerns, or to return the areas to their natural stateafter the ponds are no longer used.At the same time, we are seeing considerable investment and research going intorecycling and reducing pond size, and sharing this technology between companieswill be key to ensuring the ponds are returned back to normal. Here are some ofthe current technologies:••Consolidated tailings••co2 treatment (Canadian Natural Resource Limited)••Thickeners, paste/dry tailings••Tailings reduction (Suncor Energy Inc.)••Atmospheric fines drying (Shell Canada)••Centrifuge (Syncrude Canada Ltd.)Exploring the top 10 opportunities and risks in Canada’s oilsands25
7Large water requirementsOilsands production requires a considerable amount more water than conventionaloil extraction. This is mainly due to the viscous nature of the bitumen andthe process-intensive steps required to produce synthetic crude. Despite thecomparison to conventional oil, the actual usage needs to be put into context.For mining, the oilsands currently uses only 0.5% of the annual flow of theAthabasca River. In comparison, this is one-third of the amount that the City ofToronto uses. About 80%–90% of the water used by the industry is recycled, andaccording to the Royal Society’s 2010 report, there is no impact on Athabascawater quality or its ecosystem, and no evidence of impact on human health indownstream communities.With in-situ drillable oilsands production, companies use non-potable (saline) fromsub-surface aquifers. About 90%–95% of the water is recycled, and most newprojects are using 100% saline for steam.26 Exploring the top 10 opportunities and risks in Canada’s oilsands
8Greenhouse gas emissionsOne of the major challenges around GHG emissions in oilsands production isthat the targets vary depending on the federal or provincial level. Without clearand aligned targets, it’s difficult for the industry to make improvements. Theother challenge lies in public belief. It is widely thought that oilsands productioncreates more GHGs than other industry, which has a negative impact on Canada’sreputation. For example, it is popular public belief that oilsands production createsmore pollution than coal-fired power stations in North America, but, in actual fact,this is not true and is evident in the map below.We believe this perception could be out there because oilsands production is fairlynew. Managing and refining this perception will be key to profitable future growthand help companies get the social lisence they need to operate.GHG emissions from Canadian and US coal-firedpower plants and oilsands operations, 2007~ 1,400 N MilesLegend150 megatonnes50 megatonnes10 megatonnesUS coal-fired power plantemissions, by state, 2007Canadian coal-fired power plantsemissions, by province, 2007Canadian oilsands and upgraderemissions, by province, 2007Source: Canadian Association of Petroleum ProducersExploring the top 10 opportunities and risks in Canada’s oilsands27Source: Natural Resources Canada
Clearly, oilsands production does produce GHGs, but, in our opinion, much of thepublic’s perception about the level of emissions released is not always based onfact. For example, Canada contributes only 2% of global emissions all together,according to CAPP. Of other emission-producing industries in Canada, theoilsands produces the lowest percentage of GHGs. According to the chart below,this number is 5% of the 2% of global emissions.Global emissionsCanadian emissionsChina21%US 20%OECD Europe15% Non OECD EuropeOther fossil fuelConventional oil andand Eurasia 10%5%gas production32%Service industriesJapan 4%India 5%8%Residential7%Oilsands 5%Canada 2%Australia/New Zealand2%Other 21%Agriculture10%Transportation22%Electricity 16%Manufacturing andheavy industry 15%GHG emissionsfrom oilsands:5% of Canada’sGHG emissionsLess than 1/10,000of global GHG emissionsChart does not equal100% due to roundingSource: Canadian Association of Petroleum ProducersOn average, oilsands GHG emissions are comparable to those produced fromother sources of oil. While increased production in the oilsands is increasing GHGsin absolute terms, the use of new oilsands technology since 1990 has reduced theGHGs produced by 39%. The graph below shows that most emissions are in factgenerated in the consumption stage rather than in production.Common US imported crude oils120g CO 2 e/MJ gasoline100806040200Saudi Arabia98 102 102 102 106 102 104 114 107MexicoIraqVenezuelaNigeriaImportedweighted avg.US GulfcoastCaliforniaheavyOilsands avg.Range of commonUS imported crude oils• On a lifecycle basis, oilsandshave similar GHG emissions toother sources of oil.• Full cycle emissions, or “wells towheels,” is the appropriate measureto use in setting carbon policies.GHG emissions from productionand refiningGHG emissions from gasolineconsumptionSource: Jacobs Consultancy, Life Cycle Assessment Comparison for North America and Imported Crudes, June 200928 Exploring the top 10 opportunities and risks in Canada’s oilsands
9Public relations and perception issuesMany Americans are unsure of how much oil the US imports from Canada,according to a survey by CAPP. About 56% of Americans feel that currently morethan four million barrels/day should come from Canada. The most commonguess by Americans is that Canada provides less than 100,000 of the eightmillion barrels the US imports every day. The reality is that roughly 20 times thatamount, or about two million barrels/day, are imported into the US.With a stronger focus on public relations, companies can better communicate therealities of the industry’s GHG emissions, their effects on Canadian forests andCanada’s important relationship with the US. Increasing transparency and makingthe public more aware of the oilsands and their significant resources are key tocompany and industry success.“As the policymakers debate important questions about our energy security,Americans polled overwhelmingly want the administration to support greateruse of Canada’s abundant resources,” said Jack Gerard, API President and CEO. 11 Source: API NewsroomExploring the top 10 opportunities and risks in Canada’s oilsands29
10Land disturbance and reclamationIn cases in which companies create open-pit mines for bitumen extraction orin-situ, they clear land to build well pads and related facilities in vast boreal forestareas. There are many concerns over the impacts of this development. But afterthey have completed their development and production, oilsands companies arerequired to return the land to its original state.Today, the proportion of reclaimed land in the oilsands regions is smallercompared to the surface area disturbed through surface mining and tailingsponds, which suggests there is a lot of work to be done as the industry is still inthe many stages of reclamation. There are several producers that are addressingthe importance of reclamation, such as ConocoPhillips, which is piloting anaggressive reclamation processes on land used for SAGD production.Oilsands mining footprint and reclamation process500400Square miles300200100Tailings pondsSurface miningReclaimed land0Source: Cambridge Energy Research Associates2008 2020 2040ForecastForecast30 Exploring the top 10 opportunities and risks in Canada’s oilsands
According to the map below, a total of 4,802 square kilometres of land areimpacted by the mining practice, in relation to the total boreal forest area of3.2 million square kilometres.Canadian landscapeCanada’s boreal forest(3,200,000 km 2 )Land covering the oilsands(142,200 km 2 )Land that could be impacted by mining(4,803 km 2 )Land mined over the last40 years (*662 km 2 )11% of land mined has been reclaimed* How big is 662 km 2 ?Area(km 2)InnercityGreatermetropolitan areaSource: Canadian Association of Petroleum ResourcesEdmontonTorontoChicagoOslo6846306064548,4187,12528,1648,900Exploring the top 10 opportunities and risks in Canada’s oilsands31
Turning today’s challengesand opportunities into resultsWith the multitude of complex issues and risks that oilsands companies are facing today, greatopportunities abound. Our Calgary Oil & Gas team believes there are some key focuses that canhelp your organization gain a competitive edge.Deeper industry collaborationJoint ventures and partnershipsOne of the key trends we are noticing in the oil and gas industry today is the risingnumber of joint ventures and partnerships. These are important in developingthe unconventional oilsands reserves because they allow companies to sharerisks, resources, skills and talent, development costs, and they allow for greatercollaboration on various projects.Such partnerships also help to avoid the labour supply crunches we saw in 2007.The availability of skilled trades is of particular importance, as well as avoidingmultiple 100,000+ barrel-type projects occurring concurrently. The recentjoint venture between Suncor Energy and Total, and the merger betweenPetro-Canada and Suncor Energy provide examples of where Suncor now hasgreater influence over several industry capital projects and the sequence atwhich they are developed.In particular, we are seeing more collaboration and partnerships betweenCanada’s companies and those in Asia. And we believe deals such as the StatoilPTT-EP joint venture or SINOPEC’s non-operated interest in Syncrude will becomemore popular in the future.32 Exploring the top 10 opportunities and risks in Canada’s oilsands
But such collaboration doesn’t comewithout challenges. Joint venturesinvolve complex governance issues.Companies need to be transparentabout how they will make decisionsand structure their reporting. Hereare some of the issues your companyneeds to address when setting up sucha partnership:••Process— Ensure there is a clearunderstanding among your people ofhow the project process is structuredand the standard operatingprocedures. All partners need tounderstand the different projectstages, when decisions will be madeand who will make them, who isinvolved in the project and eventually,how the asset will be operated.••Reporting— Inform all partnersabout what data and information willget reported, when and by whom.Reporting needs to be focused ondelivering results and adding value.••Trust— Joint ventures need to bebuilt on a base of trust from the verybeginning. All partners need to trusteach other and share common goalsfor the project.••Organizational structure — In somecases, it may make sense to build asingle organizational chart for thejoint venture to show clear interfacepoints between all the companiesand individual deals involved.••Sharing skills — Ensure that all thoseinvolved have a clear understandingof each other’s skills and how thoseskills from different companies willbe involved, shared and leveraged.•Culture • — There needs to be a “fit”between the companies; for example,can they work together and do theyhave shared values and objectives?Exploring the top 10 opportunities and risks in Canada’s oilsands33
Technology investment and collaborationThe industry’s continued investment in new technology development anddeployment is crucial for success. Areas of focus include:••Water use••Tailings — dry tailings technologyco-operation••Surface impacts••Reclamation••Steam-to-oil ratio reductions in-situ will reduce GHGs••New drilling methods to reduce ground disturbance••Role of research from universities in innovation of technology use••GHG reduction (process and carbon capture and sequestration)••Energy efficiencyCareful long-term management of demandMarket demand diversificationIn order to keep up with global competitive demand, Canada’s oil and gas marketwill need to find ways to break into new markets around the world. Some analystsargue that the US should remain the market of focus, but if US consumerbehaviour and demand trends shift in the future, a more prudent approach is toconsider multiple demand channels.In the meantime, for future exporting, companies must build the requiredinfrastructure, considering how forecasted production of bitumen and crudeproducts will get to the US.34 Exploring the top 10 opportunities and risks in Canada’s oilsands
Manage the environmentReducing greenhouse gas emissionsWith the general negative perception that the oilsands produce a relatively largeamount of GHGs. That’s why a focus on energy efficiency, improved recoveryprocesses and carbon capture and sequestration is important. More broadly,companies will need to continue to develop oilsands responsibly with sufficientmeasures to mitigate environmental issues. A national approach to climatechange policy, which takes into account GHG emissions, is needed.Here are some of the environmental factors companies can focus on toreduce GHGs:Energy efficiency••Using less energy input••Reducing energy waste/losses••Capturing waste heat••Cogeneration power/steamImproved recovery processes••Lower temperature extraction••Additives to reduce use of both water and energy (steam)••Use of electricity rather than steam••Underground combustion rather than steamCarbon capture and sequestration••Most effective at upgradersExploring the top 10 opportunities and risks in Canada’s oilsands industry35
Focused stakeholder managementPublic perceptionA public relations strategy is of growing importance in the industry today to helpcurb the negative perceptions that the public has of oilsands production and GHGemissions. Canada needs to better communicate the facts around this issue tobuild a better reputation. Companies could benefit from a more concerted effortby the industry in close collaboration with CAPP and others to maintain a factbaseddiscussions on oilsands.Federal national energy strategyWith Canada’s reputation as an energy superpower competing on a global stagewith the likes of Saudi Arabia, Iran and Venezuela, the question is, how is Canadagoing to manage it?We believe the industry needs a national framework with clear direction ongrowth (how, when and by how much), environmental regulations and standards,where there are gaps in skills, energy security, and how important oil is for thetotal resource mix for Canada. <strong>Part</strong> of this framework involves infrastructureplanning, involving close collaboration between oilsands companies and theprovincial government. Working in tandem with each other to share knowledgeand experience, there needs to be a focus on reducing pressure on localinfrastructure and on planning so that the government investment is timely andtailored to the needs of the industry.36Exploring the top 10 opportunities and risks in Canada’s oilsands industry
Improve internalbusiness operationsMeasurement and reportingEstablishing common metricsand transparency in performancemonitoring and reporting will beimportant to help establish a baselinefor the industry on which to improveupon. Such metrics are crucial in termsof environmental performance andstewardship, and economic impacts.Operating modelIn today’s new business environments,it’s a good time to evaluate yourcompany’s operating model to seekopportunities for improving yourperformance, including on-siterequirements for people, low-costcountry sourcing, remote operationsand better use of technology. Takea close look at your people strategy,processes and technology operatingmodel components to be sure theyare strong enough to allow you tocompete in today’s competitive andfast-paced market.Cost managementKeeping your costs down is always key,but we expect it to be a growing issuein the coming years based on industryindicators. We recommend that youaddress these cost issues early by:••Taking an enterprise approach to costmanagement (avoid the silos)••Structuring your approach by settingtargets and identifying cost base;conducting analysis and examiningimprovement levers to diagnoseimprovement opportunities;managing implementation ofinitiatives for delivering benefits;and implementing a stabilized costreductionprogram••Looking for sustainableimprovements without makingarbitrary one-off cuts••Viewing cost reduction as a way tocreate cash that will fund strategicgrowth opportunities, ensuring thatyour company emerges stronger andmore efficient••Looking for opportunities toreduce costs while maintainingthe capabilities needed to supportyour business••Assessing the internal capabilities tomeet the cost-reduction targets (Doyou feel like your current initiatives/programs, resources and skills aresufficient to meet those targets?)••Strategically using benchmarks tocompare where your company sitsamong the competition– Seeking opportunities tocollaborate with industry peers tohelp manage costs; for example:– Shared services betweencompanies and not just internally– Sequencing of projects– Collaboration of technology thathas cost impactExploring the top 10 opportunities and risks in Canada’s oilsands37
How we can helpOperating modelWe provide support in implementing and designing an appropriate operatingmodel strategy that aligns with your business. This involves analyzing the strategyand specifications of the criteria for your model assessment, looking at yourcurrent business model before developing and designing the target model andhelping you with your transition plan.Our approach1 2 3 4Objective: Analyze theObjective: Analyzecorporate strategy andObjective: Designcurrent operating modeldetermine criteria fortarget operatingand determine targetalternative operatingmodel blueprintoperating modelmodels assessmentObjective: Developtransition plan• Analyze the corporate strategy.• Shareholder Interviews.• Design an enterprise-level processmap and define a list of key end-toendbusiness processes.• Define key performance indicators.• Determine the operating modelassessment.• Conduct strategic alignmentworkshop.• Assess current operating model.• Perform benchmark analysis withpeer-group.• Draft alternative operating models.• Compare and evaluate thealternative operating modelsagainst the adopted criteria.• Conduct strategic session tobuild consensus over the targetoperating model.• Describe target authorityallocation between head office,branches and subsidiaries.• List business processes andfunctions to be outsourced orshared.• Develop flowcharts and processmanuals for the target key end-toendbusiness processes.• Define key competences within thetarget operating model.• Conduct workshop to buildconsensus over the target operatingmodel blueprint.• Define key activities forthe transition.• Assign responsibility for the keytransition activities.• Define key stakeholders anddevelop communication plan.• Conduct workshop to buildconsensus over transition plan.• Perform training.• Conduct monthly status meetingsduring six-month period afterproject completion.Understand cost Anticipate cost Manage cost38 Exploring the top 10 opportunities and risks in Canada’s oilsands
Enterprise cost reductionOur enterprise cost reduction methodology and approach are underpinnedby an extensive set of tools and accelerators that we use on all comparableengagements. We go beyond theory and analysis to focus on results-orientedexecution to deliver measurable benefits to your business.Our cost-reduction methods1 2 3 45Set targets andManage implementationConduct analysis and examine improvementIDENTIFY addressableof initiatives forlevers to DIAGNOSE improvement opportunitiescost baseDELIVERY of benefitsStabilize cost/reductionprogram and rolloutSUSTAINABLE processUnderstand cost Anticipate cost Manage costPeople and organizational changeOur People and Organizational Change practice is made up of experiencedprofessionals who understand the complexities and risks associated with suchissues. We can help support your plans for change, adoption and sustainability ofbusiness improvements.1. HR transformation – To help you improve your organization’s HR function,our offerings include vision and strategy development; service delivery modeldevelopment and implementation; process re-engineering; business processoutsourcing; and HR information system selection (request for proposal andvendor management).2. Talent and performance management – In times of both boom and bust,retaining your best employees and getting the best performance from them is atop priority — and a challenge. To help you manage your talent and improve theirperformance, our offerings include performance management strategy, plan andimplementation; succession planning and management; role and competencydesign; and leadership development.3. Enabling change – Our team can help you build an effective change managementprogram to help increase the success of your projects and their adoptionexponentially. We can help you develop, set up and execute the following: changestrategies and plans; leadership alignment, development and engagement;change readiness assessments; stakeholder alignment and engagement;communication strategies and plans; and training and development.4. Organizational effectiveness – In order to execute on your strategy andachieve desired returns, your organization needs to build necessary structures,set appropriate talent priorities and align its culture. This can be done throughrestructuring, leadership modifications, a change in strategic direction or abroad-scale transformation.To support you in realizing organizational effectiveness, our offerings includeorganizational development and design; competency development and rolemapping;organizational cultural assessment; workshop design and facilitation;and process improvement and re-engineering.Exploring the top 10 opportunities and risks in Canada’s oilsands39
The Capital AgendaLeading companies are adopting a range of practices across four key areas of thecapital agenda to build competitive advantage. Our Transaction Advisory Servicesteam can to help you make better and more informed decisions about how youstrategically manage capital and transactions in a changing world. Whether you’represerving, optimizing, raising or investing capital, our team can bring the rightskills, insights and experience to your organization.The capital agendaThe diagram below shows some of the ways we can support your capital agenda.•••Stress and distress — e.g., liquidityissues and turnaround plansCustomer and supplier analysisPreserving tax assets andminimizing costsRefinancing or restructuring debt,equity and other obligationsDealing with stakeholderrelationships and pressureDispute resolution•••PreservingThe CapitalAgendaOptimizing••Optimizing asset portfolioDelivery of synergies andeffective integrationImproving working capital andreleaseing cashOptimizing capital structureOptimizing tax and corporatestructure••••Acquisitions and alliancesPlanning and structuringtransactions to optimizestakeholder returnFocused due diligence to mitigate riskand drive valueCost- and tax-efficient structures••InvestingRaising••••••Fundraising (equity and debt)IPO readiness, rights issues, PE,private placement and capitalmarketsOptimizing funding structuresAsset divestmentInfrastructure projectsCost-and tax-efficient structures40 Exploring the top 10 opportunities and risks in Canada’s oilsands
Climate Change andSustainability ServicesWe can work with you to developglobal systems of controls to identify,mitigate and monitor material risksof non-compliance with businessprinciples as it relates to sustainability.This type of work is designed to helpsupport an improvement in contractorperformance in relation to nonfinancialrisk.We provide advice on the implicationsof climate change for your organizationby identifying the potential issues andwhich aspects of your business may beaffected. We can:••Make recommendations on thedevelopment of an effective climatechange strategy and the processesand controls required to implement it••Review the adequacy of climatechange plans and the mechanismsused to track the benefits••Provide guidance on developingcompelling and credible externalcommunications on climate changethat you can rely on••Help prepare your company forregulatory requirementsExploring the top 10 opportunities and risks in Canada’s oilsands industry41
Learn moreTo find out how our Calgary Oil & Gas team can helpyour organization through its journey to growth and highperformance, please visit ey.com/ca/oilandgas or contact:Barry MunroCanadian Oil & Gas Leaderbarry.g.munro@ca.ey.com+1 403 206 5017John McVicarjohn.mcvicar@ca.ey.com+1 403 206 5658Lance Mortlocklance.mortlock@ca.ey.com+1 403 206 5277Greg Pollardgreg.pollard@ca.ey.com+1 403 206 547942 Exploring the top 10 opportunities and risks in Canada’s oilsands industry
Exploring the top 10 opportunities and risks in Canada’s oilsands industry43
Ernst & Young LLPAssurance | Tax | Transactions | AdvisoryAbout Ernst & YoungErnst & Young is a global leader in assurance,tax, transaction and advisory services. Worldwide,our 141,000 people are united by our sharedvalues and an unwavering commitment to quality.We make a difference by helping our people,our clients and our wider communities achievetheir potential.About Ernst & Young’s Global Oil & Gas CenterThe oil and gas industry is constantly changing.Increasing regulatory pressures, price fluctuationsand geopolitical complexities all present significantchallenges. Our Global Oil & Gas Center bringstogether a worldwide team of professionals tohelp you achieve your potential — a team withdeep technical experience providing assurance,tax, transaction and advisory services. The Centerworks to anticipate market trends, identify theimplications and develop points of view on relevantindustry issues. Ultimately, it enables us to helpyou meet your goals and compete more effectively.It’s how Ernst & Young makes a difference.For more information, please visit ey.com/ca.Ernst & Young refers to the global organizationof member firms of Ernst & Young GlobalLimited, each of which is a separate legal entity.Ernst & Young Global Limited, a UK companylimited by guarantee, does not provide servicesto clients.ey.com/ca© 2011 EYGM Limited.All Rights Reserved.EYG No. DW01051106-1270519This publication contains information in summary form, currentas of the date of publication, and is intended for general guidanceonly. It should not be regarded as comprehensive or a substitute forprofessional advice. Before taking any particular course of action,contact Ernst & Young or another professional advisor to discussthese matters in the context of your particular circumstances. Weaccept no responsibility for any loss or damage occasioned by yourreliance on information contained in this publication.


