Voice activity detection in nonstationary noise - Speech and ... - SIPL
Voice activity detection in nonstationary noise - Speech and ... - SIPL
Voice activity detection in nonstationary noise - Speech and ... - SIPL

You also want an ePaper? Increase the reach of your titles
YUMPU automatically turns print PDFs into web optimized ePapers that Google loves.
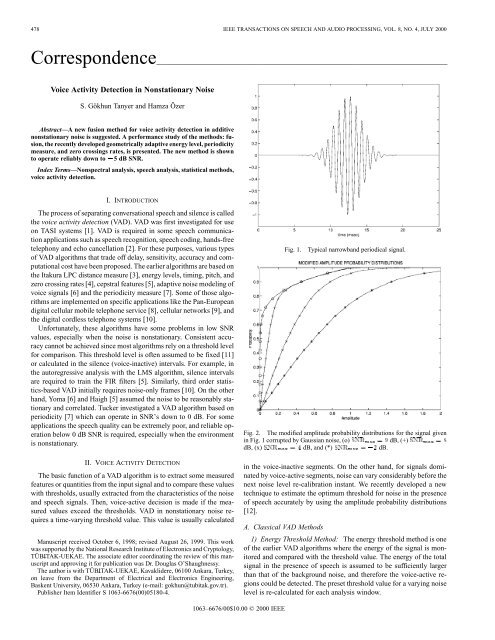
478 IEEE TRANSACTIONS ON SPEECH AND AUDIO PROCESSING, VOL. 8, NO. 4, JULY 2000Correspondence________________________________________________________________________<strong>Voice</strong> Activity Detection <strong>in</strong> Nonstationary NoiseS. Gökhun Tanyer <strong>and</strong> Hamza ÖzerAbstract—A new fusion method for voice <strong>activity</strong> <strong>detection</strong> <strong>in</strong> additive<strong>nonstationary</strong> <strong>noise</strong> is suggested. A performance study of the methods: fusion,the recently developed geometrically adaptive energy level, periodicitymeasure, <strong>and</strong> zero cross<strong>in</strong>gs rates, is presented. The new method is shownto operate reliably down to 5 dB SNR.Index Terms—Nonspectral analysis, speech analysis, statistical methods,voice <strong>activity</strong> <strong>detection</strong>.I. INTRODUCTIONThe process of separat<strong>in</strong>g conversational speech <strong>and</strong> silence is calledthe voice <strong>activity</strong> <strong>detection</strong> (VAD). VAD was first <strong>in</strong>vestigated for useon TASI systems [1]. VAD is required <strong>in</strong> some speech communicationapplications such as speech recognition, speech cod<strong>in</strong>g, h<strong>and</strong>s-freetelephony <strong>and</strong> echo cancellation [2]. For these purposes, various typesof VAD algorithms that trade off delay, sensitivity, accuracy <strong>and</strong> computationalcost have been proposed. The earlier algorithms are based onthe Itakura LPC distance measure [3], energy levels, tim<strong>in</strong>g, pitch, <strong>and</strong>zero cross<strong>in</strong>g rates [4], cepstral features [5], adaptive <strong>noise</strong> model<strong>in</strong>g ofvoice signals [6] <strong>and</strong> the periodicity measure [7]. Some of those algorithmsare implemented on specific applications like the Pan-Europe<strong>and</strong>igital cellular mobile telephone service [8], cellular networks [9], <strong>and</strong>the digital cordless telephone systems [10].Unfortunately, these algorithms have some problems <strong>in</strong> low SNRvalues, especially when the <strong>noise</strong> is <strong>nonstationary</strong>. Consistent accuracycannot be achieved s<strong>in</strong>ce most algorithms rely on a threshold levelfor comparison. This threshold level is often assumed to be fixed [11]or calculated <strong>in</strong> the silence (voice-<strong>in</strong>active) <strong>in</strong>tervals. For example, <strong>in</strong>the autoregressive analysis with the LMS algorithm, silence <strong>in</strong>tervalsare required to tra<strong>in</strong> the FIR filters [5]. Similarly, third order statistics-basedVAD <strong>in</strong>itially requires <strong>noise</strong>-only frames [10]. On the otherh<strong>and</strong>, Yoma [6] <strong>and</strong> Haigh [5] assumed the <strong>noise</strong> to be reasonably stationary<strong>and</strong> correlated. Tucker <strong>in</strong>vestigated a VAD algorithm based onperiodicity [7] which can operate <strong>in</strong> SNR’s down to 0 dB. For someapplications the speech quality can be extremely poor, <strong>and</strong> reliable operationbelow 0 dB SNR is required, especially when the environmentis <strong>nonstationary</strong>.II. VOICE ACTIVITY DETECTIONThe basic function of a VAD algorithm is to extract some measuredfeatures or quantities from the <strong>in</strong>put signal <strong>and</strong> to compare these valueswith thresholds, usually extracted from the characteristics of the <strong>noise</strong><strong>and</strong> speech signals. Then, voice-active decision is made if the measuredvalues exceed the thresholds. VAD <strong>in</strong> <strong>nonstationary</strong> <strong>noise</strong> requiresa time-vary<strong>in</strong>g threshold value. This value is usually calculatedManuscript received October 6, 1998; revised August 26, 1999. This workwas supported by the National Research Institute of Electronics <strong>and</strong> Cryptology,TÜB_ITAK-UEKAE. The associate editor coord<strong>in</strong>at<strong>in</strong>g the review of this manuscript<strong>and</strong> approv<strong>in</strong>g it for publication was Dr. Douglas O’Shaughnessy.The author is with TÜB_ITAK-UEKAE, Kavaklidere, 06100 Ankara, Turkey,on leave from the Department of Electrical <strong>and</strong> Electronics Eng<strong>in</strong>eer<strong>in</strong>g,Baskent University, 06530 Ankara, Turkey (e-mail: gokhun@tubitak.gov.tr).Publisher Item Identifier S 1063-6676(00)05180-4.Fig. 1.Typical narrowb<strong>and</strong> periodical signal.Fig. 2. The modified amplitude probability distributions for the signal given<strong>in</strong> Fig. 1 corrupted by Gaussian <strong>noise</strong>, (o) SNR =9dB, (+) SNR =8dB, (x) SNR =4dB, <strong>and</strong> (*) SNR = 02 dB.<strong>in</strong> the voice-<strong>in</strong>active segments. On the other h<strong>and</strong>, for signals dom<strong>in</strong>atedby voice-active segments, <strong>noise</strong> can vary considerably before thenext <strong>noise</strong> level re-calibration <strong>in</strong>stant. We recently developed a newtechnique to estimate the optimum threshold for <strong>noise</strong> <strong>in</strong> the presenceof speech accurately by us<strong>in</strong>g the amplitude probability distributions[12].A. Classical VAD Methods1) Energy Threshold Method: The energy threshold method is oneof the earlier VAD algorithms where the energy of the signal is monitored<strong>and</strong> compared with the threshold value. The energy of the totalsignal <strong>in</strong> the presence of speech is assumed to be sufficiently largerthan that of the background <strong>noise</strong>, <strong>and</strong> therefore the voice-active regionscould be detected. The preset threshold value for a vary<strong>in</strong>g <strong>noise</strong>level is re-calculated for each analysis w<strong>in</strong>dow.1063–6676/00$10.00 © 2000 IEEE
IEEE TRANSACTIONS ON SPEECH AND AUDIO PROCESSING, VOL. 8, NO. 4, JULY 2000 479Fig. 3. Amplitude probability distribution graph <strong>and</strong> the geometrical techniqueto calculate the <strong>noise</strong> level.Fig. 5. The percentages of the (correctly detected-false triggered) samplescorrespond<strong>in</strong>g to different algorithms as a function of the SNR.B. Recently Developed Geometrically Adaptive Energy ThresholdMethodFig. 4. <strong>Voice</strong> <strong>activity</strong> <strong>detection</strong> us<strong>in</strong>g the fusion of the LSPE (left side) <strong>and</strong> thegeometrically adaptive energy threshold (right side) method.2) Zero Cross<strong>in</strong>gs Rate Method: In this method, the zero cross<strong>in</strong>gsrate for each analysis w<strong>in</strong>dow is calculated <strong>and</strong> compared withthe preset threshold value [4]. The zero cross<strong>in</strong>gs rate of <strong>noise</strong> is assumedto be considerably larger than that of the speech signal. Thisassumption is accurate at high SNR values. However, it has problemsat low SNR’s, especially <strong>in</strong> the presence of periodic <strong>noise</strong> <strong>and</strong> speechwith high zero cross<strong>in</strong>g rates.3) Least-Square Periodicity Estimator (LSPE) Method: Irw<strong>in</strong> <strong>in</strong>vestigatedthe optimum method for measur<strong>in</strong>g the periodicity of speechcorrupted by <strong>noise</strong> [13]. Tucker [7] designed a VAD based on periodicity.The major difficulty <strong>in</strong> design<strong>in</strong>g a VAD based on periodicity isits sensitivity to any periodic signal which may well be <strong>in</strong>terference ora background signal. Great care must be taken to avoid false trigger<strong>in</strong>gon nonspeech periodic signals. If the speech signal conta<strong>in</strong>s nonperiodiccomponents, <strong>in</strong>accurate values for endpo<strong>in</strong>ts of the voice-activesegments can be obta<strong>in</strong>ed. Tucker used a preprocessor to detect <strong>and</strong> ifpossible remove, most of the expected types of <strong>in</strong>terference. Differentenvironments will have different <strong>in</strong>terference, so the exact nature of thepreprocessor will depend on the expected type of <strong>in</strong>terference.In the classical energy threshold method, the threshold value isre-calculated at each voice-<strong>in</strong>active segment. When the <strong>noise</strong> groundis <strong>nonstationary</strong>, the algorithm often can not track the threshold valueaccurately, especially when speech signal is mostly voice-active<strong>and</strong> the <strong>noise</strong> level changes considerably before the next <strong>noise</strong> levelre-calibration <strong>in</strong>stant. The geometrically adaptive energy threshold(GAET) method [12] is developed to set the threshold level adaptivelywithout the need of voice-<strong>in</strong>active segments by us<strong>in</strong>g the amplitudeprobability distributions of the speech signal.1) Amplitude Probability Distributions: The amplitude probabilitydistribution (APD) is one of the most useful tools for statistical analysisof <strong>noise</strong> <strong>in</strong> communications. Theoretical <strong>and</strong> experimental studies ofAPD’s of <strong>noise</strong> have been performed for the past 30 years or more[14]. In 1971, Spauld<strong>in</strong>g [15] studied the overall environmental <strong>noise</strong>as well as <strong>noise</strong> due to specific sources. Later, <strong>in</strong> 1974 he performed<strong>noise</strong> measurements <strong>in</strong> parks <strong>and</strong> university campuses where there areless vehicular traffic, electrical equipments <strong>and</strong> other types of <strong>noise</strong>source. Graphical algorithms are developed to predict the APD’s as afunction of frequency, time <strong>and</strong> b<strong>and</strong>width of a receiver [16].To briefly summarize the basics, let us assume that the total signalcan be written <strong>in</strong> the forms(t)=c(t)+n(t) (1)where c(t) <strong>and</strong> n(t) are the clear speech <strong>and</strong> <strong>noise</strong> signals, respectively.The amplitude probability distribution (APD) function Fs(s) <strong>and</strong> the
480 IEEE TRANSACTIONS ON SPEECH AND AUDIO PROCESSING, VOL. 8, NO. 4, JULY 2000Fig. 6.The clear speech signal (words from 1 to 8 uttered <strong>in</strong> Turkish: bir, i-ki, üç, dört, bes, al-tı, ye-di, <strong>and</strong> se-kiz versus the sample number <strong>and</strong> the detectedvoice-active regions, from top to bottom (a) the clear speech signal, (b) the zero cross<strong>in</strong>gs rates method, (c) the geometrically adaptive energy threshold (GAET)method, (d) the least-Square periodicity estimator (LSPE) method, <strong>and</strong> (e) the fusion of (c) <strong>and</strong> (d), (05 SNR 10 dB).TABLE IAVERAGE PERCENTAGES OF THECORRECTLY DETECTED-FALSE TRIGGERRED) SAMPLES. (THE AVERAGE ISCALCULATED THROUGHOUT THE SIGNAL USED IN Fig. 6).Note that the sampl<strong>in</strong>g rate does not need to obey the Nyquist criteria<strong>and</strong> N is assumed to be sufficiently large. The APD, F s [m], <strong>and</strong> apd,f s[m] of discrete time r<strong>and</strong>om variable s[k] can be def<strong>in</strong>ed asmF s[m] = f s[i] (5)i=0<strong>and</strong> where f s [i] is the number of samples of s[k] satisfy<strong>in</strong>gi1s js[k]j < (i + 1)1s (6)amplitude probability density (apd) function f s(s) of a cont<strong>in</strong>uous timer<strong>and</strong>om variable s(t) are related bysF s (s) =01 f s() d =0 f s() d: (2)Let us denote the elements of the stochastic process on discrete timesignal by s[k] which are the (N +1)samples of s(t) at t = k1t <strong>in</strong>the analysis w<strong>in</strong>dow (T1 t T2); i.e.,for k =0; 1; ...;N <strong>and</strong> wheress[k] =s(T1 + k1t) (3)1t =(T2 0 T1): (4)Nnormalized by the total number of samples N , <strong>and</strong> where 1s is theresolution parameter. Note that for 1t ! 0; 1s ! 0; (T1 !01);(T2 ! 1) <strong>and</strong> (N ! 1); F s [m] <strong>and</strong> f s [m] converge to F s (s)<strong>and</strong> f s (s), respectively. If the APD of the signal <strong>and</strong> <strong>noise</strong>, F s (s) <strong>and</strong>F n(n), are different then, F s[m] <strong>and</strong> F n[m] are expected to be different.For a corrupted signal, the signal <strong>and</strong> <strong>noise</strong> will partially occupydifferent regions on the APD.2) Modified Amplitude Probability Distribution (MAPD) Function:In this work, the modified amplitude distribution (MAPD)function R s [m] is def<strong>in</strong>ed. It can implicitly be obta<strong>in</strong>ed by sett<strong>in</strong>gthe x <strong>and</strong> y-axis by y = k=N <strong>and</strong> x = sort(s[k]) respectively wheresort<strong>in</strong>g is done <strong>in</strong> ascend<strong>in</strong>g order, <strong>and</strong> any sort<strong>in</strong>g algorithm canbe used [12]. A narrowb<strong>and</strong> signal shown <strong>in</strong> Fig. 1 is corrupted byGaussian <strong>noise</strong>, <strong>and</strong> the correspond<strong>in</strong>g MAPD functions for variousSNR’s are given <strong>in</strong> Fig. 2. It can be shown that R s [m] is equivalent toF s[m] <strong>and</strong> is numerically more accurate (more resemblance to F s(t)).It requires comparatively few data po<strong>in</strong>ts (samples). From now on,
IEEE TRANSACTIONS ON SPEECH AND AUDIO PROCESSING, VOL. 8, NO. 4, JULY 2000 481Fig. 7. <strong>Voice</strong> <strong>activity</strong> <strong>detection</strong> results for the corrupted speech signal where words from 1 to 9 uttered <strong>in</strong> Turkish: bir, i-ki, üç, dört, bes, al-tı, ye-di, se-kiz, <strong>and</strong>do-kuz, from top to bottom (a) the zero cross<strong>in</strong>gs rates method, (b) the geometrically adaptive energy threshold (GAET) method, (c) the least-Square periodicityestimator (LSPE) method, <strong>and</strong> (d) the fusion of (b) <strong>and</strong> (c).R s[m] will be used <strong>in</strong> place of F s[m]. R c[m]; F c[m]; f c[m] <strong>and</strong>R n [m]; F n [m]; f n [m] can similarly be def<strong>in</strong>ed us<strong>in</strong>g the samples c[k]<strong>and</strong> n[k], respectively.3) Geometrical Technique to Calculate the Noise Level: It is observedon the R s [m] plot that the samples s[k] <strong>and</strong> n[k] arepartially separated, <strong>and</strong> the amplitude of the zero mean Gaussian<strong>noise</strong> samples n[k] locate closer to the orig<strong>in</strong> whereas, the clearsignal samples c[k] dom<strong>in</strong>ate the higher values as illustrated <strong>in</strong>Fig. 2. It is <strong>in</strong>terest<strong>in</strong>g to note that the <strong>noise</strong> level approximatelycorresponds to the bend<strong>in</strong>g po<strong>in</strong>t, <strong>and</strong> that it shifts to a higheramplitude level as the <strong>in</strong>crease <strong>in</strong> <strong>noise</strong> decreases the SNR from9 dB to 8 dB. However, this is not very obvious for SNR = 4<strong>and</strong> 02 dB. A geometrical technique can heuristically be usedto f<strong>in</strong>d the bend<strong>in</strong>g po<strong>in</strong>t on the MAPD graph which representsthe <strong>noise</strong> level (see Fig. 3). The po<strong>in</strong>t Q 0can be found by <strong>in</strong>tersect<strong>in</strong>gthe two tangent l<strong>in</strong>es pass<strong>in</strong>g through the po<strong>in</strong>ts A-A 0<strong>and</strong> B-B 0respectively. Then, a third l<strong>in</strong>e pass<strong>in</strong>g through the topleft corner <strong>and</strong> the po<strong>in</strong>t Q 0crosses the MAPD graph at the “optimum”po<strong>in</strong>t, Q(s q ;y q ). For robustness to various w<strong>in</strong>dow sizes<strong>and</strong> different applications, the <strong>in</strong>tersection po<strong>in</strong>t Q 0is calculatedus<strong>in</strong>g three different tangent l<strong>in</strong>es, choos<strong>in</strong>g y =1=5; 1=10 <strong>and</strong>1=20 for po<strong>in</strong>t B 0 <strong>and</strong> y =4=5; 9=10 <strong>and</strong> 19=20 for po<strong>in</strong>t A 0respectively where these values are observed to be not very critical.The average value for the po<strong>in</strong>t Q(s q;y q) is used to calculates q . The <strong>noise</strong> level s q can further be multiplied by a safetycoefficient (0:8
482 IEEE TRANSACTIONS ON SPEECH AND AUDIO PROCESSING, VOL. 8, NO. 4, JULY 2000show that those students recognized more than 80% of the words correctly.F<strong>in</strong>ally, the computational complexity for each algorithm <strong>and</strong>for various block sizes is calculated <strong>and</strong> compared <strong>in</strong> Fig. 8.V. CONCLUSIONThe commonly used VAD algorithms, <strong>in</strong>clud<strong>in</strong>g the recently <strong>in</strong>troducedgeometrically adaptive energy threshold (GAET) method, areshown to have problems <strong>in</strong> the presence of <strong>nonstationary</strong> <strong>noise</strong>, speciallybelow 0 dB SNR. The estimate for <strong>noise</strong> level is shown to beaccurate even when the analysis w<strong>in</strong>dows do not fully conta<strong>in</strong> voice-<strong>in</strong>activesignals <strong>in</strong> the presence of <strong>nonstationary</strong> <strong>noise</strong>. This new geometricalalgorithm is observed to improve the energy threshold method approximately5 dB. The fusion of the GAET <strong>and</strong> the LSPE algorithmsis observed to operate reliably down to 05 dB, most speech can bedetected above 010 dB <strong>and</strong> tested to be accurate for both men <strong>and</strong>women on various <strong>noise</strong> backgrounds. The computation complexity ofthe GAET <strong>and</strong> the LSPE algorithms are observed to be approximatelyequal, <strong>and</strong> the new fusion method’s complexity to be approximatelyequal to the total of both algorithms, which is acceptable for most applications.REFERENCESFig. 8. Approximate number of numerical operations required by thealgorithms as a function of the analysis block size.weights. The length of the analysis block for the GAET can be decreasedfor highly <strong>nonstationary</strong> backgrounds, but this would raise thethreshold artificially when SNR <strong>and</strong> word length are both above 20 dB<strong>and</strong> 1200 ms, respectively.IV. RESULTSAs an objective measure to evaluate the algorithms, the percentagesof the (correctly detected-false triggered) samples of speech at differentSNR’s are shown <strong>in</strong> Fig. 5 where the SNR is measured over a set ofeight words (words from 1 to 8 uttered <strong>in</strong> Turkish: bir, i-ki, üç, dört, bes,al-tı, ye-di, se-kiz), <strong>and</strong> <strong>noise</strong> is assumed to be additive <strong>and</strong> stationary.Later, the same speech signal is corrupted by the <strong>nonstationary</strong> <strong>noise</strong> asshown <strong>in</strong> Fig. 6. Maximum rate of change <strong>in</strong> <strong>noise</strong> level, around 0 dBSNR, measures approximately 5 dB/s. It is observed that the zero cross<strong>in</strong>gsrate method misses the two syllable words “‘two” <strong>and</strong> “eight” <strong>in</strong>low SNR whereas the geometrically adaptive energy threshold methodmisses only “eight”. The LSPE method clearly has the problem of falsetrigger<strong>in</strong>g <strong>in</strong> high <strong>noise</strong>. The fusion method is observed to detect allthe words accurately, <strong>and</strong> is shown to detect the endpo<strong>in</strong>ts of the voiceactive regions accuately even <strong>in</strong> the presence of <strong>nonstationary</strong> <strong>noise</strong>.The short jitters can be m<strong>in</strong>imized by postprocess<strong>in</strong>g. The average percentagesof the (correctly captured-false triggered) samples for the examplegiven <strong>in</strong> Fig. 6 are also calculated (Table I). The algorithm is alsotested on 25 record<strong>in</strong>gs of women, men <strong>and</strong> children recorded <strong>in</strong> various<strong>noise</strong> backgrounds: traffic, restaurant, school corridor <strong>and</strong> waterfounta<strong>in</strong> <strong>noise</strong> as opposed to clean speech with the post-hoc additionof <strong>noise</strong> as <strong>in</strong> Fig. 6. A typical result us<strong>in</strong>g the speech of a woman <strong>in</strong>traffic is given <strong>in</strong> Fig. 7. It is observed that the proposed method is accurateexcept for the first syllable of 7 <strong>and</strong> misses the second syllable of9 where the SNR is estimated to be below 010 for those segments. Alisten<strong>in</strong>g comprehension test is done among 20 Turkish speak<strong>in</strong>g eng<strong>in</strong>eer<strong>in</strong>gstudents us<strong>in</strong>g the detected segments of the words. The results[1] K. Bull<strong>in</strong>gton <strong>and</strong> J. M. Fraser, “Eng<strong>in</strong>eer<strong>in</strong>g aspects of TASI,” Bell Syst.Tech. J., pp. 353–364, Mar. 1959.[2] O. Tanrikulu, B. Baykal, A. G. Constant<strong>in</strong>ides, <strong>and</strong> J. A. Chambers,“Critically sampled sub-b<strong>and</strong> acoustic echo cancellers based on IIR <strong>and</strong>FIR filter banks,” IEEE Trans. Signal Proccess<strong>in</strong>g, vol. 45, pp. 901–912,Apr. 1997.[3] L. R. Rab<strong>in</strong>er <strong>and</strong> M. R. Sambur, “<strong>Voice</strong>d-unvoiced-silence <strong>detection</strong>us<strong>in</strong>g the Itakura LPC distance measure,” <strong>in</strong> Proc. Int. Conf. Acoust.,<strong>Speech</strong>, Signal Process<strong>in</strong>g, May 1977, pp. 323–326.[4] J. C. Junqua, B. Reaves, <strong>and</strong> B. Mak, “A study of endpo<strong>in</strong>t <strong>detection</strong>algorithms <strong>in</strong> adverse conditions: Incidence on a DTW <strong>and</strong> HMM recognize,”<strong>in</strong> Proc. Eurospeech’91, 1991, pp. 1371–1374.[5] J. A. Haigh <strong>and</strong> J. S. Mason, “Robust voice <strong>activity</strong> <strong>detection</strong> us<strong>in</strong>g cepstralfeatures,” <strong>in</strong> Proc. IEEE TENCON, Ch<strong>in</strong>a, 1993, pp. 321–324.[6] N. B. Yoma, F. McInnes, <strong>and</strong> M. Jack, “Robust speech pulse-<strong>detection</strong>us<strong>in</strong>g adaptive <strong>noise</strong> model<strong>in</strong>g,” Electron. Lett., vol. 32, July 1996.[7] R. Tucker, “<strong>Voice</strong> <strong>activity</strong> <strong>detection</strong> us<strong>in</strong>g a periodicity measure,” Proc.Inst. Elect. Eng., vol. 139, pp. 377–380, Aug. 1992.[8] D. K. Freeman, G. Cosier, C. B. Southcott, <strong>and</strong> I. Boyd, “The voice<strong>activity</strong> detector for the Pan-European digital cellular mobile telephoneservice,” <strong>in</strong> Proc. Int. Conf. Acoust., <strong>Speech</strong>, Signal Process<strong>in</strong>g,Glasgow, U.K., May 1989, pp. 369–372.[9] K. Sr<strong>in</strong>ivasan <strong>and</strong> A. Gersho, “<strong>Voice</strong> <strong>activity</strong> <strong>detection</strong> for cellular networks,”<strong>in</strong> Proc. IEEE <strong>Speech</strong> Cod<strong>in</strong>g Workshop, Oct. 1993, pp. 85–86.[10] S. Sasaki <strong>and</strong> I. Matsumoto, “<strong>Voice</strong> <strong>activity</strong> <strong>detection</strong> <strong>and</strong> transmissionerror control for digital cordless telephone system,” IEICE Trans.Commun., vol. E77B, no. 7, pp. 948–955, 1994.[11] D. R. Halverson, “Robust estimation <strong>and</strong> signal <strong>detection</strong> with dependent<strong>nonstationary</strong> data,” Circuits Syst. Signal Process., vol. 14, no. 4,pp. 465–472, 1995.[12] H. Özer <strong>and</strong> S. G. Tanyer, “A geometric algorithm for voice <strong>activity</strong><strong>detection</strong> <strong>in</strong> <strong>nonstationary</strong> Gaussian <strong>noise</strong>,” <strong>in</strong> Proc. EUSIPCO’98,Rhodes, Greece, Sept. 1998.[13] M. J. Irw<strong>in</strong>, “Periodicity estimation <strong>in</strong> the presence of <strong>noise</strong>,” <strong>in</strong> Proc.Acoust. Conf.’79, W<strong>in</strong>demere, U.K., 1980.[14] F. Horner, Advance <strong>in</strong> Radio Research, New York: Academic, 1964, vol.2, pp. 121–204.[15] A. D. Spauld<strong>in</strong>g, W. H. Ahlbeck, <strong>and</strong> L. R. Espel<strong>and</strong>, “Urban residentialman-made radio analysis <strong>and</strong> predictions,” U.S. Govt. Pr<strong>in</strong>t<strong>in</strong>g Office,Wash<strong>in</strong>gton, DC, OT Telecommun. Res. Eng. Rep., 1971.[16] T. Nakai <strong>and</strong> H. Ohba, “On the graphical method of draw<strong>in</strong>g APD’sfor atmospheric radio <strong>noise</strong>,” IEEE Trans. Electromagn. Compat., vol.EMC-26, pp. 71–78, May 1984.[17] H. Özer, “Signal <strong>detection</strong> <strong>and</strong> estimation <strong>in</strong> <strong>nonstationary</strong> background,”M.S. thesis, Dept. Elect. Electron. Eng., Başkent Univ., Ankara, Turkey,Aug. 1998.