DAWOOD LAWRENCEPUR LIMITED - Lahore Stock Exchange
DAWOOD LAWRENCEPUR LIMITED - Lahore Stock Exchange
DAWOOD LAWRENCEPUR LIMITED - Lahore Stock Exchange

Create successful ePaper yourself
Turn your PDF publications into a flip-book with our unique Google optimized e-Paper software.
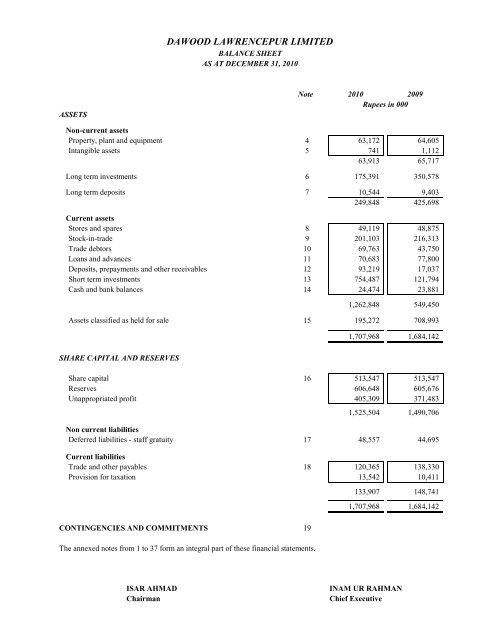
<strong>DAWOOD</strong> <strong>LAWRENCEPUR</strong> <strong>LIMITED</strong>BALANCE SHEETAS AT DECEMBER 31, 2010ASSETSNote 2010 2009Rupees in 000Non-current assetsProperty, plant and equipment 4 63,172 64,605Intangible assets 5 741 1,11263,913 65,717Long term investments 6 175,391 350,578Long term deposits 7 10,544 9,403249,848 425,698Current assetsStores and spares 8 49,119 48,875<strong>Stock</strong>-in-trade 9 201,103 216,313Trade debtors 10 69,763 43,750Loans and advances 11 70,683 77,800Deposits, prepayments and other receivables 12 93,219 17,037Short term investments 13 754,487 121,794Cash and bank balances 14 24,474 23,8811,262,848 549,450Assets classified as held for sale 15 195,272 708,9931,707,968 1,684,142SHARE CAPITAL AND RESERVESShare capital 16 513,547 513,547Reserves 606,648 605,676Unappropriated profit 405,309 371,4831,525,504 1,490,706Non current liabilitiesDeferred liabilities - staff gratuity 17 48,557 44,695Current liabilitiesTrade and other payables 18 120,365 138,330Provision for taxation 13,542 10,411133,907 148,7411,707,968 1,684,142CONTINGENCIES AND COMMITMENTS 19The annexed notes from 1 to 37 form an integral part of these financial statements.ISAR AHMADChairmanINAM UR RAHMANChief Executive
<strong>DAWOOD</strong> <strong>LAWRENCEPUR</strong> <strong>LIMITED</strong>PROFIT AND LOSS ACCOUNTFOR THE YEAR ENDED DECEMBER 31, 2010NoteFor sixmonths endedDecember 31,2010 2009Rupees in 000CONTINUING OPERATIONSSales - net 20 380,862 193,365Cost of goods sold 21 (330,206) (140,441)Gross profit 50,656 52,925Other operating income 22 158,149 58,074Selling and distribution 23 (11,349) (5,555)Administrative expenses 24 (51,387) (16,767)Finance charges 25 (1,236) (154)Provisions 26 (19,405) (2,681)Impairment loss on 'available for sale' investments (1,411) (170,178)(84,788) (195,335)Profit / (Loss) before taxation 124,017 (84,337)Provision for taxation 27 (24,061) (1,089)Profit / (Loss) after taxation from continuing operations 99,956 (85,426)DISCONTINUED OPERATIONSLoss from discontinued operations 28 (40,452) (22,639)Profit / (loss) for the year / period 59,504 (108,065)Earnings per share - Basic & dilutedContinued operations (Rs.) 29 1.95 (1.66)Earnings per share - Basic & dilutedDiscontinued operations (Rs.) 29 (0.79) (0.44)Comparative information is presented for six months only as explained in note (1.3) to the financial statements.The annexed notes from 1 to 37 form an integral part of these financial statements.ISAR AHMADChairmanINAM UR RAHMANChief Executive
<strong>DAWOOD</strong> <strong>LAWRENCEPUR</strong> <strong>LIMITED</strong>STATEMENT OF COMPREHENSIVE INCOMEFOR THE YEAR ENDED DECEMBER 31, 2010For sixmonths endedDecember 31,2010 2009Rupees in 000Profit / (loss) after taxation 59,504 (108,065)Other comprehensive incomeSurplus on remeasurement of'available for sale investments' 972 112,303Total comprehensive income 60,476 4,238Comparative information is presented for six months only as explained in note (1.3) to the financial statements.The annexed notes from 1 to 37 form an integral part of these financial statements.ISAR AHMADChairmanINAM UR RAHMANChief Executive
<strong>DAWOOD</strong> <strong>LAWRENCEPUR</strong> <strong>LIMITED</strong>CASH FLOW STATEMENTFOR THE YEAR ENDED DECEMBER 31, 2010For the year ended December 31, 2010 For the six months ended December 31, 2009Continuing Discontinued Total Continuing Discontinuedoperations operations operations operations-------------------------------------------------------- Rupees in 000 ----------------------------------------------------------------A. CASH FLOWS FROM OPERATING ACTIVITIESProfit / (loss) before taxation 124,017 (40,452) 83,565 (84,338) (22,639) (106,977)Adjustments for :Depreciation 6,192 3,008 9,200 2,667 1,757 4,424Amortization 124 247 371 73 147 220Provision for gratuity 9,363 582 9,945 4,122 354 4,476Provision against stock 4,688 2,619 7,307 921 - 921Provision against stores and spares 13,904 1,447 15,351 1,760 - 1,760Provision against sales tax refundable - 8,128 8,128 - - -Provision against trade debtors 812 2,534 3,346 - - -Gain on disposal of property, plant and equipment (201) (1,162) (1,363) - - -Gain on disposal of assets classified as held for sale - (15) (15) - - -Impairment loss on 'available for sale investments' 1,411 - 1,411 170,177 - 170,177Dividend income (96,177) - (96,177) (53,785) - (53,785)Insurance claim against held for sale assets - (5,600) (5,600) - - -Gain on sale of long-term investments (22,335) - (22,335) - - -Gain on sale of short-term investments (6,425) - (6,425) - - -Unrealized gain on short-term investments (28,269) - (28,269) (1,793) - (1,793)Finance cost 1,236 458 1,694 154 62 216Operating profit / (loss) before working capital changes 8,340 (28,206) (19,866) 39,958 (20,319) 19,639Total(Increase) / decrease in current assetsStores and spares (14,148) 23,860 9,712 1,514 - 1,514<strong>Stock</strong> in trade 10,522 10,226 20,748 (8,179) 20,768 12,589Trade debtors (30,000) 641 (29,359) (8,003) 267 (7,736)Loans and advances (141) (404) (545) (261) - (261)Deposits, prepayments andOther receivables (6,242) (78,067) (84,309) 4,270 (2,082) 2,188Increase/ (decerese) in current liabilitiesTrade and other payables (11,139) (7,186) (18,325) 8,790 (3,726) 5,064(51,148) (50,930) (102,078) (1,869) 15,227 13,358Cash (used in) / generated from operations (42,808) (79,136) (121,944) 38,089 (5,092) 32,997Financial charges paid (1,236) (458) (1,694) (154) (62) (216)Gratuity paid (6,083) - (6,083) (1,402) - (1,402)Tax paid 8,929 (22,195) (13,266) (1,367) (5,476) (6,843)Net cash (used in) / generated from operating activities (41,198) (101,789) (142,987) 35,166 (10,630) 24,536
For the year ended December 31, 2010 For the six months ended December 31, 2009Continuing Discontinued Total Continuing Discontinuedoperations operations operations operations-------------------------------------------------------- Rupees in 000 ----------------------------------------------------------------B. CASH FLOWS FROM INVESTING ACTIVITIESPurchase of property, plant and equipment (8,485) (240) (8,725) (3,987) - (3,987)Sale proceeds from disposal ofproperty, plant and equipment 930 1,391 2,321 - - -Sale proceeds from disposal ofassets classified as held for sale - 475,583 475,583 - - -Proceeds from insurance claim - 5,600 5,600Advance for issue of capital - - - (8,313) - (8,313)Investment in a subsidiary (30,410) - (30,410) - - -Short-term investments - net (598,000) - (598,000) (121,794) - (121,794)Fund transfer from / (to) operations 381,231 (381,231) - (10,344) 10,344 -Sale proceeds from disposal of investments 227,493 - 227,493 - - -Dividend received 96,177 - 96,177 53,785 - 53,785Long term deposits (262) (879) (1,141) 452 - 452Net cash (used in) / generated from investing activities 68,674 100,224 168,898 (90,201) 10,344 (79,857)TotalC. CASH FLOWS FROM FINANCING ACTIVITIESPayment of dividend (25,317) - (25,317) - (34) (34)Net cash from financing activities (25,317) - (25,317) - (34) (34)Net increase / (decrease) in cash and cash equivalent (A+B+C) 2,159 (1,565) 594 (55,035) (320) (55,355)Cash and cash equivalent at beginning 20,902 2,979 23,881 75,937 3,299 79,236Cash and cash equivalent at end 23,061 1,414 24,475 20,902 2,979 23,881Cash and cash equivalentCash and bank balances 23,061 1,413 24,474 20,902 2,979 23,88123,061 1,413 24,474 20,902 2,979 23,881Comparative information is presented for six months only as explained in note (1.3) to the financial statements.The annexed notes from 1 to 37 form an integral part of these financial statements.ISAR AHMADChairmanINAM UR RAHMANChief Executive
<strong>DAWOOD</strong> <strong>LAWRENCEPUR</strong> <strong>LIMITED</strong>STATEMENT OF CHANGES IN EQUITYFOR THE YEAR ENDED DECEMBER 31, 2010OrdinarySharesMergerReserveSharePremiumCapital ReservessCapitalReserveCapitalRedemptionreserve fundGeneralReserveUnappropriatedprofitUnrealized gain /(loss) onremeasurement ofavailable for saleinvestmentsTotal…………………………………..……………………………. Rupees in 000 ……………………………………………………………………Balance at July 01, 2009 513,547 10,521 136,865 33,311 25,969 395,355 479,547 (108,648) 1,486,467Loss for the period ended December 31, 2009 - - - - - - (108,065) - (108,065)Other comprehansive income for the periodended December 31, 2009 - - - - - - - 112,303 112,303Balance at December 31, 2009 513,547 10,521 136,865 33,311 25,969 395,355 371,483 3,655 1,490,705Profit for the year ended December 31, 2010 - - - - - - 59,504 - 59,504Other comprehansive income for the yearended December 31, 2010 - - - - - - - 972 972Interim cash dividend for the half year endedJune 30, 2010 @ Rs. 0.5 per share - - - - - - (25,677) - (25,677)Balance at December 31, 2010 513,547 10,521 136,865 33,311 25,969 395,355 405,310 4,627 1,525,504The annexed notes from 1 to 37 form an integral part of these financial statements.ISAR AHMADChairmanINAM UR RAHMANChief Executive
<strong>DAWOOD</strong> <strong>LAWRENCEPUR</strong> MILLS <strong>LIMITED</strong>NOTES TO THE FINANCIAL STATEMENTSFOR THE YEAR ENDED DECEMBER 31, 20101. GENERAL INFORMATION1.1Dawood Lawrencepur Limited, "the Company" was incorporated in Pakistan in the year 2004 as a public limitedcompany formed as a result of Scheme of Arrangement for Amalgamation in terms of the provisions of the CompaniesOrdinance, 1984 between Dawood Cotton Mills Limited, Dilon Limited, Burewala Textile Mills Limited, LawrencepurWoolen and Textile Mills Limited. The shares of the Company are listed on the Karachi and <strong>Lahore</strong> <strong>Stock</strong> <strong>Exchange</strong>s.The Company is principally engaged in the business of manufacture and sale of yarn and fabrics made from natural andman-made fibers and blends thereof. The registered office of the Company is situated at 35-A, Shahrah-e-Abdul HameedBin Badees (Empress) Road, <strong>Lahore</strong>.1.2The Company in the year 2008 closed its manufacturing unit located at Burewala, District Vehari. The assets (plant,machinery and current assets) relating to the closed down units have been classified as discontinued operations, and areaccounted for as per the requirement of IFRS-5 'non-current assets held for sale and discontinued operations'.1.3The Company in 2009 adopted special tax year / financial year ending on December 31 with necessary permission fromCommissioner of Income Tax. The audited figures are available for six months period ended December 31, 2009, whichhave been disclosed as comparatives.2. BASIS OF PREPARATION2.1 Basis of measurementThese financial statements have been prepared under the historical cost convention, except that obligations under certainstaff retirement benefits have been measured at present value and certain investments which have been measured at fairmarket value.2.2 Statement of complianceThese financial statements have been prepared in accordance with approved accounting standards as applicable inPakistan. Approved accounting standards comprise of such International Financial Reporting Standards (IFRS) issued bythe International Accounting Standards Board as are notified under the Companies Ordinance, 1984, provisions of anddirectives issued under the Companies Ordinance 1984. In case requirements differ, the provisions or directives of theCompanies Ordinance, 1984 shall prevail.2.3 Functional and presentation currencyThese financial statements are presented in Pakistan Rupees which is the functional currency of the Company and figuresare stated to the nearest thousand rupees.2.4 Critical accounting estimates and judgmentsThe preparation of financial statements in conformity with approved accounting standards require Management, to usejudgments, estimates and assumptions that affect the application of accounting policies, and the reported amounts ofassets, liabilities, income and expenses. Estimates and judgments are continually evaluated, based on historicalexperience and other factors, including expectations of future events that are believed to be reasonable under thecircumstances. Actual results may differ from these estimates. Significant areas of estimates are:-Useful life and depreciation rate of :- Property, plant and equipment- Intangible assetsProvision against stock in trade and stores and sparesEmployees benefitsTaxation
Estimates and assumptions are reviewed on an ongoing basis. Revision of accounting estimates are recognized in theperiod of revision and in any future periods affected.2.5 Application of new and revised accounting standardsThe following standards are effective from accounting periods on or after January 1, 2010 and are applicable to theCompany from the current financial year with no material effect on the financial statements.Amendments to IFRS 5 - Non-current Assets Held for Sale and Discontinued OperationsThe amendments to IFRS 5 clarify that the disclosure requirements in IFRSs other than IFRS 5 do not apply to noncurrentassets (or disposal groups) classified as held for sale or discontinued operations unless those IFRSs require (i)specific disclosures in respect of non-current assets (or disposal groups) classified as held for sale or discontinuedoperations, or (ii) disclosures about measurement of assets and liabilities within a disposal group that are not within thescope of the measurement requirement of IFRS 5.Amendments to IAS 1 Presentation of Financial StatementsThe amendments to IAS 1 clarify that the potential settlement of a liability by the issue of equity is not relevant to itsclassification as current or noncurrent.This amendment has had no effect on the amounts reported because the Company has not issued instruments of thisnature.Amendments to IAS 7 - Statement of Cash FlowsThe amendments (part of Improvements to IFRSs (2009) specify that only expenditures that result in a recognised asset inthe statement of financial position can be classified as investing activities in the statement of cash flows. Consequently,any cash flows in respect of items that do not qualify for recognition as an asset (and, therefore, are recognised in profitor loss as incurred) would be reclassified from investing to operating activities in the statement of cash flows and prioryear amounts restated for consistent presentation.IFRIC – 17 Distributions of Non-cash Assets to OwnersThe amendment states that when a Company distributes non cash assets to its shareholders as dividend, the liability forthe dividend is measured at fair value. If there are subsequent changes in the fair value before the liability is discharged,this is recognized in equity. When the non cash asset is distributed, the difference between the carrying amount and fairvalue is recognized in the income statement. As the Company does not distribute non-cash assets to its shareholders, thisinterpretation has no impact on the Company’s financial statements.2.6Standards, amendments to published standards and interpretations to existing standards that are not yet effective andhave not been early adopted by the CompanyThe following revised standards, amendments to published standards and interpretations to existing standards withrespect to approved accounting standards as applicable in Pakistan would be effective from the dates mentioned below:Standards or InterpretationsAmendments to IFRS 1 - Limited Exemption from Comparative IFRS 7Disclosures for First-time AdoptersAmendments to IFRS 7 - Disclosures – Transfers of Financial AssetsIFRS 9 (as amended in 2010) - Financial InstrumentsIAS 24 (revised in 2009) - Related Party DisclosuresAmendments to IAS 32 - Classification of Rights IssuesAmendments to IFRIC 14 - Prepayments of a Minimum Funding RequirementIFRIC 19 - Extinguishing Financial Liabilities with Equity InstrumentsEffective Date(accounting periodsbeginning on or after)July 1, 2010July 1, 2011January 1, 2013January 1, 2011February 1, 2010January 1, 2011July 1, 2010
3. SIGNIFICANT ACCOUNTING POLICIESThe principal accounting policies applied in the preparation of these financial statements are set out below. These policies havebeen consistently applied to all the years presented.3.1 Property, plant and equipment and capital work in progress3.1.1Recognition & measurementProperty, plant and equipment, except for free hold land, are stated at cost, less accumulated depreciation andaccumulated impairment losses, if any. Cost includes expenditure that is directly attributable to the acquisitionof the asset. Capital work-in-progress is stated at cost.Disposal of assets is recognized when significant risks and rewards incidental to the ownership have beentransferred to the buyers. Gains and losses on disposal of an item of property, plant and equipment are determinedby comparing the proceeds from disposal with the carrying amount of property, plant and equipment and arerecognized in profit and loss.3.1.2Subsequent costsThe costs of replacing part of an item of property, plant and equipment is recognized in the carrying amount ofthe item, if it is probable that the future economic benefits embodied within the part will flow to the Companyand its cost can be measured reliably. The carrying amount of the replaced part is derecognized. The costs of theday to day servicing of property, plant and equipment are recognized in profit or loss as they are incurred3.1.2 Assets subject to finance leaseLease in terms of which the Company assumes substantially all the risks and rewards of ownership, are classifiedas finance lease. Upon initial recognition, the leased asset is measured at an amount equal to the lower of its fairvalue and present value of minimum lease payments. Subsequent to initial recognition, the asset is accounted forin accordance with the accounting policy applicable to that asset. Outstanding obligations under the lease lessfinance cost allocated to future periods are shown as a liability.Finance cost under lease agreements are allocated to the periods during the lease term so as to produce a constantperiodic rate of markup on the remaining balance of principal liability for each period.3.1.3 DepreciationDepreciation is charged to profit and loss account applying reducing balance method, whereby the cost of anasset is written off over its estimated useful life. Depreciation on additions is charged from the date on whichasset is available for use and on disposals up to the date of deletion. Freehold land is not depreciated. Theresidual value, depreciation method and the useful lives of each part of property, plant and equipment that issignificant in relation to the total cost of the asset are reviewed, and adjusted if appropriate, at each reportingdate.3.1.4 ImpairmentAssets that have an indefinite useful life, for example goodwill, are not subject to amortisation and are testedannually for impairment. Assets that are subject to amortisation are reviewed for impairment whenever events orchanges in circumstances indicate that the carrying amount may not be recoverable. An impairment loss isrecognised for the amount by which the asset’s carrying amount exceeds its recoverable amount. The recoverableamount is the higher of an asset’s fair value less costs to sell and value in use. For the purposes of assessingimpairment, assets are grouped at the lowest levels for which there are separately identifiable cash flows (cashgeneratingunits).
3.2 Intangible assets3.2.1 SoftwaresAcquired computer software licenses are capitalized on the basis of the costs incurred to acquire and bring to usethe specific software. Software is stated at cost less accumulated amortization and accumulated impairmentlosses, if any. These are amortized using the 'Straight Line Method' from the month the software is available foruse upto the month of its disposal at the rate mentioned in note 5.1. The residual values, useful lives andamortization method are reviewed and adjusted, if appropriate, at each balance sheet date. Refer note 5.2 inrespect of changes in accounting estimates with regard to the intangible assets.3.3 Financial instrumentsAll financial assets and liabilities are recognized at the time when the Company becomes a party to the contractualprovisions of the instrument. Financial assets include trade debts, other receivables, loans, advances and deposits. Theseare recognized initially at cost plus directly attributable transaction costs, if any, and subsequently measured at fair valueor amortized cost using effective interest rate method as the case may be less provision for impairment, if any. <strong>Exchange</strong>gains and losses arising in respect financial assets or liabilities in foreign currency are added to the respective carryingamounts.3.4 InvestmentsThe Company recognises an investment when it becomes a party to the contractual provisions of the instrument. Aregular way purchase of financial assets is recognised using trade date accounting. From this date any gains and lossesarising from changes in fair value of the financial assets or financial liabilities are recorded. Financial liabilities are notrecognised unless one of the parties has performed its part of the contract or the contract is a derivative contract.3.4.1 Investments in subsidiaries and associated companiesInvestments, in subsidiaries where control exist, and associates where significant influence can be established areinitially stated at cost. Subsequently, the recoverable amount is estimated to determine the extent of impairmentlosses, if any, and carrying amounts are adjusted accordingly. Impairment losses are recognized as expense inthe profit and loss account. Where impairment losses subsequently reverse, the carrying amounts of theinvestments are increased to the revised recoverable amounts but limited to the extent of initial cost ofinvestments. A reversal of impairment loss is recognized in the profit and loss account adjusted for impairment,if any, in the recoverable amounts of such investments.3.4.2 Investments available for saleInvestments ‘available for sale’ are initially recognized at fair value, plus attributable transactions cost.Subsequent to initial recognition these are measured at fair value. Gains or losses on available-for-saleinvestments resulting from changes in fair value are recognized directly in equity until the investments are sold ordisposed off, or until the investments are determined to be impaired, at that time cumulative gain or losspreviously reported in the equity is included in current year's profit and loss account.All other investments in unquoted securities are stated at cost, less provision for impairment, if any.3.4.3 Held-to-maturity investmentsHeld-to-maturity investments are financial assets with fixed or determinable payments and fixed maturities thatthe management has the positive intention and ability to hold to maturity. These are recorded at amortized costusing the effective interest rate method, less any amount written off to reflect impairment.3.4.4 Financial assets at fair value through profit or lossAn instrument is classified as ‘fair value through profit or loss’ if it is held for trading or is designated as suchupon initial recognition. Financial instruments are designated at fair value through profit or loss if the Companymanages such investments and makes purchase and sales decisions based on their fair value. Upon initialrecognition, attributable transaction costs are recognized in the profit and loss account when incurred. Financialinstruments at fair value through profit or loss are measured at fair value, and changes therein are recognized inthe profit and loss account. Purchases and sales of investments are accounted for at trade date, i.e., the date thatthe Company commits itself to purchase or sell the investment.
3.4.5 ImpairmentA financial asset is assessed at each reporting date to determine whether there is any objective evidence that it isimpaired. A financial asset is considered to be impaired if objective evidence indicates that one or more eventshave had a negative effect on the estimated future cash flows of that asset. Individually significant financial assetsare tested for impairment on an individual basis. The remaining financial assets are assessed collectively ingroups that share similar credit risk characteristics.For available-for-sale financial investments, the Company assesses at each balance sheet date whether there isobjective evidence that an investment or a group of investments is impaired. In the case of equity investmentsclassified as available-for-sale, objective evidence would include a significant or prolonged decline in the fairvalue of the investment below its cost. Where there is evidence of impairment, the cumulative loss - measured asthe difference between the acquisition cost and the current fair value, less any impairment loss on that investmentpreviously recognised in the income statement - is removed from equity and recognised in the profit and lossaccount. Impairment losses on equity investments are not reversed through the income statement; increases intheir fair value after impairment are recognised directly in equity.3.4.6 DerecognitionThe Company derecognises a financial asset when the contractual rights to the cash flows from the financial assetexpire or it transfers the financial asset and the transfer qualifies for derecognition in accordance withInternational Accounting Standard 39: Financial Instruments; Recognition and Measurement.A financial liability is derecognised when the obligation specified in the contract is discharged, cancelled orexpired.3.5 Stores, spares and loose toolsStores, spares and loose tools are valued at weighted average cost except for items in transit, which are stated at costincurred up to the balance sheet date. For items which are slow moving and / or identified as surplus to the Company’srequirements, adequate provision is made for any excess book value over estimated realizable value and for this, theCompany reviews the carrying amount of stores and spares on a regular basis and accordingly provision is made forobsolescence.3.6 <strong>Stock</strong>-in-trade<strong>Stock</strong>-in-trade is valued at the lower of cost and net realizable value. Cost is determined using weighted average methodexcept for raw material in transit, which is stated at cost. Cost includes applicable purchase cost and manufacturingexpenses. The cost of work in process includes material and proportionate conversion costs.Net realizable value represents the estimated selling price for inventories less all estimated costs of completion and costsnecessary to make the sale.3.7 ProvisionsProvisions are recognized when the Company has a legal or constructive obligation as a result of past events and it isprobable that an outflow of resources emodying economic benefits will be required to settle the obligation and a reliableestimate of the amount can be made. Provisions are reviewed at each balance sheet date and adjusted to reflect currentbest estimate.3.8 Cash and cash equivalentsCash and cash equivalents comprise of cash in hand, deposits held with banks and highly liquid investments with lessthan three months maturity from the date of acquisition. Running finance facilities availed by the Company, which arerepayable on demand and form an integral part of the Company's cash management are included as part of cash andcash equivalents for the purpose of the statement of cash flows.
3.9 Non-current assets held for sale and discontinued operations3.9.1 Non-current assetsNon-current assets that is expected to be recovered primarily through sale rather than through continuing use isclassified as held for sale. The assets (or disposal group) are measured at lower of their carrying amount and fairvalue less cost to sell. Impairment losses on initial classification as held for sale and subsequent gains or losses onre-measurement are recognized in profit or loss. Non-Current assets classified as held for sale are not depreciatedor amortized.3.9.2 Discontinued operationsA discontinued operation is a component of the Company's business that represents a separate major line ofbusiness or geographical area of operations that has been disposed of or is being held for sale, or is a subsidiaryacquired exclusively with a view to resale. Classification as a discontinued operation occurs upon disposal orwhen the operation meets the criteria to be classified as held for sale, if earlier. When an operation is classified asa discontinued operation, the comparative profit and loss account is re-presented as if the operation had beendiscontinued from the start of the comparative period.3.10 Employees' retirement benefits3.10.1 Defined contribution planA defined contribution plan is a post – employment benefit plan under which the Company pays fixedcontribution into a separate entity and will have no legal or constructive obligation to pay further amounts.Obligations for contributions to defined contribution plans are recognized as an employee benefit expense inprofit or loss when they are due. The Company operates defined contribution provident fund for its permanentemployees of its Burewala Unit. Monthly contributions are made both by the Company and employees to thefund at the rate of 8.33% of basic salary.3.10.2 Defined benefit plan3.10.3 Compensated absences3.11 TaxationA defined benefit plan is a post-employment benefit plan other than a defined contribution plan. The Company ’snet obligation in respect of defined benefit plan is calculated by estimating the amount of future benefit thatemployees have earned in return for their service in current and prior periods, that benefit is discounted todetermine its present value. The calculation is performed at least once annually, by a qualified actuary using theprojected unit credit method. The Company operates a Defined Benefit ‘Gratuity’ Plan, for its regular permanentemployees who have completed qualifying period of service. A funded Gratuity scheme is in place for theManagement employees of the Company’s ‘Lawrencepur Woolen and Textile Mills Unit’, and unfunded gratuityscheme is followed for other employees.Provisions are made in the financial statements to cover obligations under the scheme. The provision requireassumptions to be made of future outcome which mainly include increase in remuneration, expected return onplan assets and the discount rate used to convert future cash flows to current values. As per the actuarial valuationcarried out as at December 31st 2010, following significant assumptions were used for determining the gratuityliability.Discount rate 13%Expected rate of salary increase 12%Expected rate of return on plan assets 12%Average expected remaining life of employees 9 yearsActuarial gains or losses in excess of corridor limit of 10% of the difference between fair value of assets andpresent value of obligation are recognized over the estimated remaining service life of the employees.The Company provides for compensated absences of its employees on unavailed balance of leave in the period inwhich the leave is earned.Income tax expense comprises current and deferred tax. Income tax expense is recognized in profit or loss except to theextent that it relates to items recognized directly in equity, in which case it is also directly recognized in equity.
3.11.1 CurrentProvision for current taxation is based on income streams chargeable at current rate of taxation under thenormal tax regime after taking into account tax credits and tax rebates available, if any. The charge for currenttax include adjustments to charge for prior years, if any.3.11.2 DeferredDeferred tax is provided using the balance sheet liability method, providing for temporary differences betweenthe carrying amounts of assets and liabilities for financial reporting purposes and the amounts used for taxationpurposes. The amount of deferred tax provided is measured at the tax rates that are expected to apply to theperiod when the asset is realized or the liability is settled, based on tax rates and the tax laws that have beenenacted or substantively enacted by the balance sheet date.Deferred tax liabilities are recognized for all taxable temporary differences. Deferred tax asset is recognized onlywhen it is probable that future taxable profits will be available against which the deductible temporary differencescan be utilized. Deferred tax assets are reduced to the extent that it is no longer probable that the related taxbenefit will be realized.3.12 Revenue recognitionRevenue is recognised to the extent that it is probable that the economic benefits will flow to the Company and therevenue can be reliably measured. Revenue is measured at the fair value of the consideration received or receivable in thenormal course of business. Revenue is recognised net of brokerages, commission and trade discounts.3.12.1 Sale of goodsRevenue from the sale of goods is recognised when the significant risks and rewards of ownership of the goodshave passed to the buyer, usually on delivery of the goods.3.12.2 Interest incomeIncome from investments and deposits is recognized on accrual basis.3.12.3 Dividend incomeDividend income is recognized when the Company's right to receive the dividend is established.3.13 Borrowing costsBorrowing costs are recognized as an expense in the period in which they are incurred except, to the extent of borrowingcost that is directly attributable to the acquisition, construction or production of a qualifying asset. Such borrowing costs,if any, are capitalized as part of the cost of such asset.3.14 Foreign currency translationTransactions in the foreign currencies are accounted for in Pakistan Rupees at the exchange rates prevailing at the date ofthe transactions. Monetary assets and liabilities in foreign currencies are translated into Pakistan Rupees at rates ofexchange prevailing at the balance sheet date. Foreign exchange differences are recognized in the profit and loss account.3.15 Earnings per shareThe Company presents basic and diluted earnings per share (EPS) data for its ordinary shares. Basic EPS is calculated bydividing the profit or loss attributable to ordinary shareholders of the Company by the weighted average number ofordinary shares outstanding during the period. Diluted EPS is determined by adjusting the profit or loss attributable toordinary share holders and the weighted average number of ordinary shares outstanding for the effects of all dilutivepotential ordinary shares.3.16 Off-setting of financial assets and financial liabilitiesFinancial assets and financial liabilities are offset and the net amount is reported in the balance sheet when there is alegally enforceable right to set-off the recognized amounts and the Company intends either to settle on a net basis, or torealize the asset and settle the liability simultaneously.
4.1The Company is in the process of transferring Land having carrying value of Rs 3.76 million (2009: Rs 3.76 million) andbuilding having carrying value of Rs 23.60 million (2009: 25.98 million) in its own name which is being currently heldin the name of the merged entities.Note2010 2009Rupees in 0004.2 Depreciation for the year has been allocated as under:Cost of goods sold 21 4,395 2,298Selling expenses 23 584 135Administrative expenses 24 4,221 1,9919,200 4,4244.3 The following assets were disposed off during the year:DescriptionAccumulated CarryingCostSale proceeddepreciation value- - - - - - - - - - - - - - Rupees in 000 - - - - - - - - - - - - - -Mode ofdisposalParticulars ofbuyerPlant and 1,526 970 556 556 Agreement Mr. MuhammadmachineryIsmailComputer 105 56 49 49 Negotiation DawoodequipmentsHerculesChemicalsLimitedVehicle 104 82 22 240 Tender Mr. Asif AsgharVehicle 429 309 120 321 Tender Mr. NooruddinVehicle 385 346 39 250 Tender Mr. Asif AsgharVehicle 879 711 168 901 Tender Mr. Adil AshrafVehicle48 44 4 4CompanypolicyMr. Altaf MoonVehicle 37 37 - - Agreement Mr. MuhammadIsmailVehicle 295 295 - - Agreement Mr. MuhammadIsmail2010 3,808 2,851 957 2,3212009 - - - -
Note2010 2009Rupees in 0005. INTANGIBLE ASSETSComputer software 5.1 741 1,1125.1 Computer softwareCost 2,380 2,380AmortizationBalance as on Jan 1 1,268 1,048Charge for the year / period 371 220Balance as on Dec 31 1,639 1,268Carrying amount 741 1,112Rate of amortization (%) 33.33% 33%5.2Previously the software was being amortized at the rate of 33% using reducing balance method. Effective from currentyear, the Company has started charging amortization at the rate of 33.33% using straight line method. The change hasbeen made to better reflect the pattern in which economic benefits of the computer software are consumed by theCompany. The above change has been accounted for as change in accounting estimates in accordance with therequirements of International Accounting Standards (IAS) - 8 "Accounting Policies, Changes in Accounting Estimatesand Errors". Had the Company not made the above referred change in the accounting estimate, profit for the year wouldhave negligible financial impact.Note2010 2009Rupees in 0006. LONG TERM INVESTMENTSInvestment in related parties at cost 6.1 165,822 135,412Other investments 6.2 9,569 215,166175,391 350,5786.1 Investment in related parties at costWholly owned subsidiary - unquotedTenaga Generasi LimitedPercentage holding 100% (December 31, 2009: 100%)7,600,000 (December 31, 2009: 600,000) fully paid 100,528 30,528ordinary shares of Rs. 10/- eachAdvance against issue of shares - 39,590100,528 70,118Associated Company - quotedDawood Hercules Chemicals LimitedPercentage holding 16.19% (December 31, 2009: 16.19%)19,482,975 (December 31, 2009: 17,711,795) fully paid 65,294 65,294ordinary shares of Rs. 10/- eachMarket value Rs. 3.864 billion(December 31, 2009: 3.185 billion)Chief Executive Officer: Mr. Isar Ahmad165,822 135,412
6.2 Other investments- Available for sale investments2010 2009 Name of Investee 2010 2009No. of Shares / UnitsRupees in 000Listed SecuritiesIt is secured againstpledge hypothecation of raw cotton of stocks and andpersonal guarantees of ofdirectors. It Itis subject to69,137 55,310 Sui Southern Gas Company Limited 1,481 743200,000 200,000 National Investment Trust Limited 6,284 6,050801,900 801,900 Southern Electric Company Limited 1,788 3,200Nil 8,272,470 Sui Northern Gas Pipeline Limited - 205,1579,553 215,150Un-Listed Securities795,000 795,000 Karnaphuli Paper Mills Limited - -100 100 Mianwali Central Co-operative Bank Limited 1 11,500 1,500 Asian Co-operative Society Limited 15 1516 169,569 215,1666.3 Reconciliation between fair value and cost of investmentsclassified as 'available for sale'2010 2009Rupees in 000Fair value of investments 9,569 215,166Gain on remeasurement of investmentrecognized in equity (4,627) (3,655)Impairment loss charged to profit and loss account- for the year 1,411 170,178- in prior years 10,713 115,6167,497 282,139Cost of investments 17,066 497,3057. LONG TERM DEPOSITSElectricity and gas deposits 9,019 8,561Others 1,525 84210,544 9,4038. STORES AND SPARESStores 36,200 25,458Spares 32,053 28,64768,253 54,105Provision for slow moving and obsolete items (19,134) (5,230)49,119 48,875
Note2010 2009Rupees in 0009. STOCK IN TRADERaw material 11,566 7,567Work in process 88,374 101,853Finished goods 105,393 106,390205,333 215,810Raw material in transit 10,764 10,809216,097 226,619Provision for slow moving and obsolete items (14,994) (10,306)201,103 216,3139.1 Provision for slow moving and obsolete items10. TRADE DEBTSRaw material 4,915 3,440Work in process 3,259 1,248Finished goods 6,820 5,61814,994 10,306UnsecuredConsidered good 69,763 43,750Considered doubtful 23,060 19,71492,823 63,464Provision against doubtful receivable 10.1 (23,060) (19,714)69,763 43,75010.1 Movement in provision for doubtful debtOpening balance 19,714 20,049Provision made during the year 3,346 -Written off / adjustment during the year - (335)Closing balance 23,060 19,71410.2The amount due and maximum aggregate amount from related parties at the end of any month during the year / period areas follows:-MaximumAmount month endOutstanding balanceRupees in 000December 31, 2010Sach International (Private) Limited 6,788 17,492December 31, 2009Sach International (Private) Limited 321 2,60911. LOANS AND ADVANCESNote2010 2009Rupees in 000UnsecuredConsidered goodIncome tax 11.1 69,025 76,689Loans and advances to employees 813 291Advances to suppliers and others 845 82070,683 77,800
Note2010 2009Rupees in 00011.1 Income taxAdvance 90,534 76,689Provision for taxation (21,509) -69,025 76,68912. DEPOSIT, PREPAYMENTS AND OTHER RECEIVABLESSecurity deposits 386 1,825Prepayments 1,912 2,803Letters of credit 1,053 601Receivable against disposal of held for sale assets 86,500 -Sales tax 12.1 3,324 11,302Others 12.2 44 50693,219 17,03712.1 Sales taxSales tax 11,452 11,302Provision against doubtful receivable (8,128) -3,324 11,30212.2The amount due and maximum aggregate amount from related parties at the end of any month during the year / periodare as follows:-MaximumAmount month endNote Outstanding balanceRupees in 000December 31, 2010Dawood Hercules Chemical Limited 5 5,033Tenaga Generasi Limited 39 804December 31, 2009Sach International (Private) Limited 438 5,119Dawood Hercules Chemical Limited 68 88413. SHORT TERM INVESTMENTSNote2010 2009Rupees in 000Held for trading at fair value through Profit and Loss 13.1 754,487 121,794Held for trading at fair value through Profit and Loss2010 2009 Name of Investee 2010 2009No. of UnitsRupees in 0004,906,434 2,320,760 Meezan Cash Fund 245,518 121,7942,690,456 Nil UBL Liquidity Plus Fund - Class - C 269,575 -2,342,233 Nil MCB Cash Management Optimizer 239,394 -754,487 121,794
Note2010 2009Rupees in 00013.1 Reconciliation between fair value and cost of investmentsclassified as 'held for trading at fair value through profit or loss'Fair value of investments 754,487 121,794Unrealized gain on remeasurement of investmentrecognised in profit or loss account- for the year 28,269 1,794- in prior years 1,794(30,063) (1,794)Cost of investments 724,424 120,00014. CASH AND BANK BALANCESCash in hand 1,103 1,058Cash at banksIn current accounts 6,757 18,770In deposit accounts 14.1 16,614 4,05323,371 22,82324,474 23,88114.1These represent deposits with commercial banks and carry profit at the rate of 5% (December 31, 2009: 5%) per annum.Note2010 2009Rupees in 00015. ASSETS CLASSIFIED AS HELD FOR SALEPlant and equipment 15.1 172,762 648,330<strong>Stock</strong>-in-trade 11,946 38,823Stores and spares 16,447 40,307201,155 727,460Under Of Provision for slow moving and obsolescence on stock tradeFair For These Assessment all prior Clausevalue fair financial non-currentandvalues year The176 have project ofisstoresthe hasof statements amount been&all liabilities been the has Secondsparesother finalized for rearranged beenfinancial were which the set Schedule upwherever atup fair authorized to instruments asset values financial the tocould have for premises the necessaryissue be are year Incomebeen exchanged, considered 1999-2000 ofTax Salfi to facilitate Ordinance, Textiletaken __________________ ator book (assessment approximate liability comparison.Mills 1979 Limitedvalues15.2settled the profit whoyear these their bybetween the 2000-2001). book are are andthe gainsBoard not values(5,883)knowledgeable considered of solederived as Returns Directors they consumer to materiallybyare(18,467)willingthe ofLong term deposit Addition Disposal Finance These Deferred advances does against tof taxation plant not leased raw carry have and arising material machinery any been rate due obtained to of represent timing return. during from The difference transfer the following fair year buyers value toinclude has non-financial town of been procure itassets Rs.216,680/- has computed been raw institutions material taken completion under (1997-Rs.1,823,391/-)for book under the the of liability value following term ordered asofmethod.itgoods.lease. is terms short total not the for195,272 708,993
15.1.1 During the year Company disposed off all of its plant and equipments classified as held for sale assets of two ofits discontinued units at Landhi, Karachi. Remaining assets under held for sale relate to Burewala unit for whichapproval of disposal from the Board of Directors has already been obtained during the year and after approval ofthe same from the shareholders in 2011, management of the Company will dispose off the remaining assets.Due to taxable -Finance Repayment loss during against : the The local year, company bills provision discounting shallfor repay current facilities the subordinated taxation obtained is made loan fromunder after following the section repayment non-financial 113 of of thelease Income institutions liability Tax15.2 Movement in slow moving / obsolescence on stock in trade and stores & spares2010 2009Rupees in '000Opening balance 18,467 18,467Provision made during the year 4,066 -Provision written off against stock in trade (16,650) -Closing balance 5,883 18,46716. SHARE CAPITAL16.1 Authorized capital2010 2009 2010 2009Number of SharesRupees in '00075,000,000 55,000,000 Ordinary shares of Rs.10/- each750,000 550,00016.2 Issued, subscribed and paid up capital2010 2009 2010 2009No. of SharesRupees in 000Ordinary shares of Rs.10/- each2,204,002 2,204,002 Fully paid in cash22,040 22,04012,805,118 12,805,118 Issued for consideration other than cash 128,051 128,05136,345,540 36,345,540 Fully paid as bonus363,456 363,45651,354,660 51,354,660 513,547 513,54716.2.1 Associates holding of the Companys' share capital are as under:2010 2009No. of SharesDawood Corporation (Private) Limited 25,195,651 25,195,651Patek Private Limited 3,045,117 3,045,117Central Insurance Company Limited 2,795,735 2,853,778Pebbles (Private) Limited 596,277 596,277Dawood Industries (Private) Limited 105,959 105,749Sach International (Private) Limited 3,284 3,28431,742,023 31,799,85617. DEFERRED LIABILITIESNote2010 2009Rupees in '000Gratuity 17.1 48,557 44,695Deferred taxation 17.2 - -48,557 44,695
Note2010 2009Rupees in '00017.1 Movement in the liability recognized in the balance sheetOpening balance 44,695 41,621Net charge for the year 9,945 4,47654,640 46,097Payments made during the year / period (6,083) (1,402)Closing balance 48,557 44,69517.1.1 Charge for defined benefit planCurrent service cost 4,078 1,779Interest cost 6,127 2,827Return on plan assets (260) (130)9,945 4,47617.1.2 ReconciliationPresent value of defined benefit obligation 50,644 51,059Fair value of plan assets (2,082) (2,163)Actuarial losses to be recognized in later periods (5) (4,201)48,557 44,695December December June June June2010 2009 2009 2008 2007------------------------------ Rupees in 000 ---------------------------------Present value of defined benefit obligation50,644 51,059 47,107 29,616 76,631Fair value of plan assets (2,082) (2,163) (2,163) (2,163) (2,162)Surplus /(Deficit) in the plan 48,562 48,896 44,944 27,453 74,469Unrecognised actuarial (loss) / gain (5) (4,201) (3,323) 10,287 8,266Liability in balance sheet 48,557 44,695 41,621 37,740 82,735Experience adjustment arising on planliabilities (gains) / losses(4,537) 749 12,580 4,054 11,281Experience adjustment arising on planassets losses(341) (130) (216) (216) (237)17.2 Deferred taxationDeferred tax asset works out to Rs. 135.43 million. However, it is likely that the income of the Company will be taxablebased on tunrover tax and under final tax regime in future. As a matter of prudence, deferred tax asset is not recognized.
Note2010 2009Rupees in 00018. TRADE AND OTHER PAYABLESCreditors 22,400 34,741Accrued expenses 30,410 28,914Gratuity payable to ex staff 6,104 8,307Advance from customers and others 3,770 12,345Unclaimed dividend 21,058 20,698Due to Islamic Development Bank 18.1 25,960 25,960Deposits 18.2 719 740Workers' welfare fund 1,705 -Withholding tax 93 157Others 18.3 8,146 6,468120,365 138,33018.1This represents amount payable against the preference shares issued before the amalgamation in the year 2004 by one ofthe merged entity to Islamic Development Bank with right to redeem. The merged entity had served notice to the Bankfor redemption before the scheme of amalgamation and redemption reserve has been created.18.2All deposits are re-payable on demand and no interest is payable thereon.18.3 These includes amount due to following related parties:2010 2009Rupees in 000Sach International (Private) Limited 275 -Dawood Corporation (Private) Limited 155 155The Dawood Foundation 9 173Central Insurance Company Limited 8 27719. CONTINGENCIES AND COMMITMENTS19.1 ContingenciesThe Taxation Officer while making assessments for the tax years 2003 to 2005, had made additions on account ofallocation of expenses between the normal and presumptive income and disallowance of expenses against the operatingincome of the Company of Rs. 136.10 million, made errors in allowing expenses relating to gratuity, lease rentals,employee perquisites, utilities of Rs. 29.34 million etc. The Company preferred appeals before CIT (Appeals) andIncome Tax Appellate Tribunal. The Company has also applied for the rectification of different mistakes in assessmentorders for the tax years 2004 amounting to Rs 5.53 million, and against calculation of minimum tax and adjustment ofbrought forward losses amounting to Rs 20.92 million and Rs. 20.62 million in which decision of Tribunal is awaited .The tax impact of all the cases amount to Rs. 91.56 million.The Company obtained a bank guarantee in favour of Alternate Energy Development Board (AEDB) on behalf of TenagaGenerasi Limited (the subsidiary Company) for US$ 50,000 (December 31, 2009: US$ 25,000). The guarantee is validupto February 2011.The Company is contingently liable against the guarantees and the counter guarantees amounting to Rs 64.37 million(December 31, 2009: Rs. 64.16 million). These are secured against margins and investment in NIT units.
19.2 CommitmentsThe Company has commitments against letters of credit for purchases amounting to Rs. 42.44 million (December, 2009:Rs. 37.33 million).The Company has commitment to supply to one of its customers fabric amounting to Rs. 16.79 million (December 31 ,2009: Rs. 69.78 million).NoteFor sixmonths endedDecember 31,2010 2009Rupees in 00020. SALES - NETFabric 387,208 208,885Yarn 6,055 7,957Waste 3,805 2,738397,068 219,580Less: brokerage, commission and discount (4,704) (1,827)392,364 217,753Related to discontinued operationsFabric 11,502 24,212Waste - 176(11,502) (24,388)380,862 193,36521. COST OF GOODS SOLDRaw material consumed 21.1 122,362 56,983Salaries, wages and allowances 21.2 96,171 45,738Electricity, gas and water 61,869 24,493Stores and spares consumed 21.3 24,289 15,362Depreciation 4,395 2,298Insurance 1,532 660Repairs and maintenance 305 454Workers' canteen 1,251 591Travelling and conveyance 2,078 869Postage and telephone 339 140Other manufacturing overheads 1,139 428315,730 148,016Work in processOpening balance 100,605 81,864Closing balance (87,127) (100,605)13,478 (18,741)Cost of goods manufactured 329,208 129,275Finished goodsOpening balance 121,057 152,990Closing balance (109,833) (121,057)11,224 31,933Cost of goods sold 340,432 161,208Related to discontinued operations (10,226) (20,767)330,206 140,441
NoteFor sixmonths endedDecember 31,2010 2009Rupees in 00021.1 Raw material consumedAt Jan 01, 4,938 14,651Purchases and purchase expenses 126,542 47,270131,480 61,921At Dec 31, (9,118) (4,938)122,362 56,98321.2Staff salaries and benefits include Rs.5.3 million (2009 : Rs. 3.3 million) in respect of the staff retirement benefits.21.3 Stores and spares consumedAt Jan 01, 50,635 50,389Purchases and purchase expenses 38,437 15,60889,072 65,997This represents At Dec 31, amount of freezed loan waived by the bank vide their letter No.NIL dated September (64,783) 19, 2002. (50,635)24,289 15,36222. OTHER OPERATING INCOMEIncome from financial assetsDividend IncomeDawood Hercules Chemical Limited 95,644 53,134Sui Southern Company Limited 83 -National Investment Trust Limited 450 65096,177 53,784Profit on deposits 1,321 795Capital gain on sale of investments- available for sale 22,335 -- held for trading 6,425 -Unrealized gain on short term investments 28,269 1,79458,350 2,589Income from non financial assetsProfit on sale of property, plant and equipment 1,363 -Profit on sale of assets classified as held for sale 15 -Interest on security deposits 344 -Sundry sales and receipts 7,671 473Insurance claim 5,600 -Other income 1,450 2,868Liabilities written back 328 -Reversal of provision for doubt full debts - 335171,298 60,049Related to discontinued operations (13,149) (1,975)158,149 58,074
23. SELLING EXPENSES NoteFor sixmonths endedDecember 31,2010 2009Rupees in 000Salaries and allowances 23.1 6,319 2,414Sales promotion expenses 1,517 110Storage and forwarding 932 433Depreciation 584 135Conveyance and travelling 500 80Rent, rates and taxes 401 930Printing and stationery 395 427Repairs and maintenance 153 104Freight and insurance 147 285Advertisement 136 419Postage and telephone 111 24Entertainment 88 23Electricity and gas 62 163Miscellaneous 4 811,349 5,55523.1 This includes staff retirement benefits of Rs. 1.1 million (December 31, 2009: Rs. 0.1 million)24. ADMINISTRATIVE EXPENSESSalaries and allowances 24.1 53,524 23,476Printing and stationery 1,636 999Rent, rates and taxes 6,006 3,721Electricity and gas 6,220 5,828Conveyance and travelling 3,028 1,770Postage and telephone 2,053 896Insurance 2,741 1,456Repairs and maintenance 1,241 414Legal and professional 3,497 2,161Auditors' remuneration 24.2 466 352Fees and subscription 2,753 874Advertisement - 84Entertainment 623 226Workers' welfare fund 1,705 -Depreciation 4,221 1,991Amortization 371 220Miscellaneous expenses 994 47291,079 44,940Related to discontinued operations (39,692) (28,173)51,387 16,76724.1 Staff salaries and benefits include Rs.2.9 million (2009 : Rs. 0.4 million) in respect of the staff retirement benefits.24.2 Auditors' remunerationAnnual audit fee 300 210Audit fee of consolidated financial statements 40 40Half yearly review and other certification fee 126 102
466 352NoteFor sixmonths endedDecember 31,2010 2009Rupees in 00025. FINANCE COSTBank charges 1,643 166Zakat 51 501,694 216Related to discontinued operations (458) (62)1,236 15426. PROVISIONSStores and spares 15,351 1,760<strong>Stock</strong> in trade 7,307 921Debtors 3,346 -Sales tax refundable 8,128 -34,132 2,681Related to discontinued operations (14,727) -19,405 2,68127. PROVISION FOR TAXATIONCurrentfor the year 13,542 1,089for prior years 10,519 -24,061 1,08927.1 Relationship between tax expense and accounting profitThe relationship between tax expense and accounting profit has not been presented in these financial statements as thetotal income falls under: (a) turnover tax provided under section 113; (b) tax on dividend income under section 5 of theIncome Tax Ordinance, 2001.NoteFor sixmonths endedDecember 31,2010 2009Rupees in 00028. LOSS FROM DISCONTINUED OPERATIONSSales - net 11,502 24,388Cost of goods sold 28.1 (10,226) (20,767)Gross profit 1,276 3,621Other Income 13,149 1,975Administrative expenses (39,692) (28,173)Provisions (14,727) -Finance cost (458) (62)Net loss from discontinuing operations (40,452) (22,639)
NoteFor sixmonths endedDecember 31,2010 2009Rupees in 00028.1 Cost of good soldRaw materialOpening inventory 71 71Less: closing inventory (71) (71)Raw materials consumed - -Add: opening inventory of finished goods 20,284 41,051Less: closing inventory of finished goods (10,058) (20,284)Cost of good sold 10,226 20,76729.EARNINGS PER SHARE- Basic & dilutedThere is no dilutive effect on the basic earnings per share of the Company which is based on: -29.1 Continuing operations2010 2009Profit / (loss) after taxation Rs. 99,955,943 (85,426,661)Weighted average number of ordinary sharesoutstanding during the year 51,354,660 51,354,660Earnings per share Rs. 1.95 (1.66)29.2 Discontinued operationsLoss after taxation Rs. (40,451,754) (22,638,624)Weighted average number of ordinary sharesoutstanding during the year 51,354,660 51,354,660Earnings per share Rs. (0.79) (0.44)30. REMUNERATION Assessment has been OF CHIEF finalized EXECUTIVE up to financial AND EXECUTIVESyear 1999-2000 (assessment year 2000-2001). Returns of total20102009Chief Executive Executives Chief Executive Executives- - - - - - - - - - - - - - - Rupees in 000 - - - - - - - - - - - - - - -Remuneration 1,669 5,553 556 3,059House rent allowance 835 1,681 278 1,201Utilities 417 482 139 408Retirement benefits 348 120 46 128Other allowance 778 2,104 244 1,0984,047 9,940 1,263 5,894No. of person 1 6 1 5Chief executive and directors of the Company are entitled to use of Company maintained vehicle.
31. TRANSACTIONS WITH RELATED PARTIESRelated parties comprise of a subsidiary and associated undertakings, other related group companies, directors of the Companyand key management personnel. The Company in the normal course of business carries out transactions with various relatedparties. Amounts due from and to related parties, directors and key management personnels are shown under respective notesreceivables and payables. Remuneration of directors and key management personnel is disclosed in note 29. Other significanttransactions with related parties are as follows:Relationshipa. Subsidiary companyNature of transactionFor sixmonths endedDecember 31,2010 2009Rupees in 000Tenaga Generasi Limited Subscription of ordinary shares 30,409 8,313Reimbursement of expenses 4,390 -b. Associated companyDawood Hercules Chemicals Limited Dividend income 95,644 53,135Sach International (Private) Limited Sale of cloth 28,968 2,419Central Insurance Company Limited Premium paid 3,201 4,184c. Other related partiesSui Northern Gas Company Limited Payment of utility charges 23,342 9,681The Dawood Foundation Rental charges 6,353 2,95532. FINANCIAL RISK MANAGEMENTThe Company’s principal financial liabilities comprise trade and other payables. The Company's financial assets comprises oftrade debts, prepayments, other receivables, bank balances and investments in equity securities and units of mutual fund thatarrive directly from its operations. The Company also holds loans, advances and deposits.The Company’s activities expose it to a variety of financial risks: credit risk, liquidity risk and market risk (including cash flowinterest rate risk, currency risk, equity price risk and fair value interest rate risk ).The Company's overall risk management programme focuses on the unpredictability of financial markets and seeks to minimisepotential adverse effects on the Company’s financial performance.32.1 Credit risk and concentration of credit riskCredit risk is the risk of financial loss to the Company if a customer or counterparty to a financial instrument fails to meetits contractual obligations, and arises principally from the trade debts, loans and advances, trade deposits and otherreceivables.Out of the total financial assets of Rs. 1,125.1 million (2009: Rs. 555.7 million), the financial assets which are subject tocredit risk amounted to Rs. 1,124.0 million (2009: Rs. 554.6 million).The Company is exposed to credit risk from its operating activities (primarily for trade receivables and loans andadvances, deposits, other receivables) and from its investing activities, including investment in securities, deposits withbanks, and other financial instruments.
32.1.1 Credit risk related to receivablesCompany only deals in local sales. Customer credit risk is managed by business unit subject to the Company’sestablished policy, procedures and control relating to customer credit risk management. Company mainly dealswith customers of high credit rating based on its internal assessment, taking into account of financial position,past experience and other factors. In addition outstanding customer receivables are regularly monitored andappropriate actions are taken to minimize risk of bad debts.At December 31, 2010, the Company had approximately 186 customers (2009:169 customers) that owed Rs.69.76 million (2009: Rs. 43.75 million). There were 3 customers (2009:1 customers) with balances greater thanRs. 5 million accounting for over 34% (2009: 21%) of trade debts.32.1.2 Credit risk related to financial instruments and cash deposits32.2 Liquidity riskCredit risk from balances with banks and financial institutions is managed by chief executive officer, chiefoperating officer and risk officer in accordance with the Company’s policy.The credit risk on liquid funds (cash and bank balances) is limited because the counter parties are banks with areasonably high credit rating. The names and credit rating of major banks as at January 01, 2011, where theCompany maintains its major bank balances are as follows:RatingCredit ratingName of bank agency Short-term Long-termBank Al Habib Limited PACRA AA+ A1+Habib Bank Limited PACRA AA+ A1+Prudent liquidity risk management implies maintaining sufficient cash and the availability of funding through anadequate amount of committed credit facilities.The Company is not materially exposed to liquidity risk as the Company is already surplus of funds. The contractualobligations to the Company amounts to Rs. 120.4 million (2009: Rs. 138.3 million) are against the currents assets of Rs.937.3 million (2009: 192.9 million).32.3 Market risk managementMarket risk is the risk that changes in market prices, such as interest rates and equity prices will affect the Company'sincome or the value of its holdings of financial instruments. The objective of market risk management is to manage andcontrol market risk exposures within acceptable parameters while optimising returns.32.3.1 Interest rate risk managementAs the Company has no significant interest-bearing assets, the Company’s income and operating cash flows aresubstantially independent of changes in market interest rates.32.3.2 Foreign exchange risk managementForeign currency risk is the risk that the fair value or future cash flows of a financial instrument will fluctuatebecause of changes in foreign exchange rates. The Company’s exposure to the risk of changes in foreignexchange rates relates primarily to the Company’s operating activities which mainly include payable to foreignsuppliers of goods in foreign currency. The Company deals completely in local sales and do not have any foreigncurrency exports against foreign debtors.At June 30, 2010, considering the total outstanding exposure in foreign currency, if the Rupee had weakened /strengthened by 5% against the US dollar with all other variables held constant, profit for the year would havebeen higher / lower by Rs. 1.10 million (2009: Rs. 1.7 million), mainly as a result of foreign exchange gains /losses on translation of foreign currency import loans.
At June 30, 2010, considering the total outstanding exposure in foreign currency, if the Rupee had weakened /strengthened by 5% against the US dollar with all other variables held constant, profit for the year would havebeen higher / lower by Rs. 1.10 million (2009: Rs. 1.7 million), mainly as a result of foreign exchange gains /losses on translation of foreign currency import loans.32.3.3 Equity price risk managementThe Company’s listed equity securities are susceptible to market price risk arising from uncertainties about futurevalues of the investment securities. The Company manages the equity price risk through diversification and offerproper review of individual and total equity instruments. Reports on the equity portfolio are submitted to theCompany’s senior management on a regular basis.At the balance sheet date, the exposure to listed units of mutual funds at fair value is Rs. 754.49 million (2009:Rs. 121.79 million). A decrease / increase of 5% in the net asset value per unit would have an impact ofapproximately Rs. 37.72 million (2009: Rs. 6.09 million) on the income of the Company, depending on whetheror not the decline is significant and prolonged.At the balance sheet date, the exposure to listed equity securities at fair value is Rs. 9.55 million (2009: Rs.215.15 million). A decrease / increase of 5% on the KSE market index would have an impact of approximatelyRs.0.478 million (2009: Rs. 10.76 million) on the other comprehensive income of the Company, depending onwhether or not the decline is significant and prolonged . In addition the Company has exposure of Rs. 100.53million (2009: Rs. 70.12 million) to unlisted equity securities of a wholly owned subsidiary and in listed equitysecurities carried at cost as investment in associate of Rs. 65.29 million (2009: Rs. 65.29 million) having fairvalue of Rs. 3,864 million (2009: Rs. 3,185 million) are held for strategic rather than trading purpose. TheCompany does not actively trade in these securities. A decrease / increase of 5% on the KSE market index wouldhave an impact of approximately Rs.193.20 million (2009: Rs. 159.25 million) on the fair value of these listedequity securites.32.4 Determination of fair values32.4.1 Fair value of financial instrumentsFair value is the amount for which an asset could be exchanged, or a liability settled, between knowledgeablewilling parties in an arms length transaction other than in a forced or liquidation sale.The carrying values of all financial assets and liabilities reflected in the financial statements approximate their fairvalues.32.5 Financial instruments by categoryThe accounting policies for financial instruments have been applied for line items below:Fair valueLoan & Available through profitadvances for sale or lossRupees in 000TotalAssets as per balance sheet- December 31, 2010Long term investments - 175,391 - 175,391Long term deposits 10,544 - - 10,544Trade debtors 69,763 - - 69,763Loans and advances 1,658 - - 1,658Deposits, prepayments and other receivables 88,842 - - 88,842Short term investments - - 754,487 754,487Cash and bank balances 24,474 - - 24,474195,281 175,391 754,487 1,125,159
Liabilities as per balance sheet- December 31, 2010At amortizedcostTotalRupees in 000Trade and other payables 120,365 120,365120,365 120,365Loan &advancesFair valueAvailable through profitfor sale or lossRupees in 000TotalAssets as per balance sheet- December 31, 2009Long term investments - 350,578 - 350,578Long term deposits 9,403 - - 9,403Trade debtors 43,750 - - 43,750Loans and advances 1,111 - - 1,111Deposits, prepayments and other receivables 5,134 - - 5,134Short term investments - - 121,794 121,794Cash and bank balances 23,881 - - 23,88183,279 350,578 121,794 555,651Liabilities as per balance sheet- December 31, 2009At amortizedcostTotalRupees in 00032.6 Fair value hierarchyTrade and other payables 138,330 138,330138,330 138,330The table below analyses financial instruments carried at fair value, by valuation method. The different levels have beendefined as follows:Level 1:Level 2:Level 3:Quoted prices (unadjusted) in active markets for identical assets or liabilities.Inputs other than quoted prices included within Level 1 that are observable for the asset orliability, either directly (i.e., as prices) or indirectly (i.e., derived from prices)Inputs for the asset or liability that are not based on observable market data (unobservableinputs).Level 1 Level 2 Level 3 Total- - - - - - - - - - - - - - - Rupees in 000 - - - - - - - - - - - - - - -Financial assets at fair value through profit or lossShort term investments 754,487 - - 754,487754,487 - - 754,487Available for saleLong term investments 74,863 100,528 - 175,391
74,863 100,528 - 175,391Level 1 Level 2 Level 3 Total- - - - - - - - - - - - - - - Rupees in 000 - - - - - - - - - - - - - - -Loan & advancesLong term deposits - 10,544 - 10,544Trade debtors - 69,763 - 69,763Loans and advances - 70,683 - 70,683Deposits, prepayments and other receivables - 88,842 - 88,842- 239,831 - 239,831Financial liabilities at fair value through profit or lossTrade and other payables 120,365 120,365- 120,365 - 120,36533. CAPITAL RISK MANAGEMENTThe Company manages its capital to ensure that it will be able to continue as a going concern while maximising thereturn to stakeholders through the optimisation of the debt and equity balance.The Company monitors capital on the basis of the gearing ratio. This ratio is calculated as net debt divided by totalcapital. Net debt is calculated as total borrowings less cash and cash equivalents. Total capital is calculated as ‘equity’ asshown in the balance sheet plus net debt.Currently Company is free from any sort of borrowings and is fully equity financed based Company and has adequatefunds to meet its short term and long term liabilities.34. PLANT CAPACITY AND ACTUAL PRODUCTIONUnitDecember 31, 2009December 31, 2010(Six Months)Capacity Actual Capacity ActualYarn Kgs. 358,000 170,000 179,000 93,000Cloth Meters 754,000 664,000 377,000 307,000The main reason for low production is due to lower market demand.35. CORRESPONDING FIGURESCertain corresponding figures have been reclassified / rearranged for the purpose of better presentation. The summary ofmaterial reclassification are as follows:NoteReclassificationFromToNature Rupees in 00011 & 12Deposits,prepaymentsand othersLoans andadvancesReclassification of advance tax76,689
36. DATE OF AUTHORIZATION FOR ISSUEThese financial statements were authorized for issue on March 15, 2011 by the Board of Directors of the Company.37. GENERALFigures have been rounded off to the nearest thousand rupees.ISAR AHMADChairmanINAM UR RAHMANChief Executive
4. Property, plant and equipmentAccumulated Depreciation/ Accumulated Carrying AnnualCostCostParticulars Additions/ depreciation (Disposals) depreciation value at rate ofat January (disposals) at December at January for the at December December depreciation01, 2010 31, 2010 01, 2010 year 31, 2010 31, 2010 %----------------------------------------------------------------- Rupees in 000 ---------------------------------------------------------------------Corresponding The As the Company is is figures is isentitled have for for Had for been tax there tax exemption, rearranged been from from no income and no accelerated revaluation income regrouped tax under tax the depreciation wherever tax related under 118D figures of 118D necessary have the of have of Income been land for the for been claimed the and Tax the Income claimed Ordinance, buildings purposeandTaxnoand of as comparison.1979, no at other September for amaterial period 30, timing 1998 of 5Freehold land3,157 - 3,157 - - - 3,157 -Leasehold land1,081 - 1,081 475 6 481 600 10Building on freehold land 70,557 - 70,557 60,435 832 61,267 9,290 5-10Building on leasehold land 54,414 - 54,414 38,556 1,554 40,110 14,304 10Plant and machinery 284,794 90 283,358 268,091 3,346 270,467 12,891 20(1,526) (970)Furniture, fixtures and officeequipment 25,808 437 26,245 16,672 996 17,668 8,577 10Computer equipment 3,393 1,599 4,887 2,015 669 2,628 2,259 33(105) (56)Vehicles23,818 6,599 28,240 16,173 1,797 16,146 12,094 20(2,177) (1,824)2010 467,022 8,725 471,939 402,417 9,200 408,767 63,172(3,808) (2,850)-Non current assets of the Burewala unit with carrying value of Rs. 172.76 million are shown seperately under "Assets classified as held for sale", in accordancewith IFRS-5.-Property, plant and equipment includes total assets having carrying value of Rs. 24.07 million (2009: Rs. 26.08 million) held as idle assets which relates todiscontinued units.
For comparative yearAccumulated Depreciation Accumulated Carrying AnnualCostCostParticulars Additions depreciation depreciation value at Rate offor theat July at December at July at December December Depreciation01, 2009 31, 2009 01, 2009 period 31, 2009 31, 2009 %-------------------------------------------------------------------- Rupees in 000 --------------------------------------------------------------------Corresponding The As the Company is figures is entitled is entitled have Had for for for been exemption there tax tax rearranged been exemption, from no no revaluation income and no accelerated regrouped tax the under tax related depreciation wherevertax 118D depreciation figures of of necessary have theof of Income been have land for claimed been Tax andthe and Ordinance, purpose and buildings no other of 1979, as comparison. material forSeptembera period timingFreehold land3,157 - 3,157 - - - 3,157 -Leasehold land1,081 - 1,081 473 2 475 606 10Building on freehold land 70,557 - 70,557 59,963 472 60,435 10,122 5-10Building on leasehold land 54,414 - 54,414 37,738 818 38,556 15,858 10Plant and machinery 284,794 - 284,794 266,131 1,960 268,091 16,703 20Furniture, fixtures andoffice equipment 25,742 66 25,808 16,195 477 16,672 9,136 10Computer equipment 3,188 205 3,393 1,956 59 2,015 1,378Vehicles20,102 3,716 23,818 15,537 636 16,173 7,64533202009463,035 3,987 467,022 397,993 4,424 402,417 64,605Non current assets of the following units, are shown seperately under "Assets classified as held for sale", in accordance with IFRS-5.- Landhi Unit- Dilon Unit (Landhi - Synthetic)- Burewala Unit
15.1 Plant and equipmentsAccumulated Accumulated CarryingCostCostParticulars Disposals depreciation Disposals depreciation value atat January at December at January for the at December December01, 2010 31, 2010 01, 2010 year 31, 2010 31, 2010-------------------------------------------------------------------------- Rupees in 000 ------------------------------------------------------------------------Corresponding The As the Company is figures is isentitled have for for for been Had tax been taxexemption, there rearranged from been from no income and no accelerated no income and regrouped revaluation tax regrouped tax under taxwherever under depreciation the 118D wherever related 118D of necessary the have figures of necessary have Income been thefor been of of claimed Income the Tax land claimed for purpose Ordinance, Tax and theand of buildings 1979, no comparison. other forasa material period September timing of 5Plant and machinery1,296,452 (916,932) 379,520 654,001 (441,554) 212,447 167,073Furniture, fixtures and office equipment1,169 (1,169) - 1,063 (1,063) - -Electric installations 36,712 (1,049) 35,663 31,685 (965) 30,720 4,943Tools and equipment 2,893 - 2,893 2,147 - 2,147 7461,337,227 (919,150) 418,077 688,896 (443,582) 245,314 172,762For comparative yearAccumulated Impairment/ Accumulated CarryingCostCostParticulars Additions/ depreciation (disposal) depreciation value atat July (disposals) at December at July for the at December December01, 2009 31, 2009 01, 2009 period 31, 2009 31, 2009-------------------------------------------------------------------------- Rupees in 000 ------------------------------------------------------------------------Corresponding The As the Company is figures is isentitled have for for for been Had tax been taxexemption, there rearranged from been from no income and no accelerated no income and regrouped revaluation tax regrouped tax under taxwherever under depreciation the 118D wherever related 118D of necessary the have figures of necessary have Income been thefor been of of claimed Income the Tax land claimed for purpose Ordinance, Tax and theand of buildings 1979, no comparison. other forasa material period September timing of 5Plant and machinery 1,296,452 - 1,296,452 654,001 - 654,001 642,451Furniture, fixtures and office equipment1,169 - 1,169 1,063 - 1,063 106Electric installations 36,712 - 36,712 31,685 - 31,685 5,027Tools and equipment 2,893 - 2,893 2,147 - 2,147 7461,337,227 - 1,337,227 688,896 - 688,896 648,330