322C. IZZO & B. M. GILLANDERScatch rates <strong>of</strong> T. fasciata in the south east trawlfishery between 1992 <strong>and</strong> 2002 (Reardon 2003), thisspecies was ranked the eighth most abundant amongbenthic chondrichthyan by-catch species caught intrawl operations in the lower west coast <strong>of</strong> Australia(Hyndes et al. 1999). Trawl fishing has been shownto significantly alter the relative abundances <strong>of</strong>chondrichthyans caught as both target <strong>and</strong> by-catchspecies (Graham et al. 2001, Kennelly 1995).Marshall et al. (2007) previously describedthe dietary composition <strong>and</strong> <strong>reproductive</strong> cycle <strong>of</strong> T.fasciata in Western Australia; however, to date,there have been no previous investigations into the<strong>growth</strong> <strong>of</strong> T. fasciata, <strong>and</strong> the time to sexualmaturity still remains unknown. Thus, here wedetermine rates <strong>of</strong> <strong>growth</strong> <strong>and</strong> reproduction whichwill be valuable in order to assess the susceptibility<strong>of</strong> T. fasciata to fishing impacts.Materials <strong>and</strong> MethodsSpecimens <strong>of</strong> T. fasciata were collectedfrom the by-catch <strong>of</strong> commercial prawn trawlvessels undertaking normal fishing operations in thegulf waters <strong>of</strong> South Australia. Specimens weresexed <strong>and</strong> the total length (TL) <strong>and</strong> disc width (DW)<strong>of</strong> all specimens were measured to the nearestmillimetre. TL <strong>and</strong> DW had a significant linearrelationship:TL (mm) = 2.4578 × DW - 9.6382(n = 43, r 2 = 0.95, p < 0.001)DW (mm) = 0.3863 × TL + 16.19(n = 43, r 2 = 0.95, p < 0.001)Specimens were also weighed (BW: bodyweight) to the nearest gram. Body weight increasedpredictably with TL:BW (g) = 7 × 10 -6 × TL 2.96(n = 43, r 2 = 0.99, p < 0.001)Age estimates were based on counts <strong>of</strong>b<strong>and</strong>s in the vertebrae <strong>of</strong> specimens. Vertebral centrawere cleaned <strong>of</strong> excess tissues, placed in a 5%sodium hypochlorite solution for 10 – 20 min,followed by a rinse in freshwater <strong>and</strong> dried in anoven. Individual vertebral centra were thenembedded in a clear setting epoxy resin <strong>and</strong> cut into(approximately) 300 µm sections with a diamondtipped lapidary saw. These sections were thenmounted onto a microscope slide <strong>and</strong> examinedunder a dissecting microscope with a transmittedlight source (Fig. 1).Marginal increment ratio (MIR) analysiswas attempted in order to determine the time <strong>of</strong> b<strong>and</strong>formation (Liu et al. 1998). However, <strong>growth</strong> b<strong>and</strong>formation could not be fully validated as specimenswere obtained between November <strong>and</strong> April eachyear. Therefore, <strong>age</strong> estimates presented fromhereon are based on counts <strong>of</strong> <strong>growth</strong> b<strong>and</strong>s,with the explicit assumption that the periodicity <strong>of</strong>b<strong>and</strong> formation in T. fasciata is annual (i.e., oneb<strong>and</strong> = one year). In order to verify the suitability<strong>of</strong> the vertebral centra as an <strong>age</strong>ing structure forT. fasciata (i.e., the vertebral centra developed inproportion to body size), the centrum diameter(CD) was measured to the nearest millimetreusing digital calipers for each specimen beforesectioning.Figure 1. Vertebral centra section <strong>of</strong> an 860 mm total lengthmale southern fiddler ray (Trygonorrhina fasciata) showing 11<strong>growth</strong> b<strong>and</strong>s.Counts <strong>of</strong> b<strong>and</strong>s were made from twovertebrae from each specimen. Growth b<strong>and</strong>swere defined as a pair <strong>of</strong> opaque (outer) <strong>and</strong>translucent (inner) circuli observed in the corpuscalcareum <strong>of</strong> the sectioned vertebrae (Fig. 1).Counts were made without prior knowledge<strong>of</strong> the size, sex or previous count <strong>of</strong> the specimen.If the counts varied between the two vertebrae,a third was sectioned <strong>and</strong> counted. If the count<strong>of</strong> the third vertebra matched either <strong>of</strong> the previoustwo it was taken as the count. If there was noagreement between any <strong>of</strong> the three samples thenthat specimen was excluded from the analysis.This counting procedure was repeated <strong>and</strong> theestimated <strong>age</strong>s between readings compared.Errors in the counts <strong>of</strong> <strong>growth</strong> b<strong>and</strong>s in the vertebralcentra were analyzed using the Index <strong>of</strong> Aver<strong>age</strong>Percent<strong>age</strong> Error (IAPE) as described by Beamish<strong>and</strong> Fournier (1981).Age estimates based on counts <strong>of</strong> <strong>growth</strong>b<strong>and</strong>s were fitted to the von Bertalanffy (1938)<strong>growth</strong> function. Growth parameters were calculatedusing FISHPARM version 3.0S (Pr<strong>age</strong>r et al. 1987).Pan-American Journal <strong>of</strong> Aquatic Sciences (2008) 3(3): 321-327
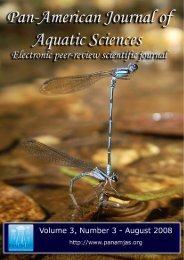
Age, <strong>growth</strong> & reproduction in T. fasciata.323We scored the male <strong>reproductive</strong> status <strong>of</strong> T.fasciata on three criteria: (1) the degree <strong>of</strong> claspercalcification (none, partial, or fully calcified); (2) thedegree <strong>of</strong> vas deferens coiling (none, partial, orcomplete coiling); <strong>and</strong> (3) the presence, or absence<strong>of</strong> semen. Males were considered sexually maturewhen the claspers were rigid <strong>and</strong> the vas deferensshowed partial or complete coiling <strong>and</strong> semen waspresent. Inner clasper length (CL) was also measuredto the nearest millimetre.The female <strong>reproductive</strong> status <strong>of</strong> T. fasciatawas based on two criteria: (1) ova diameters; <strong>and</strong> (2)uterine width <strong>and</strong> development. Females wereconsidered mature when gravid or with ova > 10 mmin diameter in their ovaries, <strong>and</strong> if the uteri weredifferentiated from the oviducts <strong>and</strong> measured > 10mm in width at their widest point (Neer & Cailliet2001).Results <strong>and</strong> DiscussionIn total, 43 specimens (26 males <strong>and</strong> 17females) <strong>of</strong> T. fasciata were examined to providepreliminary <strong>age</strong> <strong>and</strong> <strong>growth</strong> estimates. Males rangedin length from 275 to 877 mm TL, whereas femaleswere slightly longer, ranging from 251 to 1084 mmTL (Fig. 2).Monthly changes in the vertebral MIR <strong>of</strong>T. fasciata appeared to peak in April, whichcoincides with the approximate time <strong>of</strong> birth,followed by an abrupt decrease in May (Fig. 3).These limited data suggest that <strong>growth</strong> b<strong>and</strong>formation occurs once a year between April <strong>and</strong>May.Vertebral centra were verified as suitable<strong>age</strong>ing structures as CD had a significant linearrelationship with TL:TL (mm) = 89.553 × CD + 150.58(n = 86, r 2 = 0.95, p < 0.05)CD also showed a significant linearrelationship with DW:DW (mm) = 37.72 × CD + 71.41(n = 86, r 2 = 0.91, p < 0.05)The IAPE for counts <strong>of</strong> <strong>growth</strong> b<strong>and</strong>s in thevertebral centra <strong>of</strong> T. fasciata was 3.56%, wellbelow the accepted 5% error thresholds (Campana2001). Growth b<strong>and</strong>s in sectioned vertebral centrawere easily identifiable in individuals greater than360 mm TL, <strong>and</strong> as a result no individuals wereexcluded from the study. The calculated vonBertalanffy <strong>growth</strong> function parameters for males,females <strong>and</strong> combined sexes are shown in Table I.Females <strong>and</strong> males possessed similar <strong>growth</strong> rates(k = 0.16 <strong>and</strong> k = 0.18, respectively); however,females attained greater maximum lengths thanmales (L ∞ , = 1157, L ∞ , = 930 mm TL, respectively;Fig. 4). The agreement <strong>of</strong> the b<strong>and</strong> count (<strong>age</strong>)-atlengthdata to the calculated <strong>growth</strong> curve suggeststhat the von Bertalanffy <strong>growth</strong> curve accuratelyforecasts <strong>growth</strong> in South Australian T. fasciata. Thesmallest specimens which displayed signs <strong>of</strong> freshumbilical scarring were 251 to 289 mm TL,indicating that this is the approximate size range atbirth <strong>of</strong> T. fasciata (Table I). This is similar to theestimated size at birth (Y-axis intercept) derived bythe von Bertalanffy <strong>growth</strong> curve (Fig. 4).The oldest T. fasciata specimen determinedfrom counts <strong>of</strong> <strong>growth</strong> b<strong>and</strong>s in vertebrae was a1084 mm TL female that was 15 years old. Thisspecimen provides an initial, conservative estimatefor longevity. Using the equation for theoreticallongevity (t max ) (Skomal & Natanson 2003) weestimated that the t max for both sexes combined was26.6 years (Table I).Figure 2. Length-frequency distribution <strong>of</strong> the southern fiddlerray (Trygonorrhina fasciata) specimens collected from SouthAustralia.Figure 3. Monthly changes in the marginal increment ratio(MIR) <strong>of</strong> the southern fiddler ray (Trygonorrhina fasciata).Where the numbers indicate sample size <strong>and</strong> vertical barsindicate ± the st<strong>and</strong>ard error values.Pan-American Journal <strong>of</strong> Aquatic Sciences (2008), 3(3): 321-327