Supporting Key Console Operator Interactions ... - ASM Consortium
Supporting Key Console Operator Interactions ... - ASM Consortium
Supporting Key Console Operator Interactions ... - ASM Consortium

You also want an ePaper? Increase the reach of your titles
YUMPU automatically turns print PDFs into web optimized ePapers that Google loves.
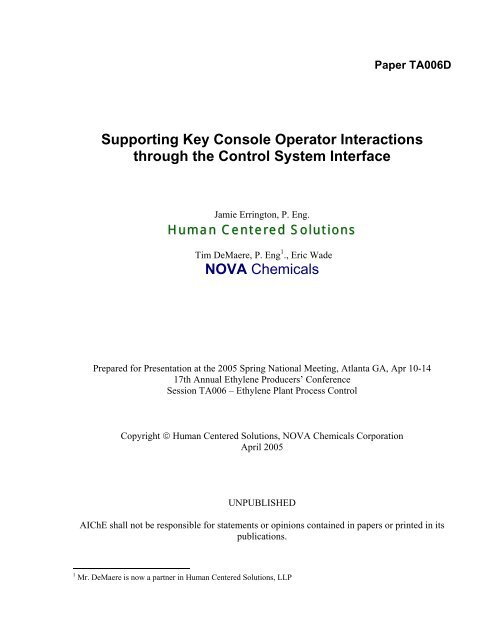
Paper TA006D<strong>Supporting</strong> <strong>Key</strong> <strong>Console</strong> <strong>Operator</strong> <strong>Interactions</strong>through the Control System InterfaceJamie Errington, P. Eng.Human Centered SolutionsTim DeMaere, P. Eng 1 ., Eric WadeNOVA ChemicalsPrepared for Presentation at the 2005 Spring National Meeting, Atlanta GA, Apr 10-1417th Annual Ethylene Producers’ ConferenceSession TA006 – Ethylene Plant Process ControlCopyright © Human Centered Solutions, NOVA Chemicals CorporationApril 2005UNPUBLISHEDAIChE shall not be responsible for statements or opinions contained in papers or printed in itspublications.1 Mr. DeMaere is now a partner in Human Centered Solutions, LLP
AbstractIn today's world of rapidly developing control systems supporting the key interactions betweenthe console operator and their control system is a difficult task that continues to grow as moreprocess data from the field and more information from outside the control system becomesavailable. The control system interface forms a core part of a decision support system that canaid the operators in preventing or minimizing the impact of unplanned plant disturbances andimproving plant performance.This paper will discuss how plant data and external information have been combined in a singleinterface to meet the key console operator interaction requirements. The resulting interfaceincludes integrated trending, yoked multi-windows, and simultaneous increasingly detailedviews of process equipment.A recent case study that compared the performance of console operators using this interface tooperators who used a traditional control system interface is reviewed.
IntroductionIn 1996, NOVA Chemicals Corp. (NOVA Chemicals) launched a major project in Alberta toexpand its Joffre production facility. At the time, Joffre was the home of two ethylene plants, apolyethylene plant and a large utilities unit. In total, the site produced over three billion poundsof product each year. The expansion project was to add new ethylene, polyethylene andcogeneration plants as well as expand the utilities plant to support the expanded facilities. Whencompleted in the summer of 2000, the new facilities would increase the site production to over 6billion pounds per year making it one of the largest ethylene / polyethylene sites in the world.At this time, NOVA Chemicals was a very active member of the Abnormal SituationManagement <strong>Consortium</strong>® (<strong>ASM</strong>) 2 . The <strong>ASM</strong> <strong>Consortium</strong> was developing a novel approach tooperator interface design for its Abnormal Event and Guidance Information System (AEGIS)prototype. The <strong>ASM</strong> <strong>Consortium</strong> member companies were funding the AEGIS prototype as amulti-year, multi-million dollar project with additional support from NIST (National Institute ofStandards and Technology). The goal of the AEGIS project was to demonstrate that with currenttechnologies, a significant improvement in petrochemical plant performance and reliability couldbe achieved.The <strong>ASM</strong> interface approach used a structured multi-window format to improve the consoleoperator’s awareness to changing plant situations so that abnormal situations were identifiedearly and averted or mitigated. The structured format included explicit use of colour,navigational strategies, windows management, and coordinated display associations.With NOVA Chemicals’ knowledge of the AEGIS work, NOVA Chemicals applied and furtherenhanced the approach that had been pioneered by the <strong>Consortium</strong> and move it from the lab tothe field to work with a plant control system.NOVA’s <strong>ASM</strong> style of operator interface was in place for all of the new Joffre plant startups inmid-2000. <strong>Operator</strong> acceptance of the new interface design approach was wide ranging. Someoperators welcomed the new approaches while others were more reluctant during the project.Extensive training on dynamic simulators in the major units prior to the plant startupsignificantly aided the adoption of the new approaches. Following the plant startups, operatorsreported that they found many of the elements of the new interface invaluable and would not goback to the older more traditional interface designs.2 Abnormal Situation Management and <strong>ASM</strong> are registered trademarks of the Abnormal Situation Management<strong>Consortium</strong>.
As a follow-up case study 3 in 2004, NOVA Chemicals and the <strong>ASM</strong> <strong>Consortium</strong> wanted toquantify the response performance difference of operators of similar experience levels due to theuse of either the <strong>ASM</strong> or a Traditional style. A set of simulated plant malfunctions weredeveloped that could be run on two of the ethylene plant simulators where one of the simulatorsused the new <strong>ASM</strong> style of interface while the other used a more Traditional style. Two of thekey features of the <strong>ASM</strong> style of interface that differentiate it from the Traditional style are thenumber of simultaneous views available and the direct integration of process trends.This paper will describe the design approach of the <strong>ASM</strong> style of interface and present asummary of the case study.Interface Design ElementsThe objective of NOVA Chemicals’ <strong>ASM</strong> style of operator interface is to improve the operator’ssituational awareness of changing plant conditions so that abnormal events can be avoided ormitigated. To achieve this objective the operator interface must address how the operatorsinteract with the control system and it must support their decision-making.Through the <strong>ASM</strong> research, it was determined that a good operator interface design needed tointegrate process alarms, process and trend information cohesively together. To create a newinterface approach, learning’s from the strengths and weaknesses of the earlier approaches (suchas large panel boards, strip chart recorders, alarm annunciators, off-normal indicators and formerDCS display formats) were used in conjunction with an understanding of human factors.The earlier approaches showed that people worked best with a fixed structured format thatemphasized key physical and process interrelationships. The ability to see strip charts or trendsof key variables immediately alongside a controller was also very useful in making decisions onwhat should be changed. Pulling controllers out of the panel to indicate that they were in an “offnormal”mode helped people remember this during the shift and at shift-change when theyneeded to relay experiences to the next crew. The location of the alarm annunciators, showingthe critical but very limited number of plant alarms, in association with the corresponding sectionof the plant gave people an immediate localization of the where a problem was occurring. Thesewere all examples of approaches that were taken from the pre-control system interface formats.The human factors’ aspect of the interface design approach is best described by a definition ofhuman factors: “Human factors discovers and applies information about human behavior,abilities, limitations, and other characteristics to the design of tools, machines, systems, tasks,jobs, and environments for productive, safe, comfortable and effective human use.” 4 An interfacedesign therefore should enhance people’s attention and perception of the plant.3 Errington, J. et al. <strong>ASM</strong> <strong>Operator</strong> Interface Case Study, Understanding <strong>ASM</strong>: Business Case Justification, (2004)<strong>ASM</strong> <strong>Consortium</strong> internal publication4 Sanders, M.S, and McCormick, E.J., “Human Factors in Engineering and Design”, (1993) McGraw-Hill, NewYork
From the historical practices and the human factors appreciation, the major design principles ofthe NOVA <strong>ASM</strong> style of interface included:• Support the operator’s scope of worko Situational awarenesso Routine operationso Mode changes• Take advantage of human and computer strengths• Present information through the use of data in context• Maximize focus on task at hando Minimize distractions such as desktop and windows managementProblems that can be experienced by operators using a poorly designed operator interface can bewide ranging. When trying to locate the source of a plant upset, operators can miss importantinformation, be overloaded with too much information or be distracted by an aspect in theinterface. When evaluating a problem to understand what is occurring, operators can often notget the information that they need immediately from the interface. For example access to trendinformation is often several awkward steps away in most interfaces. When the operator is readyto take action, the poor interface is often prone to entry errors, may provide limited feedback tothe operator, or require additional actions to make the changes needed. After making a correctiveaction, an operator will need to assess if the correction is having the desired impact, and willneed a “big picture” of the plant so that they can see the broad impacts of the changes and not getfocused on a very small section.The major design elements of the NOVA <strong>ASM</strong> style of interface included:• Single, Integrated View• Window Management and Layout• Navigation Scheme• Visual Coding Scheme – use of colour & shapes• Interaction Objects• Contextual Menus• Task View OrganizationThe NOVA Chemicals’ <strong>ASM</strong> style of interface is illustrated in Figure 1. The interface uses a setof eight - 21” screens. The screens are operated from four dual-headed workstations. The fourscreens across the top of the console show an area-wide overview summarizing the status of theconsole operator’s scope of responsibility. It is made up of 4 different displays. In the top leftcorner a Type 1 graphic shows a Status View. Beside that is an Alarm Summary with two relatedtrends. Further to the right are two screens showing key area variables in either a standard trendformat or a newer specialized event detection application format.The operator interactions are typically performed though one pair of lower screens in Figure 1labeled as Operations View. Each pair is identical and allows for a second operator to support theconsole during upset or planned high workload periods.
StatusAlarmViewSummaryType 1Ops. ViewOps. ViewOps. ViewOps. ViewType 2Type 3Type 2Type 3ControlNoteLogSpecsConfigureSpecsConfigureFigure 1: NOVA Chemicals’ <strong>ASM</strong> Style InterfaceThe Operations View is comprised of four levels of displays with two fixed trends as shown inmore detail in Figure 2. The Type 2 display (upper left) provides a high-level view of anindividual process unit. The Type 3 display shows a portion of that unit in higher detail. Belowthe Type 3 display is a region used to provide detailed control loop information and a trendobject. Below the Type 2 display there is another trend plus a detail view showing the selectedpoint.Figure 2: NOVA Chemicals’ <strong>ASM</strong> Style <strong>Operator</strong> View<strong>Key</strong> features of the Operations View include• On-screen navigation via display tabs with integrated alarm information• Restricted use of colour, reserving colour to highlight off normal conditions• Windows management minimizing display overlays• Automated display invocation through pre-configured display associations (i.e.,assisted, task-relevant navigation)• Access to online information• Integration of trend information
The <strong>ASM</strong> style is intended to provide a continuous broad overview of process conditions whilesimultaneously giving access to the needed detail information to reduce the potential for “tunnelvisioning” when operators are solving complex process problems.Interaction Requirements“The design of an operator interface that enables efficient and effective job performance requiresthe anticipation of the operators’ needs in understanding the plant’s process interactions, theirinteractions with computers and with other individuals in the workplace.” 5 Often an operatorinterface is described as merely presenting information to people however this description isabout a one-way communication flow. The operator is an active and integral element to goodplant performance and their working with the operator interface is a two-way process. A welldesigned operator interface will provide for not only an effective display of process informationbut will also meet the operator’s interaction needs that are critical to job performance.Aspects of the NOVA <strong>ASM</strong> style interface explicitly addressed the interaction requirements ofthe console operator in working with the control system. The key element of this portion of thedesign was the integration of trend information, the use of context sensitive menus and thedevelopment of the detail display.Figure 3 shows a picture of a detail view in the NOVA <strong>ASM</strong> style of interface for a regulatorycontroller. Its key features with respect to meeting operator interaction requirements are itemssuch as:• highlighted dialog boxes• highlighted operator entry points (white background)• control valve status message box (STSMSG)• instrument maintenance status (REDTAG)• alarm limits displayed with philosophy matching highlights• access to the setpoint target value (SPTV) and ramp controls (RAMPTIME, TVPROC)• access to an alarm acknowledge button and alarm summary controls• access to group trend control menu (TrendControl)• off-normal indicators (magenta)• ramp boxes (displayed on selection of setpoint or output)5 Bullemer, P., Reising D.V., Hajdukiewicz, J., Errington, J, Interaction Requirements Methods for Effective<strong>Operator</strong> Interfaces, Abnormal Situation Management <strong>Consortium</strong> internal publication, (2004)
Figure 3: NOVA <strong>ASM</strong> Style Detail ViewAnytime an operator selects an object on any of the displays, it is immediately placed in theDetail View (Figure 3). As part of this action, trend information about this tag is alsoimmediately created in a detail trend (Figure 4) adjacent to the Detail View. The trend used inthe interface integrated both historical and real-time data about each point to give the operator astrip-chart like component to see how the tag had changed and project the tags trajectory into thefuture.Figure 4: NOVA <strong>ASM</strong> Style Detail TrendThe operator has a wide range of interactions that they can do with the trend in terms of changingtime scales, scrolling back in time, tag ranges, changing from a trend to a tabular format, andadding scooter markers so that they can get the information that they need. For regulatory controltags, the process value, setpoint, output and controller mode were all simultaneously trended. Forother tag types, the traces are configurable to any available parameters.
Online Support InformationTo further support the operator’s interactions, three additional types of information are providedand examples are listed in the following table. Point specific information is provided throughcontext sensitive menus for the tag that the operator is focusing on.Table 1: Online Support InformationSingle DCS Point(Context Sensitive Search)• Alarm Objective Analysis(AOA) Information• Alarm /<strong>Operator</strong> ChangeHistory• APC Cross Reference• Document/Procedure/LogicSearchDCS System/<strong>Console</strong>Alarm Information• Disabled/Inhibited AlarmSummary• Alarm System Metrics(Bad Actors, KPI’s)Desktop Tools Access• SAP Access forMaintenance Requests• Electronic <strong>Operator</strong>Logbook• Desktop – Internet,Intranet, MS Office ToolsFigure 5 shows an example of a context sensitive menu that has been used to recall alarmconfiguration information. The menu is displayed from a “right-mouse” click on any dynamicobject in the displays. What the menu offers is both a direct access to additional informationabout the point in question for the operator or control of the group trend information. If a grouptrend change is requested by the operator, then that additional or deletion of a trend element ismade immediately on the station’s group trend.If the operator requires additional information it is presented in a separate window either on anadjacent workstation display or on the screen that they are working from. The choice of displaylocation is made so that on primary workstations, the additional information does not cover orobscure any critical process information that might be needed by the operator.
Figure 5: Context Sensitive MenusProviding a user interface to support operations with the procedural step information enables amore consistent execution of routine procedures such as a furnace swing. Process control tuningand monitoring can best be setup when the procedure is executed the same way each time.Figure 6 details an example of a furnace swing application that utilizes the integrated displaysand trending to allow operations to monitor this task while executing the swing application. Inthis case additional trending displays are invoked for monitoring purposes.Figure 7 details an example of a semi-automated compressor trip application to expediteexecution of immediate response items while flagging those steps still incomplete. Access to allemergency procedures is via a single click through this interface.
Figure 6: Furnace Swing Procedure SupportFigure 7: Semi-Automated Trip Procedure Support
Case Study BackgroundThe objective of this case study was to evaluate an <strong>ASM</strong> style of operator interface used in oneunit at the NOVA Chemicals Joffre site against a more traditional style of interface used inanother unit at the same site. The key features of the <strong>ASM</strong> style of interface that differentiate itfrom the Traditional style are the number of simultaneous views available and the directintegration of process trends.The project was part of a larger overall project to understand the business case values ofdesigning for <strong>ASM</strong>. The <strong>ASM</strong> <strong>Consortium</strong> and NOVA Chemicals Corp. (NOVA Chemicals)funded this interface case study portion of the project.The interface case study compared the response performance of two groups of operators usingeither the <strong>ASM</strong> style of interface described earlier in this paper, or a more Traditional style ofcontrol system interface. Each group of operators worked on matching problems using two ofNOVA’s high fidelity plant simulators. The two simulators were configured to match eachgroup’s respective plant and operator interface. The time for each operator to orient to theproblem and the total time to solve the problems was recorded. A third element, identified asearly event detection was also recorded during the trials and this captured the point that theoperators first identified an upset.Other components of the study included tests of plant knowledge, individual experience recordsand other information so that a comparison of the two groups could be examined to see ifdifferences other than the interface design were impacting any observed upset performancedifferences.The NOVA Joffre site has three ethylene plants operating on it. The first two ethylene plantswere commissioned in 1979 and 1982 while the third plant went into production in 2000. Theoriginal two plants have gone through several control system changes over the years but both arecurrently using Honeywell Total Plant control systems. The operator interfaces in these plantsare single window interfaces developed on the proprietary Honeywell workstations. An exampleof a typical traditional interface display is shown in Figure 8.
Figure 8: Example of Traditional <strong>Operator</strong> Interface DisplayNavigational aids are in boxes across the top of the display and links to other areas of the plantare accessible from the text boxes at the ends of the process lines. Process variables are generallyshown as a group of text where the tag name is in half-intensity green, setpoints are white,process values are cyan and valve outputs are yellow. Control valves are also colour coded toshow the mode of the controller (yellow is manual, green is auto and blue is cascade). Motoroperatedvalves (MOVs) are displayed with the valve positioners on top of the controllers.Values in alarm are in red along with the sensor object that will flash until the alarm has beenacknowledged by the operating technician. Process lines are colour-coded to distinguish betweenutility (half-intensity white) and hydrocarbon lines (half-intensity green). The pieces ofequipment, such as the compressor and steam turbine in the centre of the display, are outlined inthe display with half-intensity white lines. The half-intensity dashed lines represent theinstrument connections from the controllers to the control valves.When an operator selects a tag on the display to make changes or to get additional information(i.e. historical or trend), a horizontal change zone is displayed at the bottom of the displayhighlighting that tag with the required access points (setpoint, output or mode).
To test the hypothesis that the <strong>ASM</strong> style interface provided an advantage in diagnosing andresponding to abnormal situations, a between-subjects experiment (<strong>ASM</strong> vs. Traditional) wasdesigned that consisted of three phases: pre-test, scenario performance evaluation, and post-test.High fidelity simulators are used extensively in the Joffre ethylene plants for operator training,refresher and qualification testing platform for all of the console operators. These platformsbecame the ideal testing ground for the scenario performance portion of the case study. Thetraining coordinators in the two ethylene units developed a series of matching plantmalfunctions. The operators participating in the study were asked to monitor the plant andrespond to any upsets that occurred. <strong>Operator</strong> actions such as display changes, alarm responses,trend requests and setpoint changes were recorded during each scenario. In all, each participantwas presented with 9 different plant scenarios.Case Study Result SummaryOne of the key study results was the total time to solve the simulated problems. Total time datawas analyzed in a Repeated Measures Analysis of Variance with Interface type (<strong>ASM</strong> vs.Traditional) as the between-subjects factor, and Scenario as the within-subjects (repeated)measure. Using an 80% confidence level 6 , the results of the Repeated Measures analysis ofvariance indicated a significant difference for Interface Type, F(1,19) = 11.689, p < .001 only,and no significant effect of Scenario or Scenario by Interface Type interaction. In general,operators using the <strong>ASM</strong> interface spent significantly less total time solving each scenario thandid operators using the Traditional interface.In addition, an examination of the results shown in Figure 9 shows not only did the operatorsrequire less time, but also that the variability for the operators using the <strong>ASM</strong> interface wasmuch smaller than those of the operators using the Traditional interface. A difference betweenscenarios was expected, as no attempts were made to ensure overall equality between scenarios,and the fact that the interaction between Scenario and Interface Type was not significantindicates that any differences in Scenario had no effect on the time performance of eitheroperator group.6 Wickens, C.D. (1998, Oct.), Commonsense Statistics. Ergonomics in Design, 6(4), pp.19-22
2,000Scenario 2 Total Time(Secs)797Scenario 4 Total Time(Secs)Scenario 7 Total Time(Secs)1,500Scenario 8 Total Time(Secs)1,0005000TraditionalInterface Type<strong>ASM</strong>Figure 9: Total Time to Solve Scenarios (Traditional vs. <strong>ASM</strong> Interface) – Box PlotIn summary, the case study results (Table 2) showed that the operators using the <strong>ASM</strong> multilevel,multi-view interface rather than a Traditional style of interface:• Recognized problems faster and more consistently• Responded and solved problems faster and more consistently• 6.5 – 9.7 min improvement (35 – 48 %) on four scenarios of 15 – 20 minutedurations• Were more likely to successfully solve the problems• 25 % higher success rate for participants using the <strong>ASM</strong> interface versusTraditional interfaceTable 2: Case Study <strong>Key</strong> Results SummaryTraditional<strong>ASM</strong>Scenario Times to Complete - Mean(min)18.1 10.6Scenario Completion (%) 70.0 95.5Early Event Detection (%) 10.0 47.7Overall, the <strong>ASM</strong> style interface has demonstrated in this case study to be superior to theTraditional interface in terms of its impact on operator performance in handling abnormalsituations.
AcknowledgementsThe authors would like to thank the support of NOVA Chemicals and the <strong>ASM</strong> <strong>Consortium</strong> fortheir support of the <strong>Operator</strong> Interface case study. The extraordinary efforts made by Keath Doe,Dave Coppard, Doug Lutz and Carrie Stevenson to prepare and execute the case study are alsoappreciated as they continue to provide outstanding support to the <strong>ASM</strong> <strong>Consortium</strong> researchefforts. We would also like to thank the NOVA Chemicals’ Operating Technicians who sowillingly participated in the case study.