Original article Association between CD4 CD25 T cells and atopy in ...
Original article Association between CD4 CD25 T cells and atopy in ...
Original article Association between CD4 CD25 T cells and atopy in ...

You also want an ePaper? Increase the reach of your titles
YUMPU automatically turns print PDFs into web optimized ePapers that Google loves.
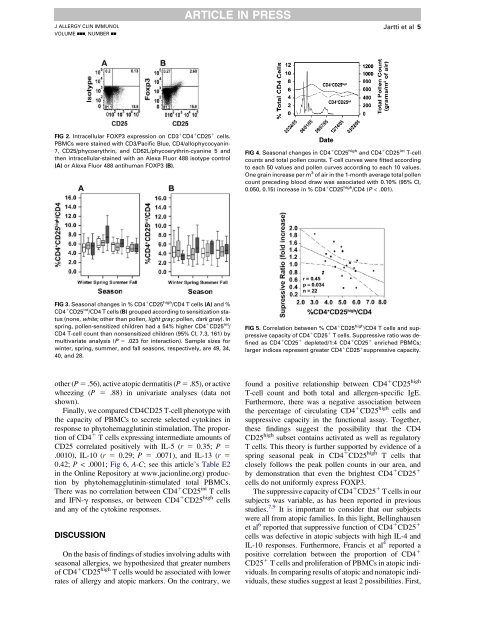
J ALLERGY CLIN IMMUNOLVOLUME nnn, NUMBER nnARTICLE IN PRESSJartti et al 5FIG 2. Intracellular FOXP3 expression on CD3 1 <strong>CD4</strong> 1 <strong>CD25</strong> 1 <strong>cells</strong>.PBMCs were sta<strong>in</strong>ed with CD3/Pacific Blue, <strong>CD4</strong>/allophycocyan<strong>in</strong>-7, <strong>CD25</strong>/phycoerythr<strong>in</strong>, <strong>and</strong> CD62L/phycoerythr<strong>in</strong>-cyan<strong>in</strong>e 5 <strong>and</strong>then <strong>in</strong>tracellular-sta<strong>in</strong>ed with an Alexa Fluor 488 isotype control(A) or Alexa Fluor 488 antihuman FOXP3 (B).FIG 4. Seasonal changes <strong>in</strong> <strong>CD4</strong> 1 <strong>CD25</strong> high <strong>and</strong> <strong>CD4</strong> 1 <strong>CD25</strong> <strong>in</strong>t T-cellcounts <strong>and</strong> total pollen counts. T-cell curves were fitted accord<strong>in</strong>gto each 50 values <strong>and</strong> pollen curves accord<strong>in</strong>g to each 10 values.One gra<strong>in</strong> <strong>in</strong>crease per m 3 of air <strong>in</strong> the 1-month average total pollencount preced<strong>in</strong>g blood draw was associated with 0.10% (95% CI,0.050, 0.15) <strong>in</strong>crease <strong>in</strong> % <strong>CD4</strong> 1 <strong>CD25</strong> high /<strong>CD4</strong> (P < .001).FIG 3. Seasonal changes <strong>in</strong> % <strong>CD4</strong> 1 <strong>CD25</strong> high /<strong>CD4</strong> T <strong>cells</strong> (A) <strong>and</strong> %<strong>CD4</strong> 1 <strong>CD25</strong> <strong>in</strong>t /<strong>CD4</strong> T <strong>cells</strong> (B) grouped accord<strong>in</strong>g to sensitization status(none, white; other than pollen, light gray; pollen, dark gray). Inspr<strong>in</strong>g, pollen-sensitized children had a 54% higher <strong>CD4</strong> 1 <strong>CD25</strong> <strong>in</strong>t /<strong>CD4</strong> T-cell count than nonsensitized children (95% CI, 7.3, 161) bymultivariate analysis (P 5 .023 for <strong>in</strong>teraction). Sample sizes forw<strong>in</strong>ter, spr<strong>in</strong>g, summer, <strong>and</strong> fall seasons, respectively, are 49, 34,40, <strong>and</strong> 28.FIG 5. Correlation <strong>between</strong> % <strong>CD4</strong> 1 <strong>CD25</strong> high /<strong>CD4</strong> T <strong>cells</strong> <strong>and</strong> suppressivecapacity of <strong>CD4</strong> 1 <strong>CD25</strong> 1 T <strong>cells</strong>. Suppressive ratio was def<strong>in</strong>edas <strong>CD4</strong> 1 <strong>CD25</strong> 1 depleted/1:4 <strong>CD4</strong> 1 <strong>CD25</strong> 1 enriched PBMCs;larger <strong>in</strong>dices represent greater <strong>CD4</strong> 1 <strong>CD25</strong> 1 suppressive capacity.other (P 5 .56), active atopic dermatitis (P 5 .85), or activewheez<strong>in</strong>g (P 5 .88) <strong>in</strong> univariate analyses (data notshown).F<strong>in</strong>ally, we compared <strong>CD4</strong><strong>CD25</strong> T-cell phenotype withthe capacity of PBMCs to secrete selected cytok<strong>in</strong>es <strong>in</strong>response to phytohemagglut<strong>in</strong><strong>in</strong> stimulation. The proportionof <strong>CD4</strong> 1 T <strong>cells</strong> express<strong>in</strong>g <strong>in</strong>termediate amounts of<strong>CD25</strong> correlated positively with IL-5 (r 5 0.35; P 5.0010), IL-10 (r 5 0.29; P 5 .0071), <strong>and</strong> IL-13 (r 50.42; P