Coupled Heat and Mass Transfer during Crystallization of MgSO4 ...
Coupled Heat and Mass Transfer during Crystallization of MgSO4 ...
Coupled Heat and Mass Transfer during Crystallization of MgSO4 ...

Create successful ePaper yourself
Turn your PDF publications into a flip-book with our unique Google optimized e-Paper software.
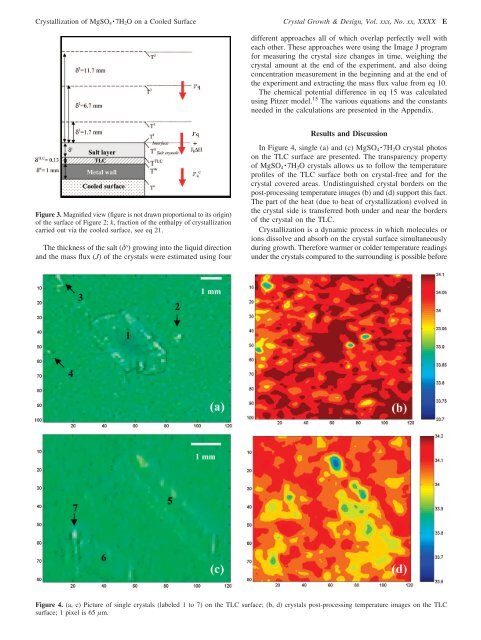
<strong>Crystallization</strong> <strong>of</strong> MgSO 4 · 7H 2 O on a Cooled Surface Crystal Growth & Design, Vol. xxx, No. xx, XXXX Edifferent approaches all <strong>of</strong> which overlap perfectly well witheach other. These approaches were using the Image J programfor measuring the crystal size changes in time, weighing thecrystal amount at the end <strong>of</strong> the experiment, <strong>and</strong> also doingconcentration measurement in the beginning <strong>and</strong> at the end <strong>of</strong>the experiment <strong>and</strong> extracting the mass flux value from eq 10.The chemical potential difference in eq 15 was calculatedusing Pitzer model. 15 The various equations <strong>and</strong> the constantsneeded in the calculations are presented in the Appendix.Figure 3. Magnified view (figure is not drawn proportional to its origin)<strong>of</strong> the surface <strong>of</strong> Figure 2; k, fraction <strong>of</strong> the enthalpy <strong>of</strong> crystallizationcarried out via the cooled surface, see eq 21.The thickness <strong>of</strong> the salt (δ s ) growing into the liquid direction<strong>and</strong> the mass flux (J) <strong>of</strong> the crystals were estimated using fourResults <strong>and</strong> DiscussionIn Figure 4, single (a) <strong>and</strong> (c) MgSO 4 · 7H 2 O crystal photoson the TLC surface are presented. The transparency property<strong>of</strong> MgSO 4 · 7H 2 O crystals allows us to follow the temperaturepr<strong>of</strong>iles <strong>of</strong> the TLC surface both on crystal-free <strong>and</strong> for thecrystal covered areas. Undistinguished crystal borders on thepost-processing temperature images (b) <strong>and</strong> (d) support this fact.The part <strong>of</strong> the heat (due to heat <strong>of</strong> crystallization) evolved inthe crystal side is transferred both under <strong>and</strong> near the borders<strong>of</strong> the crystal on the TLC.<strong>Crystallization</strong> is a dynamic process in which molecules orions dissolve <strong>and</strong> absorb on the crystal surface simultaneously<strong>during</strong> growth. Therefore warmer or colder temperature readingsunder the crystals compared to the surrounding is possible beforeFigure 4. (a, c) Picture <strong>of</strong> single crystals (labeled 1 to 7) on the TLC surface; (b, d) crystals post-processing temperature images on the TLCsurface; 1 pixel is 65 µm.