A regional analysis of fault reactivation and seal integrity using the ...
A regional analysis of fault reactivation and seal integrity using the ...
A regional analysis of fault reactivation and seal integrity using the ...

Create successful ePaper yourself
Turn your PDF publications into a flip-book with our unique Google optimized e-Paper software.
60 Reynolds et al.FIGURE 2. Bight Basin correlation chart showing <strong>the</strong> relationships between sequence stratigraphy <strong>and</strong> basin phases,modified after Totterdell et al. (2003). Distribution <strong>of</strong> source, reservoir, <strong>and</strong> <strong>seal</strong>s in <strong>the</strong> petroleum systems are modifiedafter Totterdell et al. (2000), <strong>and</strong> modeled timing <strong>of</strong> onset <strong>of</strong> expulsion (arrows) are modified after Struckmeyer et al.(2002).
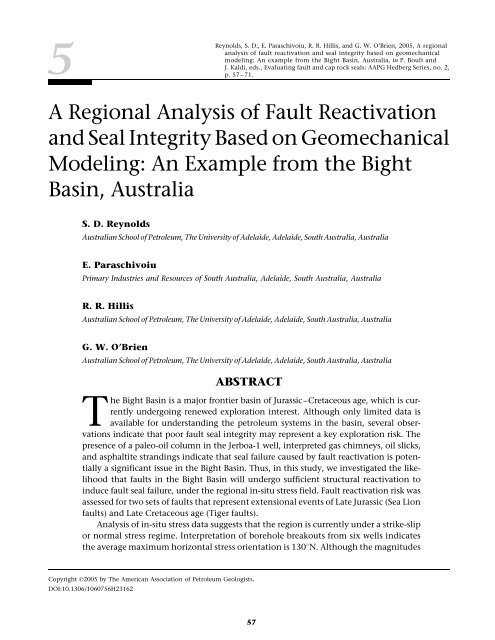
Analysis <strong>of</strong> Fault Reactivation <strong>and</strong> Seal Integrity Based on Geomechanical Modeling 61(Hammerhead system). Oil <strong>and</strong> gas expulsion from <strong>the</strong>Albian to Campanian source rocks is modeled to havebegun during <strong>the</strong> Cenomanian to Maastrichtian, althoughexpulsion continued, in phases, into <strong>the</strong> Tertiary<strong>and</strong> up to <strong>the</strong> Holocene in certain parts <strong>of</strong> <strong>the</strong>basin (Struckmeyer et al., 2001).The exploration wells drilled to date encounteredonly minor oil <strong>and</strong> gas shows, <strong>and</strong> <strong>the</strong> majority <strong>of</strong> intervalsintersected are immature for oil generation.However, <strong>the</strong> source rock quality in <strong>the</strong> deeper parts<strong>of</strong> <strong>the</strong> basin is inferred to range from good to excellent,<strong>and</strong> modeling shows that adequate maturitieswere reached to generate <strong>and</strong> expel liquid <strong>and</strong> gaseoushydrocarbons (Struckmeyer et al., 2001).EMPIRICAL EVIDENCE FORFAULT SEAL FAILURE IN THEBIGHT BASINIdentifying <strong>the</strong> principal exploration uncertaintiesin <strong>the</strong> Bight Basin region is difficult. Several observationsindicate that poor <strong>fault</strong> <strong>seal</strong> <strong>integrity</strong> may representa key exploration risk in <strong>the</strong> Bight Basin. Based onpetrophysical analyses <strong>of</strong> fluid-inclusion samples, Rubleet al. (2001) demonstrated <strong>the</strong> presence <strong>of</strong> a 15-m (49-ft)-thick paleo-oil column in Callovian to Kimmeridgians<strong>and</strong>s in <strong>the</strong> Jerboa-1 well in <strong>the</strong> Eyre subbasin (Figure 3).The hypo<strong>the</strong>sis is that Jerboa-1 was charged, probablyfrom a Late Jurassic–Early Cretaceous petroleum systembut was later breached during a period <strong>of</strong> <strong>fault</strong><strong>reactivation</strong> during <strong>the</strong> Late Cretaceous. Vertical migration<strong>of</strong> hydrocarbons into <strong>the</strong> Tertiary sequencesmay also have occurred subsequent to this Late Cretaceousbreaching (Ruble et al., 2001). The <strong>fault</strong> <strong>reactivation</strong><strong>and</strong> subsequentvertical migration may havebeen <strong>the</strong> result <strong>of</strong> <strong>the</strong> far-fieldeffects <strong>of</strong> <strong>the</strong> collision <strong>of</strong> <strong>the</strong>Australian <strong>and</strong> Asian plates in<strong>the</strong>lateTertiary.O<strong>the</strong>r empirical indicators<strong>of</strong> <strong>seal</strong> failure are presentthroughout <strong>the</strong> Bight Basin.These include <strong>the</strong> presence<strong>of</strong> numerous gas chimneysin <strong>the</strong> Duntroon <strong>and</strong> Cedunasubbasins, some <strong>of</strong> which correlate spatially with watercolumn geochemical sniffer anomalies <strong>and</strong> observations<strong>of</strong> oil slicks across <strong>the</strong> Bight Basin <strong>using</strong> syn<strong>the</strong>tic apertureradar data (Struckmeyer et al., 2002). O<strong>the</strong>r indicatorsinclude <strong>the</strong> well-known presence <strong>of</strong> asphaltitestr<strong>and</strong>ings in <strong>the</strong> region (Sprigg <strong>and</strong> Wooley, 1963;Edwards et al., 1998) <strong>and</strong> colloquial evidence for a relationshipbetween <strong>the</strong> timing <strong>of</strong> earthquakes <strong>and</strong> <strong>the</strong>occurrence <strong>of</strong> major str<strong>and</strong>ings in <strong>the</strong> area. Overall,earthquake activity has been typically focused in <strong>the</strong>Duntroon <strong>and</strong> eastern Ceduna subbasins. Most <strong>of</strong> <strong>the</strong>earthquakes in <strong>the</strong> Bight Basin are shallow, with epicentersin <strong>the</strong> upper 10 km (6 mi) <strong>of</strong> <strong>the</strong> sedimentarysection, <strong>and</strong> many are within <strong>the</strong> top 5 km (3 mi), wellwithin <strong>the</strong> syn- or postrift sections section. Magnitudesare typically in <strong>the</strong> range 2–3.5, with some events ashigh as 4.6 have been recorded on <strong>the</strong> Couedic Shelf.In addition, a series <strong>of</strong> earthquakes with magnitudesranging between 4.2 <strong>and</strong> 5.2 were recorded along <strong>the</strong>far sou<strong>the</strong>rn edge <strong>of</strong> <strong>the</strong> Recherche subbasin. The empiricalevidence for <strong>fault</strong> <strong>seal</strong> failure prompted us toanalyze <strong>the</strong> stress field in <strong>the</strong> Bight Basin <strong>and</strong> investigate<strong>the</strong> likelihood that mapped <strong>fault</strong> arrays in <strong>the</strong>subbasins in <strong>the</strong> region will undergo sufficient structural<strong>reactivation</strong> to induce <strong>fault</strong> <strong>seal</strong> failure.METHODOLOGY FOREVALUATING FAULTREACTIVATION IN THEBIGHT BASINWe have used <strong>the</strong> results <strong>of</strong> <strong>the</strong> in-situ stress field<strong>analysis</strong> in <strong>the</strong> Bight Basin (Reynolds et al., 2003) <strong>and</strong> applied<strong>the</strong> <strong>fault</strong> <strong>analysis</strong> <strong>seal</strong> technology (FAST) techniqueFIGURE 3. Seismic line through<strong>the</strong>breachedtraptestedby<strong>the</strong>Jerboa-1 well in <strong>the</strong> Eyre subbasin,western Bight Basin. Reactivation<strong>fault</strong>s stop at <strong>the</strong> base<strong>of</strong> <strong>the</strong> Tertiary (modified afterTotterdell et al., 2000).
62 Reynolds et al.to determine <strong>the</strong> risk <strong>of</strong> <strong>fault</strong> <strong>reactivation</strong> <strong>of</strong> <strong>the</strong> LateJurassic Sea Lion <strong>fault</strong>s <strong>and</strong> <strong>the</strong> Turonian–Santonian Tiger<strong>fault</strong>s. In <strong>the</strong> FAST technique, <strong>the</strong> risk <strong>of</strong> <strong>fault</strong> <strong>reactivation</strong>is determined <strong>using</strong> <strong>the</strong> stress tensor (Mohr circle)<strong>and</strong> <strong>fault</strong> rock strength (failure envelope). Brittlefailure is predicted along optimally oriented <strong>fault</strong>s if<strong>the</strong> ratio <strong>of</strong> shear to effective normal stress exceeds<strong>the</strong> coefficient <strong>of</strong> frictional sliding, which can be illustratedwhen <strong>the</strong> Mohr circle intersects <strong>the</strong> failureenvelope. All <strong>fault</strong> orientations plot within <strong>the</strong> Mohrcircle, <strong>and</strong> those closest to <strong>the</strong> failure envelope are atgreatest risk <strong>of</strong> <strong>reactivation</strong>. The horizontal distancebetween each <strong>fault</strong> plane <strong>and</strong> <strong>the</strong> failure envelopeindicates <strong>the</strong> increase in pore pressure (P) required tocause <strong>reactivation</strong> <strong>and</strong> is used as <strong>the</strong> measure <strong>of</strong> <strong>the</strong>likelihood <strong>of</strong> <strong>fault</strong> <strong>reactivation</strong> in <strong>the</strong> FAST technique. Asmall P infers a high likelihood <strong>of</strong> <strong>reactivation</strong>, <strong>and</strong>a large P infers a low likelihood <strong>of</strong> <strong>reactivation</strong>. TheP value for each plane can be plotted on a stereonetas poles to planes. The risk <strong>of</strong> <strong>reactivation</strong> <strong>of</strong> any preexisting<strong>fault</strong> orientation is <strong>the</strong>n read from <strong>the</strong> stereonet.A composite Griffith–Coulomb failure envelopehas been assumed in this study. No <strong>fault</strong> rockfailure envelopes are available for <strong>the</strong> area, <strong>and</strong> thus,a cohesive strength <strong>of</strong> 5 MPa <strong>and</strong> friction angle <strong>of</strong> 0.6have been assumed. For a more detailed discussion on<strong>the</strong> FAST methodology, see Mildren et al. (2002) <strong>and</strong>Mildren et al. (2005).The assessment <strong>of</strong> <strong>fault</strong> <strong>reactivation</strong> risk is commonlyappliedatprospectscale,where<strong>the</strong>in-situstressfield is better constrained than at basin scale, <strong>and</strong> depthconverted<strong>fault</strong> geometries are available from seismicinterpretation. However, assessing <strong>fault</strong> <strong>reactivation</strong> ata <strong>regional</strong>, basin scale can follow similar principles, butmore care should be exercised in evaluating <strong>the</strong> <strong>reactivation</strong>risk, because more uncertainty is placed on <strong>the</strong>results when basing <strong>the</strong> interpretation on just one set <strong>of</strong>parameters averaged <strong>and</strong> extrapolated over large areas.Fault <strong>reactivation</strong> predictions presented herein maynot be accurate in areas where <strong>the</strong> <strong>regional</strong> stress fieldhas been perturbed by local structures, such as <strong>fault</strong>s<strong>and</strong> contrasting material properties. The inclusion <strong>of</strong>local stress perturbations is beyond <strong>the</strong> scope <strong>of</strong> thischapter <strong>and</strong> is not actually possible at <strong>the</strong> current level<strong>of</strong> knowledge <strong>of</strong> <strong>the</strong> area.IN-SITU STRESS IN THEBIGHT BASINThe most important step in assessing <strong>the</strong> risk <strong>of</strong>stress-induced <strong>fault</strong> <strong>reactivation</strong> that could lead to <strong>fault</strong><strong>seal</strong> failure is to construct a well-constrained geomechanicalmodel. The geomechanical model consists <strong>of</strong><strong>the</strong> in-situ stress field, <strong>fault</strong> rock properties, <strong>and</strong> porepressure. The in-situ stress field is made up <strong>of</strong> threeprincipal stresses, which are assumed to be <strong>the</strong> verticalstress, <strong>the</strong> maximum horizontal stress, <strong>and</strong> <strong>the</strong> minimumhorizontal stress. This assumption is reasonablegiven <strong>the</strong> generally flat-lying seabed surfaces <strong>of</strong> sedimentarybasins. To define <strong>the</strong> in-situ stress field, <strong>the</strong>orientation <strong>and</strong> magnitude <strong>of</strong> <strong>the</strong> three stress componentsmust be determined.The in-situ stress field was determined from assessing<strong>the</strong> drilling <strong>and</strong> logging data acquired from <strong>the</strong>nine open-file exploration wells drilled in <strong>the</strong> BightBasin (Reynolds et al., 2003). Of <strong>the</strong>se nine wells, six areclustered in a tight group in <strong>the</strong> Duntroon <strong>and</strong> easternCeduna subbasins. To gain a better underst<strong>and</strong>ing <strong>of</strong><strong>the</strong> <strong>regional</strong> stress field in <strong>the</strong> region, additional wellsfrom <strong>the</strong> adjacent Polda Basin were included in thisstudy (Figure 1). Stress information from <strong>the</strong> Australianstress map database was also included in <strong>the</strong>study. The reader is referred to Reynolds et al. (2003)for a more detailed description <strong>of</strong> <strong>the</strong> stress field determinationin <strong>the</strong> Bight Basin.The water depth across <strong>the</strong> Bight Basin ranges fromless than 100 m (3300 ft) on <strong>the</strong> shelf to more than5000 m (16,400 ft) in <strong>the</strong> deepest parts <strong>of</strong> <strong>the</strong> Recherchesubbasin. This variation poses a significant problemwhen attempting to analyze <strong>the</strong> in-situ stress field for<strong>the</strong> entire basin. At any location <strong>and</strong> depth in <strong>the</strong> basin,<strong>the</strong> stress caused by <strong>the</strong> weight <strong>of</strong> <strong>the</strong> water columncontributes to <strong>the</strong> magnitude <strong>of</strong> <strong>the</strong> in-situ stressfield. To overcome <strong>the</strong> problem associated with waterdepth, effective stress (total stress minus pore pressure)has been used in this study, instead <strong>of</strong> <strong>the</strong> total stress,which is more typically used.Stress OrientationsThe maximum horizontal stress (S Hmax ) orientationin <strong>the</strong> Bight Basin was determined by interpreting boreholebreakout directions in logs from a four-arm dipmeter(high-resolution dipmeter tool, HDT) from fourwells <strong>and</strong> image log data (Formation Microscanner, FMS)from two wells. The average S Hmax orientation calculatedfrom <strong>the</strong> six wells is 1308N. The reader is referredto Reynolds et al. (2003) for a more detailed description<strong>of</strong> <strong>the</strong> stress field determination in <strong>the</strong> Bight Basin.The S Hmax orientations for <strong>the</strong> Bight Basin <strong>and</strong> surroundingregions are plotted in Figure 4. Stress orientationscould only be determined for <strong>the</strong> wells that arelocated on <strong>the</strong> eastern side <strong>of</strong> <strong>the</strong> Bight Basin. The averageS Hmax orientation <strong>of</strong> 1308N for <strong>the</strong> available wellsin <strong>the</strong> Bight Basin is consistent with S Hmax orientationsin <strong>the</strong> Otway Basin far<strong>the</strong>r to <strong>the</strong> east (Figure 4).Stress trajectories, which are essentially <strong>regional</strong>ly averagedstress orientations, for <strong>the</strong> Australian stress fieldhave been calculated by Hillis <strong>and</strong> Reynolds (2000) <strong>and</strong>plotted in Figure 4 to obtain a better underst<strong>and</strong>ing <strong>of</strong>
Analysis <strong>of</strong> Fault Reactivation <strong>and</strong> Seal Integrity Based on Geomechanical Modeling 63FIGURE 4. Stress map <strong>of</strong> Australia (A–D quality) including <strong>the</strong> new Bight Basin stress data. Stress trajectory map fromHillis <strong>and</strong> Reynolds (2000) has been plotted to highlight <strong>the</strong> <strong>regional</strong> trends across <strong>the</strong> Australian continent. The S Hmaxorientation for <strong>the</strong> Bight Basin is reasonably consistent with <strong>the</strong> stress trajectories in <strong>the</strong> region. Enlargement: Stressmap <strong>of</strong> <strong>the</strong> Bight Basin showing A–D quality stress indicators. Orientation <strong>of</strong> vector represents <strong>the</strong> S Hmax orientation,<strong>and</strong> length <strong>of</strong> vector represents <strong>the</strong> data quality. Wells with no data or E quality data are represented by a dot. NF =normal <strong>fault</strong>ing stress regime; SS = strike-slip <strong>fault</strong>ing stress regime; TF = reverse (thrust) <strong>fault</strong>ing stress regime; U = unknownstress regime.<strong>the</strong> <strong>regional</strong> stress field over <strong>the</strong> entire Bight Basin. Thepreviously calculated stress trajectories on <strong>the</strong> easternside <strong>of</strong> <strong>the</strong> Bight Basin are consistent with <strong>the</strong> new S Hmaxorientation determined from <strong>the</strong> wells in <strong>the</strong> region. On<strong>the</strong> western side <strong>of</strong> <strong>the</strong> Bight Basin, <strong>the</strong> stress trajectoriesindicate a more east–west orientation, which is causedby <strong>the</strong> influence <strong>of</strong> <strong>the</strong> east–west S Hmax orientation in<strong>the</strong> Perth region to <strong>the</strong> west (Hillis <strong>and</strong> Reynolds, 2000;Reynolds <strong>and</strong> Hillis, 2000). Because <strong>of</strong> <strong>the</strong> lack <strong>of</strong> availabledata in <strong>the</strong> western Bight Basin, we are unable toverify if <strong>the</strong> S Hmax orientation rotates to an east–westorientation in <strong>the</strong> western part <strong>of</strong> <strong>the</strong> Bight Basin. Assuch, we have used <strong>the</strong> average S Hmax orientation <strong>of</strong>1308N for <strong>the</strong> entire Bight Basin. Additional drilling in<strong>the</strong> western Bight Basin would allow <strong>the</strong> true stressorientations in that area to be determined.
64 Reynolds et al.Vertical Stress MagnitudeThe vertical or overburden stress (S v ) at a specifieddepth can be equated with <strong>the</strong> pressure exerted by <strong>the</strong>weight <strong>of</strong> <strong>the</strong> overlying rocks <strong>and</strong> expressed asS v ¼Z zrðzÞgdzð1Þ0where r(z) is <strong>the</strong> density <strong>of</strong> <strong>the</strong> overlying rock columnat depth z, <strong>and</strong> g is <strong>the</strong> acceleration caused by gravity.Vertical stress magnitudes were determined <strong>using</strong> densitylog data for a total <strong>of</strong> 10 wells in <strong>the</strong> Bight <strong>and</strong>Polda basins. The density logs were initially filteredfor bad hole conditions <strong>using</strong> <strong>the</strong> bulk density correctiondensity (DRHO) <strong>and</strong> <strong>the</strong> caliper data. Verticalstress calculations require that <strong>the</strong> density log be integratedfrom <strong>the</strong> surface (here sea level, assuming <strong>the</strong>water column has a density <strong>of</strong> 1.03 g/cm 3 ). However,<strong>the</strong> density logs are not commonly run from <strong>the</strong> surface.The average density from <strong>the</strong> surface to <strong>the</strong> top<strong>of</strong> <strong>the</strong> density log run can be estimated by convertingcheck-shot velocity data to density <strong>using</strong> <strong>the</strong> Nafe–Drake velocity-density transform (Ludwig et al., 1970).To account for <strong>the</strong> variation in water depth, <strong>the</strong> verticalstress pr<strong>of</strong>iles have been calculated as effectivevertical stress (S v 0 ), assuming normally pressured sediments(Figure 5). The effective vertical stress in <strong>the</strong>Bight Basin is closely approximated by <strong>the</strong> power lawfunctionS v 0 ¼ 10:46z 1:179ð2Þwhere effective vertical stress is in megapascals <strong>and</strong> z is<strong>the</strong> depth in kilometers below seabed.Minimum Horizontal Stress MagnitudeA total <strong>of</strong> seven leak-<strong>of</strong>f tests <strong>and</strong> eight formation<strong>integrity</strong> tests were performed in four wells over <strong>the</strong>Bight region. Formation <strong>integrity</strong> tests are not reliableindicators <strong>of</strong> <strong>the</strong> minimum horizontal stress,becausen<strong>of</strong>ractureiscreatedat<strong>the</strong>wellborewall,<strong>and</strong> hence, <strong>the</strong>y were not used to constrain <strong>the</strong> minimumhorizontal stress magnitude. The reliable leak<strong>of</strong>ftest pressures were plotted along with <strong>the</strong> formation<strong>integrity</strong> tests as effective stress magnitudes tocompare wells in varying water depths. The lowerbound to <strong>the</strong> effective pressures from <strong>the</strong> leak-<strong>of</strong>f testssuggests that <strong>the</strong> effective minimum horizontal stress0(S hmin ) gradient is approximately 6 MPa/km. Because<strong>of</strong> <strong>the</strong> lack <strong>of</strong> leak-<strong>of</strong>f data, especially below 2000 m0(6600 ft), <strong>the</strong> S hmin gradient for <strong>the</strong> Bight Basin cannotbe well constrained. Never<strong>the</strong>less, it is clear fromFIGURE 5. Effective vertical stress magnitudes from seabedfor <strong>the</strong> Bight Basin. A power law function has been used toapproximate <strong>the</strong> effective vertical stress.0<strong>the</strong> results obtained that <strong>the</strong> magnitude <strong>of</strong> S hmin is less0than that <strong>of</strong> S v (Figure 6). Hence, <strong>the</strong> Bight Basin is0 0 0ei<strong>the</strong>r in a strike-slip <strong>fault</strong>ing (S hmin < S v < S Hmax )or0 0normal <strong>fault</strong>ing (S hmin < S Hmax < S 0 v ) stress regime.Maximum Horizontal Stress MagnitudeThe magnitude <strong>of</strong> S Hmax is <strong>the</strong> most difficult component<strong>of</strong> <strong>the</strong> stress tensor to quantify. Many <strong>of</strong> <strong>the</strong>methods commonly applied for constraining S Hmaxcould not be applied in <strong>the</strong> Bight Basin because <strong>of</strong> a lack<strong>of</strong> relevant data. The occurrence <strong>of</strong> borehole breakouts<strong>and</strong> drilling-induced tensile fractures could not be usedto constrain S Hmax because drilling-induced tensile fracturewas not present in <strong>the</strong> image logs, <strong>and</strong> rock strengthdata were not available. Hydraulic fracture test-basedtechniques could not be applied because no extendedleak-<strong>of</strong>f tests or minifracture tests have been undertaken.None<strong>the</strong>less, broad limits can be placed on S Hmaxbased on <strong>the</strong> frictional limits to stress beyond which
Analysis <strong>of</strong> Fault Reactivation <strong>and</strong> Seal Integrity Based on Geomechanical Modeling 65optimally oriented, preexisting <strong>fault</strong> (Sibson, 1974;Jaeger <strong>and</strong> Cook, 1979; Zoback <strong>and</strong> Healy, 1984).The frictional limit to stress is given byS 10S 30 qffiffiffiffiffiffiffiffiffiffiffiffiffiffiffi 2ðm 2 þ 1Þþmð3Þwhere m is <strong>the</strong> coefficient <strong>of</strong> friction that <strong>the</strong> crust cansupport until an optimally oriented preexisting <strong>fault</strong>slips to regulate <strong>the</strong> stress magnitudes; S 1 0 is <strong>the</strong> effectivemaximum principal stress; <strong>and</strong> S 3 0 is <strong>the</strong> effectiveminimum principal stress.For a typical value <strong>of</strong> m = 0.6,S 10S 30 3:12ð4ÞFIGURE 6. Effective stress-depth plots for <strong>the</strong> Bight Basin.0S hmin is represented by <strong>the</strong> lower bound to effective0pressures from leak-<strong>of</strong>f tests, <strong>and</strong> S Hmax has been determinedfrom frictional limits. S v has been calculated <strong>using</strong>0<strong>the</strong> power function described by equation 2. LOT = leak<strong>of</strong>ftest; FIT = formation <strong>integrity</strong> test.<strong>fault</strong>ing occurs. The magnitude <strong>of</strong> <strong>the</strong> effective maximumhorizontal stress (S Hmax ) was calculated to re-0move <strong>the</strong> effect <strong>of</strong> <strong>the</strong> water depth. The magnitude <strong>of</strong>0S Hmax can be constrained by assuming that <strong>the</strong>ratio <strong>of</strong> <strong>the</strong> maximum to minimum effective stresscannot exceed that required to cause <strong>fault</strong>ing on anThis relationship can be used to estimate <strong>the</strong> magnitude<strong>of</strong> S Hmax in seismically active regions (Zoback0<strong>and</strong> Healy, 1984) <strong>and</strong> could provide an upper bound0to S Hmax in <strong>the</strong> relatively seismically passive regionssuch as <strong>the</strong> Bight Basin.0In <strong>the</strong> Bight Basin, S hmin is most likely less than0<strong>the</strong> effective vertical stress, implying that S hmin = S 0 3 .0The frictional limits to S Hmax have been determinedfollowing equation 4 <strong>and</strong> are shown in Figure 6, assumingnormally pressured sediments. The maximum0S Hmax gradient, based on frictional limits, is 18.7 MPa/0 0 0km, implying a strike-slip <strong>fault</strong>ing (S hmin < S v < S Hmax )0 0stress regime. A normal <strong>fault</strong>ing (S hmin < S Hmax < S 0 v )stress regime cannot be ruled out, however, because <strong>of</strong>0<strong>the</strong> lack <strong>of</strong> data constraining <strong>the</strong> magnitude <strong>of</strong> S Hmax .Consequently, in our <strong>analysis</strong> <strong>of</strong> <strong>fault</strong> <strong>reactivation</strong> <strong>and</strong><strong>seal</strong> breach risk, three cases (Table 1) have been considered:a strike-slip <strong>fault</strong>ing (S hmin < S v < S Hmax ) stress0 0 000regime case, a normal <strong>fault</strong>ing (S hmin < S Hmax < S 0 v )stress regime case, <strong>and</strong> a case on <strong>the</strong> boundary <strong>of</strong> strikeslip-normal<strong>fault</strong>ing stress regimes. The magnitude <strong>of</strong><strong>the</strong> in-situ stress field for <strong>the</strong> three cases was determinedat a depth <strong>of</strong> 1000 m (3300 ft) below seabed.Pore PressurePore pressure measurements were only conductedin <strong>the</strong> Jerboa-1 <strong>and</strong> Greenly-1 wells. Repeat formationtests (RFTs) in <strong>the</strong> two wells indicate hydrostatic poreTABLE 1. Parameters used in <strong>the</strong> three cases to model <strong>fault</strong> <strong>reactivation</strong> <strong>and</strong> <strong>seal</strong> <strong>integrity</strong> in <strong>the</strong>0Bight Basin. The cases cover a range <strong>of</strong> possible values <strong>of</strong> S Hmax within <strong>the</strong> frictional limits. Themagnitude values have been calculated for a depth <strong>of</strong> 1000 m (3300 ft) below seabed.Case0S Hmax(MPa) S v0(MPa)0S hmin(MPa) Fault Regime S Hmax OrientationI 18.7 10.5 6.0 strike slip 1308NII 10.5 10.5 6.0 strike slip-normal 1308NIII 8.5 10.5 6.0 normal 1308N
66 Reynolds et al.pressures to a depth <strong>of</strong> approximately 3600 m (11,800 ft)(10.2 MPa/km). Below 3600 m (11,800 ft), <strong>the</strong> RFT measurementsin Greenly-1 indicate a moderate overpressure<strong>of</strong> 11.8 MPa/km. To obtain a better underst<strong>and</strong>ing <strong>of</strong> <strong>the</strong>pore-pressure distribution, <strong>the</strong> mud weights have beenconsidered as an indicator for pore pressure (Figure 7).In general, most <strong>of</strong> <strong>the</strong> region is normally pressured, withonly a small indication <strong>of</strong> overpressure below 3600 m(11,800 ft) in Greenly-1. Hydrostatic pressures are assumedin our <strong>analysis</strong> <strong>of</strong> <strong>fault</strong> <strong>reactivation</strong> risk.FAULT REACTIVATION ANDSEAL INTEGRITY IN THEBIGHT BASINIn case I (strike-slip stress regime), vertical <strong>fault</strong>sstriking between approximately 100 <strong>and</strong> 1608N are <strong>the</strong>most likely to be reactivated (Figure 8b). Hence, trapsrequiring such <strong>fault</strong>s to be <strong>seal</strong>ing are <strong>the</strong> most likelyto be breached in <strong>the</strong> in-situ stress field. Vertical <strong>fault</strong>sstriking 1308N are located between that conjugate shearpair <strong>and</strong> are also at high risk <strong>of</strong> <strong>reactivation</strong> <strong>and</strong> breach.Faults striking between 75 <strong>and</strong> 1808N show little reductionin <strong>the</strong>ir risk <strong>of</strong> <strong>reactivation</strong> with decreasing dip untilshallow dips (
Analysis <strong>of</strong> Fault Reactivation <strong>and</strong> Seal Integrity Based on Geomechanical Modeling 67FIGURE 8. Risk <strong>of</strong> <strong>fault</strong> <strong>reactivation</strong>. (a) Location in stress space <strong>of</strong> <strong>the</strong> three in-situ stress cases evaluated (Table 1).(b–d) Left-h<strong>and</strong> side is Mohr’s circle <strong>of</strong> stress <strong>and</strong> failure envelope (assumed) used to calculate <strong>the</strong> likelihood <strong>of</strong> <strong>reactivation</strong>for each case. Right-h<strong>and</strong> side is <strong>the</strong> likelihood <strong>of</strong> <strong>fault</strong> <strong>and</strong> fracture plane <strong>reactivation</strong>, represented as polesto planes, for <strong>the</strong> three cases (Table 1). Numerical values on scale refer to increase in fluid pressure required to cause<strong>reactivation</strong> (P). Equal-angle, lower hemisphere stereographic projection <strong>of</strong> poles to planes.accurate assessment <strong>of</strong> <strong>the</strong> <strong>fault</strong> <strong>reactivation</strong> risk is notpossible based on available information, some trendscan be established <strong>and</strong> discussed. Several precautionsare required when assessing <strong>the</strong> results from this study.First, hydrostatic pressures are assumed in our <strong>analysis</strong><strong>of</strong> <strong>fault</strong> <strong>reactivation</strong> risk, <strong>and</strong> hence, in areas where overpressuresare anticipated, <strong>the</strong>se predictions would needto be modified. Second, given <strong>the</strong> complex history <strong>of</strong>changes in <strong>the</strong> stress field that controls <strong>the</strong> structuralevolution <strong>of</strong> sedimentary basins, <strong>the</strong> in-situ stress field, asconstrained herein, cannot be extrapolated back in time<strong>and</strong> applied to previous structural events. Knowledge <strong>of</strong><strong>the</strong> in-situ stress field can only elucidate contemporarytectonic events.As shown in <strong>the</strong> previous section, <strong>fault</strong>s that dip at258 (Figures 8, 9) have little risk <strong>of</strong> <strong>reactivation</strong>, irrespective<strong>of</strong> <strong>the</strong> <strong>fault</strong> orientation <strong>and</strong> <strong>the</strong> type <strong>of</strong> stressfield present. However, as <strong>the</strong> dips increase to 408, itbecomes apparent that <strong>the</strong> risk <strong>of</strong> <strong>fault</strong> <strong>seal</strong> failure becomesgreater in <strong>the</strong> northwest-trending <strong>fault</strong> arrays in<strong>the</strong> Ceduna subbasin. In contrast, <strong>the</strong> more east- tonor<strong>the</strong>ast-trending <strong>fault</strong>s in <strong>the</strong> Eyre subbasin are atlow risk <strong>of</strong> <strong>reactivation</strong>. At dips <strong>of</strong> 558, <strong>the</strong> risk <strong>of</strong> <strong>fault</strong><strong>seal</strong> failure appears to be low in <strong>the</strong> Eyre subbasin,where <strong>the</strong> <strong>fault</strong>s have a generally nor<strong>the</strong>ast trend. However,in <strong>the</strong> more northwest-trending <strong>fault</strong> arrays, <strong>the</strong>risk <strong>of</strong> <strong>reactivation</strong> is much higher, especially in a strikeslipstress regime. An exception is <strong>the</strong> small, east–westtrending,intrabasinal Sea Lion <strong>fault</strong>s that occur in<strong>the</strong> overall, northwest-trending Sea Lion <strong>fault</strong>s in <strong>the</strong>Ceduna subbasin. These <strong>fault</strong>s have a low risk <strong>of</strong> <strong>reactivation</strong>compared to <strong>the</strong> northwest-trending <strong>fault</strong>s thatdominate this part <strong>of</strong> <strong>the</strong> Bight Basin. At <strong>fault</strong> dips <strong>of</strong>708, a high risk <strong>of</strong> <strong>reactivation</strong> <strong>of</strong> <strong>the</strong> northwesttrending<strong>fault</strong> sets <strong>of</strong> <strong>the</strong> Ceduna subbasin is presentfor all stress regimes. The exception is again <strong>the</strong> small,more east–west-trending <strong>fault</strong> arrays. The Eyre subbasinappears to have a low risk <strong>of</strong> <strong>reactivation</strong>, particularly
68 Reynolds et al.
Analysis <strong>of</strong> Fault Reactivation <strong>and</strong> Seal Integrity Based on Geomechanical Modeling 69in <strong>the</strong> strike-slip-normal <strong>and</strong> strike slip stress regimes. Itshould be noted, however, that stress trajectories calculatedfrom <strong>the</strong> Australian stress map database indicate amore east–west S Hmax orientation for <strong>the</strong> Eyre subbasinthan <strong>the</strong> 1308N S Hmax orientation used for our calculations.Therefore, <strong>the</strong> results for <strong>the</strong> Eyre subbasin shouldbe used with care.Overall, <strong>the</strong> results suggest that in a strike-slipnormalor normal stress regime, little risk <strong>of</strong> <strong>reactivation</strong>exists for <strong>fault</strong> systems that trend east–west ornor<strong>the</strong>ast. For <strong>the</strong>se <strong>fault</strong> trends, almost no sensitivityto <strong>fault</strong> dip is present. Clearly, <strong>the</strong> rift <strong>fault</strong>s <strong>of</strong> <strong>the</strong> Eyresubbasin <strong>and</strong> <strong>the</strong> intrabasinal, east–west-trending <strong>fault</strong>s<strong>of</strong> <strong>the</strong> Ceduna subbasin all have a low risk <strong>of</strong> <strong>fault</strong> <strong>reactivation</strong>.In contrast, <strong>the</strong> results suggest that <strong>the</strong> rift<strong>and</strong> postrift <strong>fault</strong>s <strong>of</strong> <strong>the</strong> Ceduna subbasin <strong>and</strong>, by inference,<strong>the</strong> Duntroon subbasin have a relatively highrisk <strong>of</strong> <strong>reactivation</strong> once dips exceed approximately 408for ei<strong>the</strong>r a strike-slip-normal or normal stress regime.Traps with <strong>the</strong> lowest risk in <strong>the</strong> Ceduna <strong>and</strong> Duntroonsubbasins with respect to <strong>reactivation</strong> are those withlower (]408) dips on <strong>the</strong> bounding <strong>fault</strong>s or those with amore east–west orientation.If we consider earthquake data, it appears that<strong>the</strong> most common earthquakes occur in <strong>the</strong> easternCeduna subbasin <strong>and</strong> in <strong>the</strong> Duntroon subbasin, broadlythrough <strong>the</strong> area with northwest-trending <strong>fault</strong> arrays.However,<strong>the</strong>rest<strong>of</strong><strong>the</strong>Bightappearstobelargelyaseismic, <strong>and</strong> this may suggest that <strong>the</strong> stress regime in<strong>the</strong> central <strong>and</strong> western Bight is less conducive to <strong>reactivation</strong>.Thus, <strong>the</strong> trends <strong>of</strong> <strong>fault</strong> <strong>reactivation</strong> riskdetermined herein appear broadly consistent with <strong>the</strong>earthquake data.The distribution <strong>of</strong> oil slicks that have been mappedin <strong>the</strong> region (Struckmeyer et al., 2002) via <strong>the</strong> use <strong>of</strong>satellite-based syn<strong>the</strong>tic aperture radar are generallymore common in <strong>the</strong> deep-water Ceduna subbasin<strong>and</strong> eastern parts <strong>of</strong> <strong>the</strong> Bight Basin, along <strong>the</strong> northwest<strong>fault</strong> arrays. Seismic gas chimneys are very commonin <strong>the</strong> eastern Ceduna <strong>and</strong> Duntroon subbasins<strong>and</strong> correlate spatially with water column sniffer anomalies.These chimneys typically relate to <strong>the</strong> northwesttrending<strong>fault</strong> arrays in <strong>the</strong> region, so this may supportsome loss <strong>of</strong> <strong>fault</strong> <strong>seal</strong> <strong>integrity</strong> in this area.Interestingly, <strong>the</strong> only confirmed paleo-oil columnin <strong>the</strong> region was located in <strong>the</strong> Jerboa-1 well in <strong>the</strong> Eyresubbasin. This area is predicted, under <strong>the</strong> present-daystress regime, to be <strong>of</strong> high <strong>fault</strong> <strong>seal</strong> <strong>integrity</strong>. However,this trap was actually breached in <strong>the</strong> Late Cretaceous(Ruble et al., 2001). This emphasizes <strong>the</strong> factthat <strong>the</strong> stress predictions only relate to <strong>the</strong> presentday <strong>and</strong> not to paleo<strong>reactivation</strong> events, when <strong>the</strong>stresses may have been quite different. It also emphasizes<strong>the</strong> fact that <strong>the</strong> timing <strong>of</strong> hydrocarbon migration(<strong>and</strong> probably <strong>the</strong> nature <strong>of</strong> <strong>the</strong> hydrocarboncharge) is very important in relation to trap <strong>reactivation</strong>.Relatively low to moderate <strong>fault</strong> <strong>seal</strong> <strong>integrity</strong>may be beneficial in regions that are now experiencinga high gas charge because this may help to reduce<strong>the</strong> risk <strong>of</strong> gas flushing in traps in such areas, whichwere previously charged with oil (O’Brien <strong>and</strong> Woods,1995).These observations highlight <strong>the</strong> fact that <strong>the</strong>results presented here should not be used in isolation.It does appear clear that relatively steeply dipping<strong>fault</strong>s with a generally northwest trend will be proneto <strong>reactivation</strong>, whereas more east–west- or nor<strong>the</strong>asttrending<strong>fault</strong>s are unlikely to become reactivated, irrespective<strong>of</strong> dip. To better determine how critical <strong>the</strong>present-day stress environment is to hydrocarbon prospectivityin <strong>the</strong> Bight Basin, a complete <strong>fault</strong> <strong>seal</strong> assessmentthat should take into consideration suchobservations should be integrated with o<strong>the</strong>r aspects<strong>of</strong> <strong>the</strong> petroleum system, such as <strong>the</strong> generation history,remote-sensing results, <strong>and</strong> direct hydrocarbonindicator mapping.For individual traps, <strong>the</strong> assessment <strong>of</strong> <strong>fault</strong> breachingrisk requires detailed prospect studies, so that a geomechanical<strong>analysis</strong> can be applied to clearly defined,depth-converted <strong>fault</strong> planes interpreted from seismicdata. In addition, in-situ stress field characteristicsshould be based on fieldwide measurements <strong>and</strong> <strong>the</strong>failure envelope constrained by properties specific to<strong>the</strong> analyzed rocks.ACKNOWLEDGMENTSSpecial thanks to Jennie Totterdell <strong>and</strong> Barry Bradshaw<strong>of</strong> Geoscience Australia for permission to use<strong>the</strong>ir <strong>fault</strong> interpretation <strong>and</strong> for providing <strong>the</strong> digital<strong>fault</strong> files, to Peter Boult for valuable comments <strong>and</strong>suggestions, <strong>and</strong> to Primary Industries <strong>and</strong> Resources<strong>of</strong> South Australia Publishing Services for assistancewith graphic files. Fugro Multi Client Services arethanked for permission to publish <strong>the</strong> seismic imagein Figure 3. We thank David Castillo, Isabelle Moretti,<strong>and</strong> Signe Ottesen for <strong>the</strong>ir constructive comments regardingthis manuscript.FIGURE 9. Fault <strong>reactivation</strong> risks calculated <strong>using</strong> FAST technique applied to Sea Lion <strong>and</strong> Tiger <strong>fault</strong> polygons shownin Figure 1, assuming constant dips <strong>of</strong> 25, 40, 55, <strong>and</strong> 708, respectively, for (a) case I (strike-slip stress regime) <strong>and</strong>(b) case III (normal stress regime). Results should be used with care in <strong>the</strong> western part <strong>of</strong> <strong>the</strong> Bight Basin <strong>and</strong> in areas<strong>of</strong> overpressure.
70 Reynolds et al.REFERENCES CITEDBlevin, J. E., J. M. Totterdell, G. A. Logan, J. M. Kennard,H. I. M. Struckmeyer, <strong>and</strong> J. B. Colwell, 2000, Hydrocarbonprospectivity <strong>of</strong> <strong>the</strong> Bight Basin— Petroleumsystems <strong>analysis</strong> in a frontier basin, in 2ndSprigg Symposium— Frontier Basins, Frontier Ideas,Adelaide, June 29–30, 2000: Geological Society <strong>of</strong>Australia, Abstracts no. 60, p. 24–29.Castillo, D. A., R. R. Hillis, K. Asquith, <strong>and</strong> M. Fisher,1998, State <strong>of</strong> stress in <strong>the</strong> Timor Sea area, based ondeep wellbore observations <strong>and</strong> frictional failure criteria:Application to <strong>fault</strong>-trap <strong>integrity</strong>, in P. G.Purcell <strong>and</strong> R. R. Purcell, eds., The sedimentary basins<strong>of</strong> Western Australia: 2. Proceedings <strong>of</strong> PetroleumExploration Society <strong>of</strong> Australia Symposium, Perth:p. 326–341.Castillo, D. A., D. J. Bishop, I. Donaldson, D. Kuek, M. deRuig, M. Trupp, <strong>and</strong> M. W. Shuster, 2000, Trap <strong>integrity</strong>in <strong>the</strong> Laminaria high–Nancar trough region,Timor Sea: Prediction <strong>of</strong> <strong>fault</strong> <strong>seal</strong> failure <strong>using</strong> wellconstrainedstress tensors <strong>and</strong> <strong>fault</strong> surfaces interpretedfrom 3D seismic: Australian Petroleum Production<strong>and</strong> Exploration Association Journal, v. 40,p. 151–173.de Ruig, M. J., M. Trupp, D. J. Bishop, D. Kuek, <strong>and</strong> D. A.Castillo, 2000, Fault architecture <strong>and</strong> <strong>the</strong> mechanics<strong>of</strong> <strong>fault</strong> <strong>reactivation</strong> in <strong>the</strong> Nancar trough/Laminariaarea <strong>of</strong> <strong>the</strong> Timor Sea, Nor<strong>the</strong>rn Australia: AustralianPetroleum Production <strong>and</strong> Exploration AssociationJournal, v. 40, p. 174–193.Edwards, D., D. M. McKirdy, <strong>and</strong> R. E. Summons, 1998,Enigmatic asphaltites from <strong>the</strong> sou<strong>the</strong>rn Australianmargin: Molecular <strong>and</strong> carbon isotopic composition:Petroleum Exploration Society <strong>of</strong> Australia Journal,v. 26, p. 106–129.Finkbeiner, T., M. Zoback, P. Flemings, <strong>and</strong> B. Stump,2001, Stress, pore pressure, <strong>and</strong> dynamically constrainedhydrocarbon columns in <strong>the</strong> South EugeneIsl<strong>and</strong> 330 field, nor<strong>the</strong>rn Gulf <strong>of</strong> Mexico: AAPGBulletin, v. 85, p. 1007–1031.Gaarenstroom, L., R. A. J. Tromp, M. C. D. Jong, <strong>and</strong> A. M.Br<strong>and</strong>enburg, 1993, Overpressures in <strong>the</strong> CentralNorth Sea: Implications for trap <strong>integrity</strong> <strong>and</strong> drillingsafety, in J. Parker, ed., Petroleum geology <strong>of</strong> northwestEurope: Proceedings <strong>of</strong> <strong>the</strong> 4th Conference, GeologicalSociety (London): p. 1305–1313.Hillis, R. R., 1998, Mechanisms <strong>of</strong> dynamic <strong>seal</strong> failure in<strong>the</strong> Timor Sea <strong>and</strong> central North Sea basins, in P. G.Purcell <strong>and</strong> R. R. Purcell, eds., The sedimentary basins<strong>of</strong> Western Australia: 2. Proceedings <strong>of</strong> <strong>the</strong> PetroleumExploration Society <strong>of</strong> Australia Symposium, Perth,Western Australia: p. 313–324.Hillis, R. R., <strong>and</strong> S. D. Reynolds, 2000, The Australianstress map: Journal <strong>of</strong> <strong>the</strong> Geological Society (London),v. 157, p. 915–921.Jaeger, J. C., <strong>and</strong> N. G. W. Cook, 1979, Fundamentals <strong>of</strong>rock mechanics: London, United Kingdom, Chapman<strong>and</strong> Hall, 593 p.Jones,R.M.,P.Boult,R.R.Hillis,S.D.Mildren,<strong>and</strong>J.Kaldi, 2000, Integrated hydrocarbon <strong>seal</strong> evaluationin <strong>the</strong> Penola trough, Otway Basin: Australian PetroleumProduction <strong>and</strong> Exploration AssociationJournal, v. 40, p. 194–211.Ludwig, W. J., J. E. Nafe, <strong>and</strong> C. L. Drake, 1970, Seismicrefraction, in A. E. Maxwell, ed., The sea: Ideas <strong>and</strong>observations on progress in <strong>the</strong> study <strong>of</strong> <strong>the</strong> seas,New concepts <strong>of</strong> sea floor evolution: New York, Wiley-Interscience, v. 4, p. 53–84.Mildren, S. D., R. R. Hillis, <strong>and</strong> J. Kaldi, 2002, Calibratingpredictions <strong>of</strong> <strong>fault</strong> <strong>seal</strong> <strong>reactivation</strong> in <strong>the</strong> Timor Sea:Australian Petroleum Production <strong>and</strong> ExplorationAssociation Journal, v. 42, p. 187–202.Mildren S. D., R. R. Hillis, D. N. Dewhurst, P. J. Lyon, J. J.Meyer, <strong>and</strong> P. J. Boult, 2005, FAST: A new techniquefor geomechanical assessment <strong>of</strong> <strong>the</strong> risk <strong>of</strong> <strong>reactivation</strong>-relatedbreach <strong>of</strong> <strong>fault</strong> <strong>seal</strong>s, in P. Boult <strong>and</strong> J.Kaldi, eds., Evaluating <strong>fault</strong> <strong>and</strong> cap rock <strong>seal</strong>s: AAPGHedberg Series, no. 2, p. 73–85.O’Brien, G. W., <strong>and</strong> E. P. Woods, 1995, Hydrocarbonrelateddiagenetic zones (HRDZs) in <strong>the</strong> Vulcan subbasin,Timor Sea: Recognition <strong>and</strong> exploration implications:Australian Petroleum <strong>and</strong> ExplorationAssociation Journal, v. 35, p. 220–252.Reynolds, S. D., <strong>and</strong> R. R. Hillis, 2000, The in situ stressfield <strong>of</strong> <strong>the</strong> Perth Basin, Australia: Geophysical ResearchLetters, v. 27, p. 3421–3424.Reynolds, S., R. Hillis, <strong>and</strong> E. Paraschivoiu, 2003, In situstress field, <strong>fault</strong> <strong>reactivation</strong> <strong>and</strong> <strong>seal</strong> <strong>integrity</strong> in <strong>the</strong>Bight Basin, South Australia: Exploration Geophysics,v. 34, p. 174–181.Ruble, T. E., G. A. Logan, J. E. Blevin, H. I. M. Struckmeyer,K. Liu, M. Ahmed, P. J. Eadington, <strong>and</strong> R. A.Quezada, 2001, Geochemistry <strong>and</strong> charge history <strong>of</strong> apaleo-oil column: Jerboa-1, Eyre sub-basin, GreatAustralian Bight, in K. C. Hill <strong>and</strong> T. Bernecker, eds.,Eastern Australasian Basins Symposium. A refocusedenergy perspective for <strong>the</strong> future: Petroleum ExplorationSociety <strong>of</strong> Australia Special Publication,p. 521–529.Sibson, R. H., 1974, Frictional constraints on thrust,wrench <strong>and</strong> normal <strong>fault</strong>s: Nature, v. 249, p. 542–544.Sprigg, R. C., <strong>and</strong> J. B. Wooley, 1963, Coastal bitumen inSouth Australia with special reference to observationsat Geltwood beach, south-eastern South Australia:Transactions <strong>of</strong> <strong>the</strong> Royal Society <strong>of</strong> South Australia,v. 86, p. 67–103.Struckmeyer, H. I. M., J. M. Totterdell, J. E. Blevin, G. A.Logan, C. J. Boreham, I. Deighton, A. A. Krassay, <strong>and</strong>M. T. Bradshaw, 2001, Character, maturity <strong>and</strong> distribution<strong>of</strong> potential Cretaceous oil source rocksin <strong>the</strong> Ceduna sub-basin, Bight Basin, Great AustralianBight, in K. C. Hill <strong>and</strong> T. Bernecker, eds., EasternAustralasian Basins Symposium: A refocusedenergy perspective for <strong>the</strong> future: Petroleum ExplorationSociety <strong>of</strong> Australia Special Publication, p. 543–552.Struckmeyer, H. I. M., A. K. Williams, R. Cowley, J. M.Totterdell, G. Lawrence, <strong>and</strong> G. W. O’Brien, 2002,Evaluation <strong>of</strong> hydrocarbon migration <strong>and</strong> seepage in
Analysis <strong>of</strong> Fault Reactivation <strong>and</strong> Seal Integrity Based on Geomechanical Modeling 71<strong>the</strong> Great Australian Bight: Australian PetroleumProduction <strong>and</strong> Exploration Association Journal,v. 42, p. 371–384.Totterdell, J. M., J. E. Blevin, H. I. M. Struckmeyer, B. E.Bradshaw, J. B. Colwell, <strong>and</strong> J. M. Kennard, 2000, Anew sequence framework for <strong>the</strong> Great AustralianBight: Starting with a clean slate: Australian PetroleumProduction <strong>and</strong> Exploration Association Journal,v. 40, p. 95–117.Totterdell, J. M., B. E. Bradshaw, J. B. Willcox, 2003,Structural <strong>and</strong> tectonic setting, in G. W. O’Brien, E.Paraschivoiu, <strong>and</strong> J. E. Hibburt, eds., Petroleum geology<strong>of</strong> South Australia, v. 5: Great Australian Bight,South Australia, Department <strong>of</strong> Primary Industries<strong>and</strong> Energy Resources: Petroleum Geology <strong>of</strong> SouthAustralia Series 5, ch. 4: www.pir.sa.gov.au/dhtml/ss/section.php?sectID=1775&tempID=8 (accessed September23, 2003).Watts, N. L., 1987, Theoretical aspects <strong>of</strong> cap-rock <strong>and</strong><strong>fault</strong> <strong>seal</strong>s for single <strong>and</strong> two phase hydrocarbon columns:Marine <strong>and</strong> Petroleum Geology, v. 4, p. 274–307.Wiprut, D., <strong>and</strong> M. D. Zoback, 2000, Fault <strong>reactivation</strong> <strong>and</strong>fluid flow along a previously dormant normal <strong>fault</strong> in<strong>the</strong> nor<strong>the</strong>rn North Sea: Geology, v. 28, p. 595–598.Zoback, M. D., <strong>and</strong> J. H. Healy, 1984, Friction, <strong>fault</strong>ing<strong>and</strong> in situ stress: Annales Geophysicae, v. 2, p. 689–698.