


You also want an ePaper? Increase the reach of your titles
YUMPU automatically turns print PDFs into web optimized ePapers that Google loves.
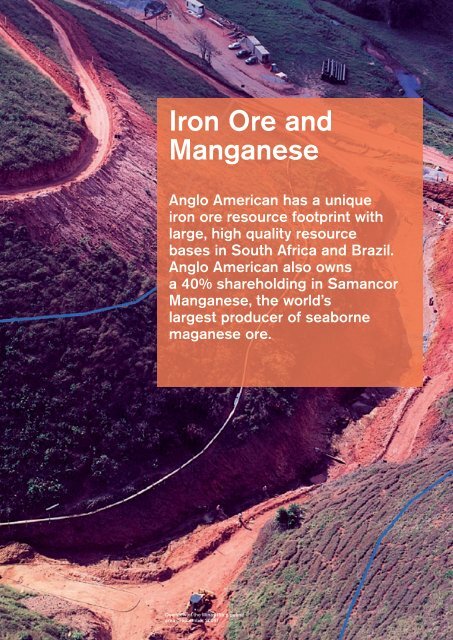
<strong>Iron</strong> <strong>Ore</strong> <strong>and</strong><strong>Manganese</strong><strong>Anglo</strong> <strong>American</strong> has a uniqueiron ore resource footprint withlarge, high quality resourcebases in South Africa <strong>and</strong> Brazil.<strong>Anglo</strong> <strong>American</strong> also ownsa 40% shareholding in Samancor<strong>Manganese</strong>, the world’slargest producer of seabornemaganese ore.Overview of the Minas Rio pipelinearea (September 2009)
<strong>Iron</strong> <strong>Ore</strong> <strong>and</strong> <strong>Manganese</strong>(1)Financial highlights (1)Underlying earnings($m)Operating margin(%)15007062.312501,1505610004243.675050057128250140008090809Share of Group operating profit%Share of Group net operating assets(%)3540303032253027241820121050008090809Group iron ore production(Mt)Group potential iron ore production(Mt)50403020101501209060300Year05 06 07 08 090Year09 10 11 12 13 FSishenThabazimbiAmapaExisting <strong>and</strong> approvedMajor unapproved growth pipelineF Forecast conceptual production 10+ year outlookSource: <strong>Anglo</strong> <strong>American</strong>Due to the portfolio <strong>and</strong> management structure changes announced in October 2009, the segments have changed from thosereported at 31 December 2008. 2008 comparatives have been reclassified to align with current year presentation. The segmentresults include an allocation of corporate costs.70 <strong>Anglo</strong> <strong>American</strong> plc Fact Book 2009/10
Financial dataUS$m 2009 2008TurnoverSubsidiaries 2,816 2,573Joint ventures – –Associates 603 1,526Total turnover 3,419 4,099Of which:Kumba <strong>Iron</strong> <strong>Ore</strong> 2,816 2,573Samancor 603 1,526EBITDA 1,593 2,625Of which:Kumba <strong>Iron</strong> <strong>Ore</strong> 1,562 1,632<strong>Iron</strong> <strong>Ore</strong> Brazil (135) (5)Samancor 166 998Depreciation <strong>and</strong> amortisation 104 71Operating profit before special items <strong>and</strong> remeasurements 1,489 2,554Of which:Kumba <strong>Iron</strong> <strong>Ore</strong> 1,487 1,583<strong>Iron</strong> <strong>Ore</strong> Brazil (141) (9)Samancor 143 980Operating special items <strong>and</strong> remeasurements (1,139) (620)Operating profit after special items <strong>and</strong> remeasurements 350 1,934Net interest, tax <strong>and</strong> minority interests (918) (1,404)Underlying earnings 571 1,150Of which:Kumba <strong>Iron</strong> <strong>Ore</strong> 490 523<strong>Iron</strong> <strong>Ore</strong> Brazil (119) (31)<strong>Manganese</strong> 200 658<strong>Iron</strong> <strong>Ore</strong> <strong>and</strong><strong>Manganese</strong>Net operating assets 10,370 10,457Capital expenditure 1,044 783<strong>Anglo</strong> <strong>American</strong> plc Fact Book 2009/10 71
<strong>Iron</strong> <strong>Ore</strong> <strong>and</strong> <strong>Manganese</strong>Business overview42Mt – iron oreoutput at Kumbain 2009>80%Proportion ofiron ore for exportat Kumba5.0Bt – Measured,Indicated <strong>and</strong>Inferred resourcesfor Minas RioFinancial highlights: <strong>Iron</strong> <strong>Ore</strong> <strong>and</strong> <strong>Manganese</strong>$ million (unless otherwise stated) 2009 2008Operating profit 1,489 2,554Kumba <strong>Iron</strong> <strong>Ore</strong> 1,487 1,583<strong>Iron</strong> <strong>Ore</strong> Brazil (141) (9)Samancor 143 980EBITDA 1,593 2,625Net operating assets 10,370 10,457Capital expenditure 1,044 783Share of Group operating profit 30% 25%Share of Group net operating assets 27% 32%<strong>Iron</strong> <strong>Ore</strong> includes a 62.76% shareholding inKumba <strong>Iron</strong> <strong>Ore</strong> in South Africa. <strong>Iron</strong> <strong>Ore</strong> Brazilhas a 100% interest in the Minas Rio iron oreproject, a 49% shareholding in LLX Minas Rio,which owns the port of Açu (currently underconstruction) from which iron ore from theMinas Rio project will be exported, <strong>and</strong> a70% interest in the Amapá iron ore system.Kumba, listed on the Johannesburg StockExchange, operates two mines – Sishen in theNorthern Cape, which produced 39.3 Mt of ironore in 2009, <strong>and</strong> Thabazimbi in Limpopo, whichhad a production of 2.6 Mt in 2009. Kumba isa leading supplier of seaborne iron ore, <strong>and</strong>exported more than 80% of its total iron oresales volumes in 2009, with 75% of theseexports destined for China <strong>and</strong> the remainderto Europe, Japan <strong>and</strong> South Korea.The Minas Rio iron ore project is located in thestates of Minas Gerais <strong>and</strong> Rio de Janeiro <strong>and</strong>will include open pit mines <strong>and</strong> a beneficiationplant in Minas Gerais producing high gradepellet feed. The completion of phase 1 will seetransportation of ore through a slurry pipelinemore than 500 kilometres to the port of Açuin Rio de Janeiro state. Amapá, located inAmapá state in northern Brazil, is in the processof ramping up its pellet feed <strong>and</strong> sinter feedproduction <strong>and</strong> expects to produce 4.0 Mt in2010. Amapá production could increase to6.5 Mtpa with further capital investment.<strong>Manganese</strong> comprises a 40% shareholdingin Samancor Holdings, which owns Hotazel<strong>Manganese</strong> Mines <strong>and</strong> Metalloys, both situatedin South Africa, <strong>and</strong> a 40% shareholdingin each of the Australian-based operationsGroote Eyl<strong>and</strong>t Mining Company (GEMCO)<strong>and</strong> Tasmanian Electro Metallurgical Company(TEMCO), with BHP Billiton owning 60%<strong>and</strong> having management control. Samancoris the world’s largest producer of seabornemanganese ore <strong>and</strong> is among the top three globalproducers of manganese alloy. Its operationsproduce a combination of ores, alloys <strong>and</strong> metalfrom sites in South Africa <strong>and</strong> Australia. InJuly 2009, Samancor sold 26% of Hotazel<strong>Manganese</strong> Mines in a series of transactionsdesigned to comply with South Africa’s blackeconomic empowerment requirements.72 <strong>Anglo</strong> <strong>American</strong> plc Fact Book 2009/10
Production at Kumba iron ore increased by 14%to 41.9 Mt in 2009 as a result of the ramp up ofproduction from the jig plant (Sishen expansion).Samancor, which is the world’s largestintegrated producer by sales of manganese ore<strong>and</strong> alloys, is headquartered in South Africa.1112South Africa1 63% Kumba <strong>Iron</strong> <strong>Ore</strong> –Sishen, Kolomela <strong>and</strong> Thabazimbi2 40% SamancorKeyOpen Cut● PortOtherThe Minas-Rio project is located in the state ofMinas Gerais, Brazil <strong>and</strong> will include open pitmines <strong>and</strong> a beneficiation plant producing highgrade pellet feed which will be transported,through a slurry pipeline, over 500 km to thePort of Açu in the state of Rio de Janeiro.2South America1 100% Minas-Rio (Brazil)2 70% Amapá (Brazil)3 49% LLX Minas-Rio (Brazil)●Amapá, located in Amapá state in NorthernBrazil, is in the process of ramping up its pelletfeed <strong>and</strong> sinter feed production <strong>and</strong> expectsto produce 4.0 Mt in 2010. Amapá productioncould increase to 6.5 Mtpa with furthercapital investment.1 3The Australian <strong>Manganese</strong> operations consistof Groote Eyl<strong>and</strong>t Mining Company (GEMCO),situated off the east coast of the NorthernTerritory of Australia, <strong>and</strong> Tasmanian ElectroMetallurgical Company (TEMCO), which is basedat Bell Bay, approximately 55 km fromLaunceston, Tasmania.1Australia1 40% GEMCO2 40% TEMCO<strong>Iron</strong> <strong>Ore</strong> <strong>and</strong><strong>Manganese</strong>2<strong>Anglo</strong> <strong>American</strong> plc Fact Book 2009/10 73
<strong>Iron</strong> <strong>Ore</strong> <strong>and</strong> <strong>Manganese</strong>Industry overviewSteel is the most widely used of all metals.In 2009, despite the world economic slowdown,world crude steel production reached 1.2 billiontonnes, a decrease of only 8% on 2008, asChina, the world’s principal steelmaker, ratchetedup crude steel production on the back of theChinese government’s substantial fiscalstimulus package. Chinese crude steel outputfor 2009 was 567.8 Mt, an increase of 67.5 Mtor 13.5% year on year.In response to returning dem<strong>and</strong>, steelproducers across the industry began bringingdormant production capacity online, withmultiple blast furnace restarts being reportedin the second half of the year. Global steelcapacity utilisation reflected these trends,rising from a low of 58.3% in December 2008to 71.5% in December 2009 – though stillsignificantly below the peaks of over 90%recorded in early 2008.In 2009, total seaborne iron ore supplyincreased by 3% from 797 Mt to 819 Mt, largelydriven by strong Chinese steel production, withChinese imports showing a 41% year-on-yearrise to 628 Mt. In the early part of the year,Chinese domestic steel production dropped offdrastically for a time when spot prices wereinsufficient to support the high cost, low qualityoutput, but recovered in the second half of theyear on the back of higher iron ore prices.Spot iron ore fines prices recovered fromtheir lows of late 2008 <strong>and</strong> early 2009.Prices reached their highest 2009 levelsin December 2009 of $112/t (for cost <strong>and</strong>freight (CFR) 63.5% Fe delivered China),thus applying upward pressure on 2010price negotiations.MarketsWorld crude steel production continued toincrease during the second half of 2009compared with both the first half of 2009<strong>and</strong> the second half of 2008, with most majorsteel producing countries posting an increasein output. World crude steel production of1.2 billion tonnes was, however, markedlylower than the 1.3 billion tonnes producedin 2008. Steel production in China in 2009increased by 13.5% to 568 Mt. China’seconomic growth continues to be robust on theback of strong domestic focused consumption<strong>and</strong> infrastructure-based stimulus spending.The increase in steel production, coupled withlower Chinese domestic iron ore production,resulted in record seaborne iron ore importsinto China. From the second half of 2009, theEuropean, Japanese <strong>and</strong> South Korean marketshave seen a tentative recovery, with animprovement in iron ore dem<strong>and</strong> followingsome production increases <strong>and</strong> restockingby the steel industry.The manganese ore <strong>and</strong> alloy market reflectedthe decline in world crude steel production.The market was characterised by uncertainty inore <strong>and</strong> alloy dem<strong>and</strong>, masked by stocking <strong>and</strong>destocking activities <strong>and</strong>, consequently, pricesfor ore <strong>and</strong> alloy declined significantly duringthe year. Supply cutbacks swept the manganesesector in an effort to match the reduced levelsof dem<strong>and</strong>, which were maintained into thethird quarter of 2009. Dem<strong>and</strong> began toimprove during the second half of the year,when producers responded to the improvedorder levels by announcing furnace restarts.As 96% of manganese ore is smelted toproduce manganese ferroalloys (such asferromanganese <strong>and</strong> silicomanganese), whichare used in steel alloying applications, theperformance of the manganese alloy industryis the key determinant of ore dem<strong>and</strong>. The earlypart of 2009 was characterised by significantdem<strong>and</strong> contraction with underlying dem<strong>and</strong>trends masked by stocking <strong>and</strong> destockingactivities across the value chain. Marketconditions progressively recovered during thethird quarter <strong>and</strong> continued to improve as globalsteel production maintained an upward trend.<strong>Manganese</strong> ore <strong>and</strong> alloy prices declinedsignificantly during the first half of the year, butincreased progressively in the third <strong>and</strong> fourthquarter owing to improved market conditions,allied with the restocking phase. <strong>Manganese</strong>alloy prices, however, will be influenced bysupply responses resulting from latent capacityin the industry, <strong>and</strong> both ore <strong>and</strong> alloy priceswill be influenced by steel production trends<strong>and</strong> the stocking <strong>and</strong> destocking cycles.74 <strong>Anglo</strong> <strong>American</strong> plc Fact Book 2009/10
Market informationWorld crude steel productionTonnes (million)World finished steel consumptionTonnes (million)150012501000750500250005 06 07 08 09Source: World Steel Association1,1441,2471,3461,3271,220OtherJapanAustralia/NZMiddle EastAfricaSouthAmericaNorthAmericaCISEuropeChina2,2501,8001,3509004500GlobalChina1,5481,8151,9902,2112,21305 06 07 08 09Source: World Steel AssociationSpot Market Analysis(shown to March 2010)200175150US$/t125100755025<strong>Iron</strong> <strong>Ore</strong> <strong>and</strong><strong>Manganese</strong>0Year Jan 07Jan 08 Jan 09 Jan 10Implied 63.5% Fe FOB Brazil US$/tContract 63.5% Fe FOB Brazil US$/tSource: CRUImplied 63.5% Fe FOB Aus US$/tContract 63.5% Fe FOB Aus US$/tEstimated global seaborne iron ore dem<strong>and</strong> by product(Mt)1,4001,2001,0008006002009-2013 F[CAGR]20.2%20.5%5.7%7.4%400200Total LME stocks (1) <strong>and</strong> base metals price index(shown to April 2008)0Year 00 01LME Stocks, weeks02 03 04 05 06 07 08 09 10 11 12 13Price3.5 FinesLumpSource: <strong>Anglo</strong> <strong>American</strong>3.0PelletsPellet feed3102602.52.0<strong>Anglo</strong> <strong>American</strong> plc Fact Book 2009/10 75210
<strong>Iron</strong> <strong>Ore</strong> <strong>and</strong> <strong>Manganese</strong>Strategy <strong>and</strong> growthThe core strategy of the business is to grow<strong>Anglo</strong> <strong>American</strong>’s position in iron ore <strong>and</strong> tosupply premium, high quality iron ore productsin the face of the declining quality of global ironore supplies. <strong>Anglo</strong> <strong>American</strong> has a unique ironore resource footprint, with large, high qualityresource bases in South Africa <strong>and</strong> Brazil.Kumba produces a leading quality lump <strong>and</strong>is well positioned to supply the high growthAsia-Pacific <strong>and</strong> Middle East markets. It isalso geographically well positioned to supplyEuropean steel markets in the light of anexpected decline in lump supplies from othersources. Minas Rio will capture a significantpart of the high growth pellet feed market withits premium product featuring high iron content<strong>and</strong> low impurities.Significant future growth will come from theexpansion projects at Minas Rio <strong>and</strong> Kolomela(previously Sishen South). Minas Rio phase 1will produce 26.5 Mtpa, with first productionscheduled for the second half of 2012, <strong>and</strong> hasthe potential to be exp<strong>and</strong>ed to up to 80 Mtpa.Resources have increased from 1.2 billiontonnes in 2007 to 5.0 billion tonnes (Measured,Indicated <strong>and</strong> Inferred) in 2009, with furtherresource potential. Studies for the expansionof the project have continued to be evaluatedduring 2009. The Kolomela project is expectedto produce 9 Mtpa of iron ore, with initialproduction scheduled for the first half of2012 <strong>and</strong> ramping up to full capacity in 2013.The manganese strategy is to focus onupstream resources businesses, despite theirlow-cost alloy smelters having been significantcontributors to profit in recent years. In addition,alloy smelters add value to the overallmanganese business as they enable Samancorto access markets with an optimal mix of ore<strong>and</strong> alloy, to optimise production to best suitmarket conditions <strong>and</strong> provide ongoinginformation on the performance of theirores in the smelting process.ProjectsThe development of the 9 Mtpa Kolomela minecontinues <strong>and</strong> remains on budget <strong>and</strong> onschedule to deliver first production during thefirst half of 2012, ramping up to full capacityin 2013. Mining operations commenced during2009, with the first blast carried out on 17September 2009. To date, 6 Mt of material hasbeen moved. Since the start of constructionactivities on the project in 2008, capitalexpenditure has totalled $367 million,of which $290 million was incurred during 2009.The pace of construction <strong>and</strong> project expenditureat Minas Rio is, in large part, dependent uponreceiving a number of environmental licences <strong>and</strong>other permits. A total of 21 licences <strong>and</strong> permitswere granted in the year, key among these werethe first part of the Mine <strong>and</strong> Beneficiation PlantInstallation Licence (granted in December), thefederal permit for l<strong>and</strong> clearance at the mine <strong>and</strong>The product screening facility underconstruction at Kumba <strong>Iron</strong> <strong>Ore</strong>’sKolomela project. The mine is onschedule to start production in thefirst half of 2012, ramping up to fullcapacity of 9 Mtpa in 2013.the approvals of specific permits for the portroad modifications. The second part of theInstallation Licence is expected to be approvedduring the course of 2010. <strong>Anglo</strong> <strong>American</strong>continues to work with local, state <strong>and</strong> federalauthorities <strong>and</strong> l<strong>and</strong>owners to ensure that thetiming of licence <strong>and</strong> permit receipts <strong>and</strong> l<strong>and</strong>acquisitions does not further impact the overalltiming of the project.Project development on the plant <strong>and</strong> pipelinein 2009 has been focused on the areas ofearthworks <strong>and</strong> civil works. Filtration plantground improvement works were commenced.At the port, offshore works have continuedwith the construction of the main trestle, now2.5 km in length, <strong>and</strong> dredging works, while thetemporary jetty for breakwater construction isnearing completion. Onshore, the quarry forproduction of the breakwater rock is operational<strong>and</strong> the quarry-to-port road modifications <strong>and</strong>construction are progressing. First iron oreproduction is scheduled for the second halfof 2012, with a planned annual capacity inthe first phase of 26.5 Mtpa of iron orepellet feed.<strong>Anglo</strong> <strong>American</strong>’s forecast attributable shareof the post-acquisition capital expenditure forthe first phase of the project has increased by$1.1 billion, from $2.7 billion to $3.8 billionowing to scoping changes at the mine, pipeline<strong>and</strong> port, as well as foreign exchange movements.Studies for the expansion of the Minas Rioproject continued during 2009. The latestresource statement resulting from geologicalwork, provides a total resource volume(Measured, Indicated <strong>and</strong> Inferred) of 5.0 billiontonnes, with further upside potential supportingthe envisaged expansion of the project.76 <strong>Anglo</strong> <strong>American</strong> plc Fact Book 2009/10
Project pipelineKolomela (previously Sishen South) CountrySouth AfricaOwnership* 46.6%Production volume9 Mtpa iron oreFull project capex$1,022mFull production Q1 2013The Kolomela project, which involves thedevelopment of an opencast mine some80 kilometres south of Sishen mine, in theNorthern Cape of South Africa, was approvedin July 2008. Earthworks have commenced <strong>and</strong>bulk construction is scheduled to begin with theestablishment of the major civil contracts duringthe first quarter of 2009. The mine is scheduledto start production in the first half of 2012,ramping up to full capacity of 9 Mtpa in 2013.Overall capex: $1,022mMinas-Rio phase 1CountryBrazilOwnership 100%Production volume26.5 Mtpairon ore pellet feed (wet base)Full project capex $3,796m (1)Full production Q3 2013Sishen Expansion Project Phase 1B (unapproved)CountrySouth AfricaOwnership* 46.6%Production volumeFull project capex0.8 Mtpa iron oreTBDFull production 2012The Minas-Rio project is located in the state ofMinas Gerais, Brazil <strong>and</strong> will include open pitmines <strong>and</strong> a beneficial plant producing high gradepellet feed which will be transported, througha slurry pipeline, over 500 km to the Port of Açuin the state of Rio de Janeiro. First production isnow expected in the second half of 2012. Plannedannual capacity will be 26.5 Mtpa of iron orepellet feed at an anticipated attributable cost of$3.8 billion. The aggregate cost of 100% of themine, pipeline <strong>and</strong> part – <strong>and</strong> capital expenditureincurred both before <strong>and</strong> after <strong>Anglo</strong> <strong>American</strong>’sshare holding in Minas Rio – has increased from$3.6 billion to $5 billion.The aim of the Sishen Expansion Project Phase1B (SEP1B) is to beneficiate the -1+0.2mmfraction of the Jig plant ROM feed currentlybeing discarded. The project aims to produce0.75 Mtpa additional fines product, <strong>and</strong> hasthe potential to increase the Jig plant yield byabout 3%.Overall capex: $3,796mOverall capex: TBD<strong>Iron</strong> <strong>Ore</strong> <strong>and</strong><strong>Manganese</strong>Sishen Expansion Project 2 (unapproved)CountrySouth AfricaOwnership* 46.6%Production volumeFull project capex10 Mtpa iron oreTBDFull production 2019Sishen Mine’s production will be increased byapproximately 10Mtpa with the developmentof Sishen Expansion Project 2 (SEP2). SEP2will use the additional material available inthe definition of the larger optimised pit shell,supplemented by material that became availablewith the refinement of the Sishen productrange. The increased mining activity requiredto mine the larger pit will in part be utilised bybeneficiating the low Fe grade portion of thematerial resulting in some of the waste beingreclassified as ore.Overall capex: TBD(1)Capital expenditure, post acquisition of <strong>Anglo</strong> <strong>American</strong>’s shareholding in Minas-Rio, for 100% of the mine <strong>and</strong> pipeline, <strong>and</strong> 49% share of the part.* Kumba <strong>Iron</strong> <strong>Ore</strong> owns 74% of Sishen <strong>and</strong> Kolomela. <strong>Anglo</strong> <strong>American</strong> plc through its 63% ownership in Kumba effectively owns 46.6% of Sishen.<strong>Anglo</strong> <strong>American</strong> plc Fact Book 2009/10 77
<strong>Iron</strong> <strong>Ore</strong> <strong>and</strong> <strong>Manganese</strong>Production data2009 2008 2007 2006 2005Kumba <strong>Iron</strong> <strong>Ore</strong> – tonnesLump 25,300,000 22,042,000 19,043,000 18,639,800 18,747,000Fines 16,643,000 14,657,000 13,357,000 12,470,300 12,240,00041,943,000 36,699,000 32,400,000 31,110,100 30,987,000Amapá (1) – tonnesSinter feed 576,100 128,000 – – –Pellet feed 2,077,100 584,000 – – –2,653,200 712,000 – – –Total iron ore production 44,596,200 37,411,000 32,400,000 31,110,100 30,987,000Samancor (2) – tonnes<strong>Manganese</strong> ore 1,570,000 2,704,000 2,411,000 2,248,000 2,040,000<strong>Manganese</strong> alloy (3) 129,000 306,000 310,000 256,300 309,000(1) Production from Amapá is included from 5 August 2008. Amapá production for full year 2008 was 1.2 Mt. At 31 December 2009 Amapá was not in commercial production <strong>and</strong> therefore to this date all revenue <strong>and</strong> relatedcosts were capitalised. Commercial production commenced on 1 January 2010.(2)Saleable production.(3)Production includes Medium Carbon Ferro <strong>Manganese</strong>.78 <strong>Anglo</strong> <strong>American</strong> plc Fact Book 2009/10
<strong>Ore</strong> Reserve <strong>and</strong> Mineral Resource estimatesas at 31 December 2009Kumba <strong>Iron</strong> <strong>Ore</strong>The <strong>Ore</strong> Reserve <strong>and</strong> Mineral Resource estimates were compiled in accordance with The SAMREC Code, 2007. THE MINERAL RESOURCES AREREPORTED AS ADDITIONAL TO ORE RESERVES.The figures reported represent 100% of the <strong>Ore</strong> Reserves <strong>and</strong> Mineral Resources, the percentage attributable to <strong>Anglo</strong> <strong>American</strong> plc is statedseparately. Rounding of figures may cause computational discrepancies.<strong>Iron</strong> <strong>Ore</strong> Tonnes Grade Saleable product<strong>Ore</strong> Reserves Attributable % LOM Classification 2009 2008 2009 2008 2009 2008Sishen Mine (OP) (1) 36.5 21 Mt Mt %Fe %Fe Mt MtProved 707.6 709.2 59.2 59.7 531@65.4%Fe 536@65.0%FeProbable 203.9 247.7 59.2 59.3 154@64.9%Fe 187@65.1%FeTotal 911.5 956.9 59.2 59.6 685@65.3%Fe 723@65.0%FeThabazimbi Mine (OP) (2) 46.4 6 %Fe %FeProved 9.5 4.1 61.7 64.5 8@63.4%Fe 4@64.9%FeProbable 4.7 0.8 61.3 64.9 4@62.7%Fe 1@65.1%FeTotal 14.2 4.9 61.5 64.6 12@63.1%Fe 5@64.9%FeKolomela Mine (OP) (3) 46.4 28 %Fe %FeProved 123.1 123.1 64.2 64.2 123@64.2%Fe 123@64.1%FeProbable 91.0 91.0 63.9 63.9 91@63.9%Fe 91@63.9%FeTotal 214.1 214.1 64.1 64.1 214@64.0%Fe 214@64.0%Fe<strong>Iron</strong> <strong>Ore</strong> Tonnes GradeMineral Resources Attributable % Classification 2009 2008 2009 2008Sishen Mine (OP) (4) 36.5 Mt Mt %Fe %FeMeasured 589.1 758.7 56.0 54.9Indicated 697.0 715.5 57.6 57.4Measured <strong>and</strong> Indicated 1,286.1 1,474.1 56.8 56.1Inferred (in LOM) 3.7 4.1 58.2 61.8Inferred (ex. LOM) 148.7 150.2 59.4 59.2Total Inferred 152.4 154.3 59.4 59.3Thabazimbi Mine (OP) (5) 46.4 %Fe %FeMeasured 9.5 18.7 62.7 62.3Indicated 2.4 4.9 63.7 63.4Measured <strong>and</strong> Indicated 11.9 23.6 62.9 62.5Inferred (in LOM) 1.3 0.3 61.9 61.8Inferred (ex. LOM) 2.3 2.6 63.4 63.4Total Inferred 3.6 2.9 62.8 63.3Kolomela Mine (OP) (3)(6) 46.4 %Fe %FeMeasured 49.5 49.5 65.0 65.0Indicated 20.8 20.8 64.9 64.9Measured <strong>and</strong> Indicated 70.3 70.3 64.9 64.9Inferred (in LOM) 35.4 35.4 65.6 65.6Inferred (ex. LOM) 47.4 47.4 62.5 62.5Total Inferred 82.9 82.9 63.8 63.8<strong>Iron</strong> <strong>Ore</strong> <strong>and</strong><strong>Manganese</strong>Mining method: OP = Open Pit. LOM = Life of Mine in years based on scheduled <strong>Ore</strong> Reserves.The tonnage is quoted as dry metric tonnes <strong>and</strong> abbreviated as Mt for million tonnes.The Mineral Resources are constrained by a resource pit shell, which defines the spatial limits of eventual economic extraction.Due to the uncertainty that may be attached to some Inferred Mineral Resources, it cannot be assumed that all or part of an Inferred Mineral Resource will necessarily be upgraded to an Indicated or Measured Resource aftercontinued exploration.The Z<strong>and</strong>rivierspoort Project is not reported as <strong>Anglo</strong> <strong>American</strong>’s shareholding (23.2%) is below the internal threshold for reporting. Details of this project are presented in the Kumba <strong>Iron</strong> <strong>Ore</strong> Annual Report.(1)Sishen Mine – <strong>Ore</strong> Reserves: The decrease is mainly as a result of depletion due to mining, marginally negated by a minor correction made for over-estimation of <strong>Ore</strong> Reserve depletion in 2008 <strong>and</strong> a small increase in<strong>Ore</strong> Reserves based on a revised scheduling process that allows for a slight improvement in resource utilisation.(2)Thabazimbi Mine – <strong>Ore</strong> Reserves: The primary reason for the net increase is a complete revision of the conversion process of Mineral Resources into <strong>Ore</strong> Reserves in 2009. The conversion gain was offset by miningdepletion; a correction made for the under-estimation of production in 2008 <strong>and</strong> the downgrading of Probable <strong>Ore</strong> Reserves to Inferred Mineral Resources considered for the life-of-mine plan due to an associatedgeotechnical risk. Geological block model updates in 2009 resulted in a further addition of <strong>Ore</strong> Reserves. The cut-off grade used for the Thabazimbi Mine life-of-mine scheduling is a Saleable Product %Fe cut-off grade<strong>and</strong> all material that could be beneficiated to at least this cut-off value was included in the schedule as ROM.(3)Kolomela Mine: The Sishen South <strong>Iron</strong> <strong>Ore</strong> Project has been renamed to Kolomela Mine.(4)Sishen Mine – Mineral Resources: The 2009 Mineral Resources represent the combination of the previously reported Within Pit <strong>and</strong> Outside Pit resources. The decrease is primarily the result of a downward adjustment ofthe in situ %Fe grade estimate of low-grade ore material based on new information. This decrease in iron grade resulted in previously-defined ore material being transferred to waste. The loss is not in the current life ofmine plan.(5)Thabazimbi Mine – Mineral Resources: The 2009 Mineral Resources represent the combination of the previously reported Within Pit <strong>and</strong> Outside Pit resources. The decrease is primarily due to a conversion to <strong>Ore</strong>Reserves based on a complete revision of the <strong>Ore</strong> Reserve estimation in 2009.(6)Kolomela Mine – Mineral Resources: The 2009 Mineral Resources represent the combination of the previously reported Within Pit <strong>and</strong> Outside Pit resources.Audits related to the generation of the <strong>Ore</strong> Reserve <strong>and</strong> Mineral Resource statements were carried out by independent consultants during 2009 at the following operations: Kolomela Mine<strong>Anglo</strong> <strong>American</strong> plc Fact Book 2009/10 79
<strong>Iron</strong> <strong>Ore</strong> <strong>and</strong> <strong>Manganese</strong><strong>Ore</strong> Reserve <strong>and</strong> Mineral Resource estimatesas at 31 December 2009continued<strong>Iron</strong> <strong>Ore</strong> BrazilThe Minas Rio project is located in the state of Minas Gerais, Brazil <strong>and</strong> will include open pit mines <strong>and</strong> a beneficiation plant producing high grade pelletfeed which will be transported, through a slurry pipeline, over 500km to the Port of Açu in the state of Rio de Janeiro. The project will largely be basedon the two main deposits of Serra do Sapo <strong>and</strong> Itapanhoacanga. Two ore types, Friable <strong>and</strong> Hard Itabirite, have been identified at Serra do Sapo <strong>and</strong>Itapanhoacanga. Only the Friable Itabirite is being considered for Phase 1 of the project. The planned annual capacity of Phase 1 is 26.5Mtpa of ironore pellet feed (wet tonnes), for start up during in the second half of 2012.The figures reported represent 100% of the Mineral Resources. Rounding of figures may cause computational discrepancies.Amapá Tonnes GradeMineral Resources (1) Attributable % Classification 2009 2008 2009 2008Amapá (OP) (2) 70.0 Mt Mt %Fe %FeCanga Measured – – – –Indicated – – – –Measured <strong>and</strong> Indicated – – – –Inferred 17.2 – 54.6 –Colluvium Measured 5.6 – 40.9 –Indicated 31.0 – 44.0 –Measured <strong>and</strong> Indicated 36.6 – 43.5 –Inferred 14.1 – 41.7 –Friable Itabirite <strong>and</strong> Hematite Measured 28.7 – 42.5 –Indicated 80.8 – 41.3 –Measured <strong>and</strong> Indicated 109.4 – 41.6 –Inferred 29.9 – 41.8 –80 <strong>Anglo</strong> <strong>American</strong> plc Fact Book 2009/10
Minas Rio <strong>Iron</strong> <strong>Ore</strong> Project Tonnes GradeMineral Resources (3) Attributable % Classification 2009 2008 2009 2008Itapanhoacanga (OP) (4) 100 Mt Mt %Fe %FeFriable Itabirite <strong>and</strong> Hematite Measured 25.0 – 42.5 –Indicated 219.2 90.0 41.6 39.6Measured <strong>and</strong> Indicated 244.2 90.0 41.7 39.6Inferred 74.7 362.0 41.7 38.0Hard Itabirite Measured 10.9 – 33.2 –Indicated 95.8 – 33.8 –Measured <strong>and</strong> Indicated 106.7 – 33.7 –Inferred 43.9 51.0 33.2 33.2Serra do Sapo (OP) (5) 100 %Fe %FeFriable Itabirite <strong>and</strong> Hematite Measured 498.1 462.0 38.6 38.1Indicated 872.5 565.8 37.0 37.5Measured <strong>and</strong> Indicated 1,370.5 1,027.8 37.6 37.8Inferred 192.2 143.9 33.1 34.3Hard Itabirite Measured 453.8 – 31.8 –Indicated 1,968.3 1,650.5 31.2 31.0Measured <strong>and</strong> Indicated 2,422.1 1,650.5 31.3 31.0Inferred 149.4 680.8 30.3 30.3Serro (OP) (6) 100 %Fe %FeFriable Itabirite <strong>and</strong> Hematite Measured – – – –Indicated 9.5 46.0 63.6 33.3Measured <strong>and</strong> Indicated 9.5 46.0 63.6 33.3Inferred 74.2 54.0 35.3 28.7Hard Itabirite Measured – – – –Indicated – 79.0 – 29.5Measured <strong>and</strong> Indicated – 79.0 – 29.5Inferred 308.2 259.0 31.6 30.7Mining method: OP = Open Pit.Due to the uncertainty that may be attached to some Inferred Mineral Resources, it cannot be assumed that all or part of an Inferred Mineral Resource will necessarily be upgraded to an Indicated or Measured Resource aftercontinued exploration.(1)Amapá – Mineral Resources: The cut-off grade used is 25% Fe. Assays are on a dry basis. Tonnages are reported on a wet basis with an average moisture content of 10 wt% for Colluvium <strong>and</strong> 8 wt% for Friable Itabirite<strong>and</strong> Hematite ore.(2)Amapá : Includes the Mário Cruz, Martelo, Taboca, Taboca Leste <strong>and</strong> Vila do Meio areas. The Taboca Leste area comprises the following Inferred Resources: Canga – 1.5Mt @ 42.6% Fe, Colluvium – 10.9Mt @ 41.7% Fe<strong>and</strong> Friable Itabirite – 23.8Mt @ 41.4% Fe. Friable Itabirite <strong>and</strong> Hematite includes Friable Itabirite, Altered Friable Itabirite <strong>and</strong> Friable Hematite.(3)Minas Rio Project – Mineral Resources: The cut-off grade used is 25% Fe. Assays are on a dry basis. Tonnages are reported on a wet basis with an average moisture content of 5 wt% for Friable ore. Friable Itabirite <strong>and</strong>Hematite includes Friable Itabirite, Semi-Compact Itabirite <strong>and</strong> Friable Hematite.(4)Itapanhoacanga: 2008 figures comprise material above 20% Fe cut-off grade. Low grade Mineral Resources (between 20% Fe <strong>and</strong> 33% Fe) were included in table footnotes in 2008 <strong>and</strong> are now combined with thepreviously reported high grade Mineral Resources. Friable Itabirite <strong>and</strong> Hematite includes Friable Itabirite, Semi-Compact Itabirite, Soft Hematite <strong>and</strong> Hard Hematite. A portion of the adjacent Quartz-X Mineração Ltdproperty is included in the 2009 figures (Measured = 0.4Mt @ 43.1% Fe, Indicated = 23.8Mt @ 41.2% Fe, Inferred = 22.4Mt @ 41.0% Fe).(5)Serra do Sapo: Friable Itabirite <strong>and</strong> Hematite includes Friable Itabirite, Semi-Compact Itabirite <strong>and</strong> Soft Hematite. The Friable Itabirite <strong>and</strong> Hematite includes an area containing high Alumina content (28.1Mt).Mineração Trindade Ltd properties are included in the 2009 figures (Indicated = 40.3Mt @ 32.1% Fe, Inferred = 3.2Mt @ 31.7% Fe).(6)S e r r o : 2008 figures comprise material above 20% Fe cut-off grade. Low grade Mineral Resources (between 20% Fe <strong>and</strong> 33% Fe) were included in table footnotes in 2008 <strong>and</strong> are now combined with the previouslyreported high grade Mineral Resources. Friable Itabirite <strong>and</strong> Hematite includes Friable Itabirite, Semi-Compact Itabirite <strong>and</strong> Hard Hematite (9.5Mt @ 63.6% Fe).Audits related to the generation of the Mineral Resource statements were carried out by independent consultants during 2009 at the following operations <strong>and</strong> projects: Amapá, Itapanhoacanga, Serra do Sapo <strong>and</strong> Serro<strong>Iron</strong> <strong>Ore</strong> <strong>and</strong><strong>Manganese</strong><strong>Anglo</strong> <strong>American</strong> plc Fact Book 2009/10 81
<strong>Iron</strong> <strong>Ore</strong> <strong>and</strong> <strong>Manganese</strong><strong>Ore</strong> Reserve <strong>and</strong> Mineral Resource estimatesas at 31 December 2009continuedSamancor <strong>Manganese</strong>The <strong>Ore</strong> Reserve <strong>and</strong> Mineral Resource estimates were compiled in accordance with The SAMREC Code, 2007 <strong>and</strong> The JORC Code, 2004 as applicable.THE MINERAL RESOURCES INCLUDE ORE RESERVES.The figures reported represent 100% of the <strong>Ore</strong> Reserves <strong>and</strong> Mineral Resources (source: BHP Billiton). Rounding of figures may cause computationaldiscrepancies.<strong>Manganese</strong> Tonnes Grade Yield<strong>Ore</strong> Reserves Attributable % LOM Classification 2009 2008 2009 2008 2009 2008GEMCO (OP) (1) 40.0 14 Mt Mt %Mn %Mn % %Proved 67.5 71.9 46.8 48.2 50.8 49.4Probable 43.2 43.9 46.4 47.1 47.9 47.0Total 110.7 115.8 46.7 47.8 49.7 48.5Hotazel – Mamatwan (OP) (2)(3) 36.4 22 %Mn %MnProved 53.6 40.5 37.8 37.7Probable 24.8 8.1 37.2 36.8Total 78.4 48.6 37.6 37.6Hotazel – Wessels (UG) (2)(4) 36.4 49 %Mn %MnProved 5.1 3.9 45.5 46.5Probable 68.4 14.9 43.0 45.3Total 73.5 18.8 43.2 45.5<strong>Manganese</strong> Tonnes Grade YieldMineral Resources Attributable % Classification 2009 2008 2009 2008 2009 2008GEMCO (OP) (5) 40.0 Mt Mt %Mn %Mn % %Measured 71.2 74.6 46.3 46.3 44.4 44.2Indicated 46.6 47.5 46.0 46.0 44.0 44.0Measured <strong>and</strong> Indicated 117.9 122.1 46.2 46.2 44.2 44.1Inferred 39.0 39.1 43.3 43.4 45.2 44.1Hotazel – Mamatwan (OP) (2)(6) 36.4 %Mn %MnMeasured 79.6 51.8 35.8 37.6Indicated 45.3 13.9 34.3 36.3Measured <strong>and</strong> Indicated 124.9 65.7 35.3 37.3Inferred 3.1 1.7 33.1 35.6Hotazel – Wessels (UG) (2)(7) 36.4 %Mn %MnMeasured 12.1 6.7 46.3 47.3Indicated 132.0 119.6 44.2 44.0Measured <strong>and</strong> Indicated 144.1 126.3 44.4 44.1Inferred – – – –Mining method: OP = Open Pit, UG = Underground. LOM = Life of Mine in years based on scheduled <strong>Ore</strong> Reserves.Mamatwan tonnages stated as wet metric tonnes. Wessels <strong>and</strong> GEMCO tonnages stated as dry metric tonnes.Due to the uncertainty that may be attached to some Inferred Mineral Resources, it cannot be assumed that all or part of an Inferred Mineral Resource will necessarily be upgraded to an Indicated or Measured Resource aftercontinued exploration.(1)GEMCO – <strong>Ore</strong> Reserves: Changes are the result of pricing changes between FY08 <strong>and</strong> FY09.(2)Hotazel <strong>Manganese</strong> Mines: An agreement has been reached between Hotazel <strong>Manganese</strong> Mines <strong>and</strong> empowerment consortium Ntsimbintle Mining (Pty) Ltd. The Ntsimbintle agreement has been signed by both parties<strong>and</strong> approved by the South African Government. This transaction allows for the inclusion of part of the Prospecting Rights held by Ntsimbintle into the Mamatwan <strong>and</strong> Wessels Mining Area in exchange for 9% equity inHotazel <strong>Manganese</strong> Mines, thereby adding the resources within the Ntsimbintle Prospecting Right to the Mamatwan <strong>and</strong> Wessels Mining Rights through a Section 102 conversion. The rights have been transferred to <strong>and</strong>are now held by a new company called Hotazel <strong>Manganese</strong> Mines (Pty) Ltd, effective as at 16 April 2009 subsequent to a section 11 (Act 28/2002) approval by the South African Department of Minerals <strong>and</strong> Energy(DME). The <strong>Anglo</strong> <strong>American</strong> share of Wessels <strong>and</strong> Mamatwan mines (Hotazel <strong>Manganese</strong> Mines) therefore drops to 36.4%.(3)Mamatwan – <strong>Ore</strong> Reserves: Changes in tonnages are due to a refinement of densities used for various zones within the orebody, inclusion of Ntsimbintle <strong>Ore</strong> Reserves, changes in final pillar layout (due to inclusion ofNtsimbintle <strong>Ore</strong> Reserves) resulting in more reserves being available for mining <strong>and</strong> depletion due to production.(4)Wessels – <strong>Ore</strong> Reserves: The main reasons for the increase in <strong>Ore</strong> Reserves are the inclusion of the Upper Body into the LOM Plan, the inclusion of the Ntsimbintle part of the Lower Body, refinement of the geologicalmodel after the addition of new drillhole <strong>and</strong> geological data <strong>and</strong> production depletion. New scheduling software <strong>and</strong> updated modifying factors have been used for the resource to reserve conversion.(5)GEMCO – Mineral Resources: All changes are as a result of depletion due to mining.(6)Mamatwan – Mineral Resources: Mineral Resources have been declared above a 35% Mn cut-off grade <strong>and</strong> now includes Mineral Resources contributed by Ntsimbintle Mining (Pty) Ltd. A major positive change intonnage is due to the inclusion of the balance of the Top Cut (after removal of the X-zone). Changes also due to a refinement in the density methodology used. the X Zone <strong>and</strong> Top Cut (Balance) are also declared asMineral Resource. As a matter of course, this material has to be mined in the process of accessing the economic M, C <strong>and</strong> N Zones <strong>and</strong>, depending on market conditions, now has potential economic value. Please notethat the modelling <strong>and</strong> tonnage declaration of an area of 118,753 m² on the western side within the Ntsimbinle portion remains outst<strong>and</strong>ing due to insufficient data. This will, following the approval of the South AfricanGovernment <strong>and</strong> delineation of official boundaries, be evaluated for inclusion in 2010.(7)Wessels – Mineral Resources: Figures include those resources contributed by Ntsimbintle Mining (Pty) Ltd. A decrease in the Upper Body resource is reported after a complete rerun of the block model with the addition ofnew drillhole data <strong>and</strong> subsequent geological re-interpretation. Changes in the Lower Body Resource are, apart from production depletion, due to a rerun of the block model with the addition of new drillhole <strong>and</strong>underground face sampling data, geological re-interpretation, adjustment of the sub-outcrop position in places <strong>and</strong> the addition of re-evaluated remnant ore blocks.82 <strong>Anglo</strong> <strong>American</strong> plc Fact Book 2009/10


![English PDF [ 189KB ] - Anglo American](https://img.yumpu.com/50470814/1/184x260/english-pdf-189kb-anglo-american.jpg?quality=85)


![pdf [ 595KB ] - Anglo American](https://img.yumpu.com/49420483/1/184x260/pdf-595kb-anglo-american.jpg?quality=85)
![pdf [ 1.1MB ] - Anglo American](https://img.yumpu.com/49057963/1/190x240/pdf-11mb-anglo-american.jpg?quality=85)

