P-20 Education Report - Ozarks Technical Community College
P-20 Education Report - Ozarks Technical Community College
P-20 Education Report - Ozarks Technical Community College

You also want an ePaper? Increase the reach of your titles
YUMPU automatically turns print PDFs into web optimized ePapers that Google loves.
P-<strong>20</strong> <strong>Education</strong> <strong>Report</strong>:A Post-Secondary Perspective:Where do Missouri’s Students Come From and Where AreThey Going?
iAcknowledgementsMany thanks to Mary Bruton, Brian Crouse, Mark Ehlert, Leigh Ann Grant, Jeremy Kintzel, Stacey Preis, Jeffrey Smith, and Timothy Wittmann andwhose insight and research have proven invaluable. We are indebted to Bill Elder and Billy Moore and University of Missouri Office of Social andEconomic Data Analysis whose time spent managing the pilot P-<strong>20</strong> data warehouse was priceless. At DED, we want to thank Maggie Lear fordeveloping a beautiful layout. We gratefully acknowledge the support of the National Governor’s Association and the Kauffman Foundation in theproduction of this report.
iiTable of ContentsExecutive Summary 1Overview 2Methodology 3High School Graduates – <strong>College</strong> Enrollment 5High School Graduates- <strong>College</strong> Remediation 9<strong>College</strong> Student Follow-up 11<strong>College</strong> Graduates Employment Trends 13Conclusion 19
1Executive SummaryWhere do Missouri public high school graduates attend college in the state and how many leave or attend private colleges? What industries doMissouri’s public college graduates enter, and what are their average earnings by program of study, degree level, and industry? What are the trendsfor employment and earnings of public high school students that drop out and those that graduate and do not attend college? This reportsummarizes Missouri’s first analysis using linked unit record data from the Departments of Elementary and Secondary <strong>Education</strong>, Higher <strong>Education</strong>,and Economic Development. In addition, this report summarizes Missouri’s first attempts to conduct inquiries using linked data, the results from whichprovide preliminary insights about the trends and characteristics of students in Missouri as they transition from the K-12, college, and workforcesystems.The findings presented in this report should be viewed as evidence of the valuable research made possible through the use of linked data systems,but caution must be exercised in the use of specific facts and figures as a basis for decision-making. Further work refining existing data systemsand linkages is necessary to establish a truly robust and reliable data network for such purposes.Based on the records that could be linked, highlights of the research findings include:• Low-income students in Missouri that completed an ACT assessment were less likely to enroll in higher education compared to Missouristudents with higher family income levels. Only 22.4% of Missouri <strong>20</strong>08 high school exiters who completed an ACT assessment who wereeligible for free or reduced price lunch enrolled in higher education in <strong>20</strong>08-09.• A+ eligibility contributed to greatly increased chances for college attendance for populations that normally would be less likely to attend.Although 24.8% high school graduates that completed an ACT assessment completed requirements for A+ eligibility, they made up 47.0%of students enrolling in college.• Missouri high school students in the linked records that completed an ACT assessment who completed a college preparatory certificate weresignificantly less likely to enroll in remedial college courses the following fall. For <strong>20</strong>08-09 Missouri higher education institutions, only 7.9%of all enrollees in remedial classes had completed the high school college preparatory certification the previous spring.• Only 2% of Missouri high school graduates students in the linked records that completed an ACT assessment enrolled in higher educationand were determined by ACT to be college ready (as defined by having an ACT Math sub score of 21 or greater) were enrolled in remedialmath coursework compared to 38% of those below a 21, and 48% of those without an ACT score.• For Missouri graduates of 4-year public institutions, those that graduate with METS-related degree enjoy higher wages in the fall followinggraduation than many of their counterparts with non-METS-related degrees.• Male college graduates earn more than their female counterparts after graduation in 17 out of <strong>20</strong> industry sectors. The gender wagedisparity for college graduates is largest in Manufacturing, Information Services, and Professional, Scientific, & <strong>Technical</strong> Services.• Of the most popular Bachelor’s degree programs (by highest number of graduates) 17 out of <strong>20</strong> subject areas the same for both male andfemale completers, with Business Management the most popular for both genders. However, in only 8 of the 26 different types of Bachelor’sdegrees do female graduates earn more than their male counterparts after graduation.
2OverviewThe Case for ChangeIn today’s increasingly competitive global economy, significant benefits accrue to states and regions who build an education advantage to complementother economic and community assets. Missouri is currently competing with other states, and other countries, to position itself as having a worldclasseducation system that adequately prepares Missouri students, the emerging workforce, for family-supporting career opportunities that await themin the New Economy.With math and science being the new global language for economic competitiveness, Missouri is positioned to enhance its ability to create high-techinnovations that drive high-wage jobs and improve the quality of life for all Missourians. Math and science core competencies are the cornerstone ofthe high-tech, innovation economy. The P-<strong>20</strong> Council has worked in recent years toward improving the performance of all Missouri students,expanding the pool of students motivated to pursue STEM careers, and highlighting the importance of STEM-related industries and jobs in enhancingMissouri’s global competitiveness and innovation. These priorities have the potential to be even more fruitful if Missouri can develop an even morecoherent system of P-<strong>20</strong> education where each level of education -- preschool, elementary, middle school, high school and college – prepare studentswell for the next level.In <strong>20</strong>09, Governor Nixon signed into law an expanded Missouri P-<strong>20</strong> Council. The Council consists of: the Missouri Department of Elementary andSecondary <strong>Education</strong>; the Missouri Department of Higher <strong>Education</strong>; the State Board of <strong>Education</strong>; the Coordinating Board for Higher <strong>Education</strong>; theCoordinating Board for Early <strong>Education</strong>; and unlike most states, the Missouri Department of Economic Development, the agency with primaryresponsibility for meeting the needs of business and industry. The job of the Council is to provide better, stronger, more aligned education andworkforce training systems. This alignment of systems and programs will better serve Missourians and make it easier for our state’s students toreceive the education they need to compete in the New Economy.The Goal of P-<strong>20</strong> ResearchIn <strong>20</strong>08, The National Governors Association awarded Missouri an Honor States Grant for P-<strong>20</strong> Longitudinal Data Analysis to develop a pilot system togather and share longitudinal data on students in the Missouri education pipeline. The pilot database project has linked graduation and workplacedata in order to establish a baseline for aligning curriculum and workplace skills for workforce development. The data system is designed to providebetter collaboration between Missouri state agencies and better informed decision-making at the statewide, regional, and local levels. This grant hasallowed Missouri to take a significant step forward in its ability to answer critical research questions and to provide value-added educationinformation that reports on student progress and success in education at all levels.Missouri’s long-term goal is to link and share data among the Missouri Department of Elementary and Secondary <strong>Education</strong> (DESE), MissouriDepartment of Higher <strong>Education</strong> (MDHE), and Department of Economic Development (DED) to establish benchmarks and tracking mechanisms to betterassess how students are meeting critical benchmarks throughout the education continuum. Under this grant, the Missouri P-<strong>20</strong> Interagency Workgroupgathered data on student course-taking and degree completion at the secondary and postsecondary levels and linked these data with employmentdata and workforce supply data in target industries. While this grant did not provide enough resources to develop a complete P-<strong>20</strong> longitudinal datasystem, it has led toward improved data system capacity across DESE, MDHE, and DED.The primary objective of this report was to supply feedback to the economic development, business, and workforce development communities abouttrends in the education and workplace pipeline. It was envisioned that statewide leaders would use the data and process from these reports to planand act to improve the quality and relevance of education and training to ensure that Missourians have the right talent and fit for occupations in indemandindustries. While previous cross-agency analysis provides some intelligence to education stakeholders, it is not sufficient to drive a bold,innovative agenda to re-imagine the way Missouri prepares students for the challenges in the New Economy.
3MethodologyDatasets UsedData from DESE included two Missouri Student Information System (MOSIS) data files, <strong>20</strong>08 June Cycle Student Core and <strong>20</strong>08 June Enrollment andAttendance Student Core files. The June Cycle Student Core and the June Enrollment and Attendance files were merged by the Department prior tomatching. The MOSIS State ID was used by DESE to merge the Student Core file with the Enrollment and Attendance file prior to matching.Identification information included in the data included for matching was student’s name, social security number, State ID, Local ID, and date ofbirth.Data from MDHE included the Enhanced Missouri Student Achievement Study (EMSAS), Free Application for Federal Student Aid (FAFSA), Grants, ACTassessment, and A+ data files. Records from the <strong>20</strong>05-06 academic year through the <strong>20</strong>08 Fall enrollment were included from January through Junein <strong>20</strong>09.Data from the DED - Missouri Economic Research and Information Center (MERIC) included Unemployment Insurance (UI) wage records datasets. Thewage records were shared per the terms of a Memoranda of Understanding with the Missouri Department of Labor and Industrial Relations (DOLIR)for the sharing of Unemployment Insurance wage and employment data with third parties. Unemployment Insurance wage files were included forseven quarters; first quarter <strong>20</strong>07 to the third quarter of <strong>20</strong>08.The University of Missouri - Office of Social and Economic Data Analysis (OSEDA) was the recipient of data sets from the departments of ElementarySecondary <strong>Education</strong>, Higher <strong>Education</strong>, and Economic Development.Data from the National Student Clearinghouse (NSC) was also used to provide additional context and information than would be available using onlythe datasets described above. NSC provides follow-up information on individuals by searching for student attendance and graduation records across anationwide cross-section of postsecondary institutions. In total, three data requests were submitted to NSC—(1) a list of <strong>20</strong>06-07 graduates ofMissouri public college; (2) a list of students who attended Missouri public colleges in <strong>20</strong>07-08 but who were not found in that year’s graduationrecords or the following year’s enrollment records; and (3) a list of students who had exited the Missouri public high school system by June <strong>20</strong>08.Each of these lists were constructed through simple random sampling of the respective student populations having valid social security numbers.Common IDA “NatID” was added to each record creating a secure common ID across files. The de-identification process protects the privacy of individuals whoserecords are included in the files sent to OSEDA. However, the creation of the NatID is dependent upon a record having a valid social security numberand clearly not all records in dataset to be linked have social security numbers or valid social security numbers. Only 60% of the records in theACT file contained valid social security numbers. The linked MOSIS, ACT, and EMSAS Enrollment file had <strong>20</strong>,987 records of which 45% had validsocial security numbers.DESE has implemented a unique identifier for all students enrolled in Missouri’s public elementary and secondary schools. The unique identifier hasthe potential to be used at the post-secondary level, following a student into a postsecondary institution. Additional record links should occur if aMOSIS ID is used to link secondary and post secondary records and thus obtaining addition social security numbers by linking to other files such asFree Application for Federal Student Aid (FAFSA).Probabilistic matching using variables such as name, date of birth, gender, and race/ethnicity also might be a technique that could increase thepercentage of records that could be linked. The intent is to increase the number of linked records that can be used for longitudinal analysis, whichin theory should add to the reliability of each study’s conclusions. Such increases in the number of linked records may or may not add informationor change the populations studied. However, the results/conclusions could be compared (with and without the probabilistically matched records) andthus future decisions regarding the use of this type of technique could be evaluated.
4Linked DataDESE DatasetsThe June <strong>20</strong>08 MOSIS Student Core file was filtered to only include students with social security numbers and only those records with the most recentexit date for each student as matched by MOSIS ID. The June <strong>20</strong>08 MOSIS Enrollment and Attendance was filtered by Exit Date and only thoserecords with the most recent exit date for each student as matched by MOSIS ID.MDHE DatasetsNo filters were applied to the ACT, Grants, or A+ files for matching. The EMSAS Completion File 1 was filtered by social security number, calendaryear and academic term for Summer <strong>20</strong>07; Fall <strong>20</strong>07; Winter <strong>20</strong>08; or Spring <strong>20</strong>08. The EMSAS Completion File 2 was filtered by calendar year andacademic term for Summer <strong>20</strong>07; Fall <strong>20</strong>07; Winter <strong>20</strong>08; or Spring <strong>20</strong>08. The EMSAS Enrollment File 1 was filtered by social security number andfor the <strong>20</strong>08 calendar year. The EMSAS Enrollment File 2 was filtered for the <strong>20</strong>08 calendar year. The EMSAS Term Registration File was filtered bysocial security number, the most recent academic term, and calendar year for Summer <strong>20</strong>07; Fall <strong>20</strong>07; Winter <strong>20</strong>08; or Spring <strong>20</strong>08.DED DatasetsOnly wage records with valid social security numbers were selected for analysis. Unemployment Insurance (UI) Wage records were then aggregated byquarter and social security number by selecting the highest wage record for individuals with multiple wage records in a single quarter.Representativeness of Linked DatasetsFive linked datasets were created by linking MOSIS records with EMSAS records, EMSAS with UI records, EMSAS with UI, and linking three EMSAS files.Of the 34,3<strong>20</strong> records from the MOSIS file, 34.9% were linked to the EMSAS Enrollment file and 28.0% were linked to an EMSAS and ACT file. Forthe MOSIS to UI wage records, 70% of the 34,3<strong>20</strong> MOSISrecords were linked between the two files. Of the 34,214records from the EMSAS Completers file, 100.0% were linkedto the UI wage records.When interpreting the analysis of the linked records in thereport, it is important to note the representativeness of theMOSIS records with respect to how many school districtswere not included in the analysis. Of the 447 schooldistricts with high school exiter data, 296 school districts(160 metropolitan and 136 rural) were not included in theanalysis due to not having a valid SSN in the MOSIS studentcore file. Although there are alternative methods ofmatching administrative records, this initial research focusedon the analysis that could be conducted with matching onsocial security number alone. In the future, researchers canplan/discuss the future use of the MOSIS Identifier linked tosocial security numbers to create a more representativesample of school districts across the state.
5High School Graduates- <strong>College</strong> EnrollmentResearchers linked information on high school exiters of public Missouri high schools with enrollment data from Missouri public higher educationinstitutions and ACT assessment records. Students who were not located in the data matching process may have enrolled at private higher educationinstitutions or out-of-state or not have completed an ACT assessment.Demographic TrendsBreakouts in enrollment data by gender show that a slightly larger share of Missourifemale graduates in the linked records who completed an ACT assessment (38.8%)attended college compared to their male counterparts (32.8%). While femalesconstituted only 51.0% of Missouri’s 12 th grade graduate population, they represented55.1% of the total number of students enrolling in Missouri’s colleges.Public Postsecondary Enrollment by GenderEnrollment by Gender Count % of TotalFemale 5,312 55.1%Male 4,330 44.9%Unknown 5 0.1%Grand Total 9,647 100.0%Public Postsecondary Enrollment by Race/EthnicityEnrollment by Race/Ethnicity Count % of TotalAfrican American 693 7.2%American Indian / Alaskan Native 58 0.6%Caucasian 8,160 84.6%Hispanic <strong>20</strong>5 2.1%Asian / Pacific Islander 153 1.6%Non-Resident Alien <strong>20</strong> 0.2%Other 53 0.5%Unknown 305 3.2%Grand Total 9,647 100.0%K-12 Exit TrendsMissouri high school graduate records that were matched with Missouricollege enrollment data and ACT assessment records were also broken out bytype of exit in the High School system. Not surprisingly, the majority ofMissouri students enrolling in college in the fall following graduation werehigh school graduates. The linked records show that Missouri high schoolstudents that graduated without a college preparatory certificate constituteda majority of Missouri high school graduates enrolling in college.Missouri <strong>College</strong> Preparatory Studies Certificate<strong>College</strong> enrollment data broken out by race/ethnicity show that,compared to all other groups, African American Missouri graduates inthe linked records who completed an ACT assessment were less likelyto go on to attend college. Only <strong>20</strong>.8% of these African Americanhigh school graduates enrolled in Missouri colleges the following fall,a significantly smaller share compared to their Hispanic (34.6%),Caucasian (36.4%), and Asian (36.9%) classmates.Postsecondary Enrollment by Secondary System Exit TypeExit Type Count % of TotalDrop Out 9 0.1%Graduated - No <strong>College</strong> Prep Cert 6,064 62.9%Graduated - <strong>College</strong> Prep Cert 3,574 37.0%Total 9,647 100.0%The Missouri State Board of <strong>Education</strong> awards the <strong>College</strong> Preparatory Studies Certificate (CPSC) to Missouri students who successfully complete a rigorous academicprogram in high school. The certificate is awarded in addition to the regular high school diploma granted by local school districts. Created in 1985, the certificate isdesigned to provide incentive and recognition for public and non-public high school students who exceed the state’s minimum graduation requirements. In 1994, the StateBoard of <strong>Education</strong> revised its requirements for the CPSC in order to align with the “Core Curriculum” standards recommended by the Coordinating Board for Higher<strong>Education</strong> as a basis for college admissions in Missouri. Awarding the <strong>College</strong> Preparatory Studies Certificate is voluntary on the part of school districts, and meeting therequirements is voluntary on the part of the students. While the certificate is primarily intended as an incentive for college-bound students, those who are not planningto enter college also may wish to work toward earning the award. School officials are encouraged to use the program to encourage ALL students to pursue excellence intheir high school studies.For more information, visit www.dese.mo.gov.
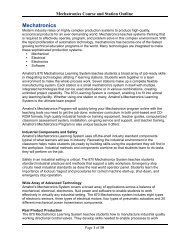
650.0%40.0%30.0%<strong>20</strong>.0%10.0%0.0%Higher <strong>Education</strong> Enrollment (<strong>20</strong>08-09) of<strong>20</strong>08 Missouri High School Graduates10.3%12.1%Low-income2 Year 4 Year23.6%16.8%Not low-incomeSocioeconomic TrendsLinked data demonstrated that lowincomestudents who completed an ACTassessment in Missouri were less likely toenroll in higher education compared toMissouri students with higher familyincome levels. Analysis of matchedstudent records shows that 22.4% ofMissouri <strong>20</strong>08 high school exiters whocompleted an ACT assessment who wereeligible for free or reduced price lunchenrolled in higher education in <strong>20</strong>08-09,compared to 40.4% of Missouri studentswho were not eligible for free/reducedlunches.National School Lunch ProgramThe National School Lunch Program isa federally assisted meal programoperating in public and nonprofitprivate schools and residential childcare institutions. It providesnutritionally balanced, low-cost orfree lunches to children each schoolday. The program was establishedunder the National School Lunch Act,signed by President Harry Truman in1946.Children from households withincomes less than 130% of povertyare eligible for free lunches; thosefrom households below 185% ofpoverty are eligible for reduced-pricelunches.Core Curriculum ParticipationFor the purposes of this report researchers defined low-income as acombination of either free or reduced lunch status. Researchers often use freeor reduced price lunch (FRPL) enrollment figures as a proxy for poverty atthe school level. Accordingly, annual free/reduced lunch data is regularly usedwithin school districts to determine a school’s eligibility for Title I funds. It isalso used as a proxy for low-income status when determining whether asubgroup of needy students is making Adequate Yearly Progress (AYP) underNo Child Left Behind.Additional breakouts were created to investigate the impact of high schoolstudent participation in the Missouri Core Curriculum standards on enrollmentin Missouri colleges. To date, the Missouri Department of Higher <strong>Education</strong>has not required 2-year colleges to report student information about CoreCurriculum participation, which accounts for the large percentage of studentswith “unknown” Core Curriculum status (42.7%).For more information, visithttp://www.fns.usda.gov/cnd/Lunch/Public Postsecondary Enrollment by Core Curriculum IndicatorEnrollment by Core Curriculum Indicator Count % of Total2 Year Institutions 4,196No 28 0.3%Unknown/NA 4,121 42.7%Yes 47 0.5%4 Year Institutions 5,451Equivalent 256 2.7%No 145 1.5%In Spirit 187 1.9%Unknown/NA 177 1.8%Yes 4,686 48.6%Total 9,647 100.0%Missouri Core CurriculumThe Coordinating Board for Higher <strong>Education</strong> (CBHE) High School Core Curriculum policy guidelines were aligned in <strong>20</strong>06 with the new graduation requirements adopted bythe State Board of <strong>Education</strong>. The High School Core Curriculum policy guidelines are designed to ensure consistent messages to high school students about the importanceof preparation for collegiate-level work and alignment with State Board of <strong>Education</strong> graduation requirements. The CBHE 24-unit high school core curriculum has beenrecommended for full implementation beginning with the Missouri high school graduating class of <strong>20</strong>10.For more information, visit www.dhe.mo.gov
7A+ Program EligibilityMatched record analysis showed that A+ eligible high school graduates were over-represented among those who provided a valid social securitynumber in the K-12 student record system. This overrepresentation of A+ students with valid social security numbers was likely due to the fact thatcolleges in Missouri have historically needed valid social security numbers to request A+ payments from the K-12 system as part of the A+ program.Breakouts of matched data by gender showed that although 28.9% of female and <strong>20</strong>.8% of male high school graduates in the linked records whohad completed an ACT assessment had completed requirements for A+ eligibility, they made up 50.4% of the female and 43.1% of the malestudents in the linked records enrolling in college in the fall of <strong>20</strong>08.Additional breakouts by race/ethnicity showed that 30.1% ofCaucasian exiters who had completed an ACT assessment inthe linked records had completed eligibility requirements,Missouri High School Graduation and Higher <strong>Education</strong> Enrollment (<strong>20</strong>08-09)by A+ Eligibility by Gendercompared to 11.3% of Hispanics and 7.6% of African- 100.0%American students. In fall <strong>20</strong>08 higher education90.0%enrollment records, 48.8% of enrolled Caucasian students80.0%in the linked records were A+ eligible, compared to45.5% of Hispanics and 30.2% of African-American70.0%56.9%71.1%students.60.0% 79.2%49.6%Breakouts by income status show that while 17.8% ofA+ eligible high school graduates who had completed an50.0%40.0%A+ EligibleACT assessment in the linked records in Missouri were30.0%enrolled for free or reduced lunch they constituted 16%50.4%<strong>20</strong>.0%43.1%of those enrolling for college in the fall, an enrollment28.9%trend vastly different than that for low income students 10.0% <strong>20</strong>.8%overall.0.0%The data suggest that A+ eligibility contributed toMale Female Male Femalegreatly increased changes for college attendance forpopulations that normally would be less likely to attend.High School Graduates Higher <strong>Education</strong> EnrolleesNot A+EligibleMissouri A+ Schools ProgramThe A+ Schools Program was created in 1993 by Missouri state law as an incentive for improving Missouri’s high schools. The primary goal of the A+ Schools Program isto ensure that all students who graduate from Missouri high schools are well prepared to pursue advanced education and/or employment.Once a high school successfully meets the program requirements, it is formally designated by the State Board of <strong>Education</strong>. To date, the Board has designated 274 publichigh schools as A+ schools.Students who graduate from a designated A+ high school may qualify for a state-paid financial incentive to attend any public community college or career/technicalschool in Missouri if the students successfully meet the following requirements: (1) enter into a written agreement with the high school prior to graduation, (2) attend adesignated school for three consecutive years immediately prior to graduation, (3) graduate with an overall GPA of 2.5 points or higher on a 4-point scale, (4) have anoverall attendance rate of at least 95 percent for grades 9-12, (5) perform 50 hours of district-supervised, unpaid tutoring or mentoring, (6) maintain a record of goodcitizenship and avoid the use of drugs and alcohol.For more information, visit www.dese.mo.gov
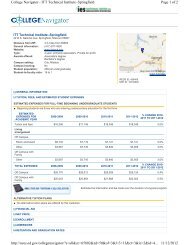
8Out-of-State and Private Institution TrendsMissouri’s Bright Flight scholarship is designed to combat so-called “brain drain”—the siphoning of gifted students to out-of-state colleges.Researchers analyzed data on <strong>20</strong>08 Missouri high school graduates that were linked with data from the National Student Clearinghouse (NSC) toexamine patterns of college-going behavior in students whose behavior may have potentially been affected by the scholarship. In <strong>20</strong>08-09, BrightFlight was available to high school graduates scoring a 31 or better on the ACT. For this analysis In-State / Out-of-State status was based on thecharacteristics of the first college students that attended following high school graduation.100%Likelihood of Any Missouri <strong>College</strong> Attendanceby ACT Score, <strong>20</strong>08 High School Graduates90%Percent Found in NSC Returns80%70%60%50%%MO%In Any State40%12 13 14 15 16 17 18 19 <strong>20</strong> 21 22 23 24 25 26 27 28 29 30 31 32 33 34 35Maximum ACT Composite ScoreThe analysis has revealed evidence that the Missouri Bright Flight program encouragedenrollment at Missouri postsecondary institutions among those who just met theeligibility threshold as suggested by the spike in Missouri college attendance in theabove graphic. For high school graduates with even greater aptitude (ACT scores of 33or above), the picture was less clear. Researchers speculated that this may be partiallydue to inadequate sample size at increasing aptitude levels, and partially dueconstraints on the ability to represent a broad cross-section of Missouri high schoolgraduates in the study sample.To the right are the top states for college enrollment among Missouri high schoolgraduates scoring a 28 or better on the ACT; there were 1,129 students scoring at thatlevel. The 'Not Found' entry in the list denotes students not enrolled in an NSCparticipatingpostsecondary school immediately following high school graduation.Place of <strong>College</strong> Attandance for Missouri <strong>20</strong>08 HighSchool Graduates, ACT Score of 28 or HigherStatePercentMissouri 73.5%Not Found 7.5%Illinois 2.6%Kansas 2.2%Arkansas 1.7%Iowa 1.5%Indiana 1.2%California 1.0%Texas 0.9%Tennessee 0.7%
9High School Graduates- <strong>College</strong> Remediation<strong>College</strong> Preparatory Certificate CompletionResearchers also linked records for graduates of Missouri publichigh school students with enrollment data from Missouri highereducation institutions and ACT assessment records to analyze trendsin those enrolled in remedial college courses.Missouri high school students who completed a college preparatorycertificate and completed an ACT assessment were significantly lesslikely to enroll in remedial college courses the following fall. For<strong>20</strong>08-09 Missouri higher education institutions, only 7.9% of allenrollees in remedial classes had completed the high school collegepreparatory certification the previous spring.As the new MDHE core standards become mandatory for publicMissouri higher education institutions, the remediation rate maydecrease over time.Postsecondary Remediation by High School <strong>College</strong> Preparatory CertificateCompletion38.7%40.0%30.0%<strong>20</strong>.0%10.0%0.0%MathEnglish22.8%Reading13.0%5.6%2.0%0.5%Did Not CompleteCompleted CertificatePostsecondary Remediation by High School Lunch Status7.7%Reading14.1%UnsubsidizedEnglish25.9%8.8%MathReduced19.2%34.7%19.4%Free30.4%39.2%0.0% 10.0% <strong>20</strong>.0% 30.0% 40.0%Average %Socioeconomic TrendsDifferences in remedial higher education enrollment were found forMissouri high school students in the linked records receiving free orreduced lunches. For <strong>20</strong>08 Missouri high school graduates that completedan ACT assessment and enrolled in Missouri colleges the following fall,53.7% of students receiving free lunches were enrolled in remedialcollegiate courses compared to 32.5% of students receiving full pricelunches.Postsecondary Remediation by High School SizeHigh School SizeAdditional analysis on college remediation trends wasconducted with breakouts by size of high school. Matcheddata indicate that Missouri high school students whoenrolled in Missouri public colleges and completed an ACTassessment were least likely to be enrolled in remedialcourses if they attend a high school with a populationbetween 251 and 500 students. The greatest likelihood ofbeing enrolled in remedial collegiate courses was seen inmatched records for students that attended the smallestand largest high schools by size in Missouri.High School Size13.8%Greater than 50017.6%31.1%251-5003.6%Reading11.7%21.1%English51-2506.1%14.0%Math26.0%14.5%Less than or equal to 5019.3%37.4%0.0% 10.0% <strong>20</strong>.0% 30.0% 40.0%Average %
10ACT Test ScoresOnly 2% of Missouri high school graduates in the linked records enrolled in higher education that were determined by ACT to be college ready (asdefined by having an ACT Math sub score of 21 or greater) were enrolled in remedial math coursework compared to 38% of those below a 21, and48% of those without an ACT score.Postsecondary Remediation by ACT Composite ScoreUnfortunately significant numbers of potentially non-preparedstudents were not enrolled. As many as 50% of Missouri0.0%students not enrolled in remedial education had ACT Math24-274.0%scores below the ACT benchmark. These numbers may be2.0%1.4%skewed since there is discrepancy across institutions as to19-235.7%Readingwhich courses are considered “remedial”. While some18.7%English9.7%include courses like “Intermediate Algebra”, others do not.Similar to Math, only 5% of English ready and 1% ofreading-ready ACT Missouri students were enrolled inremedial education in Missouri higher education institutions.Yet 30% of those not in English remediation and 43% notin reading were below the respective ACT benchmarks.ACT Composite Score17-181-16Unknown21.2%28.6%27.4%33.6%45.2%49.9%51.9%62.1%0.0% 10.0% <strong>20</strong>.0% 30.0% 40.0% 50.0% 60.0% 70.0%MathPublic Postsecondary Remediation by Race/EthnicityAfrican American7.2%Caucasian14.1%7.5%Hispanic15.8%Asian / Pacific Islander6.5%16.1%19.0%11.2%Other19.5%30.6%38.4%45.9%26.3%31.5%32.0%0.0% 10.0% <strong>20</strong>.0% 30.0% 40.0% 50.0%Average %ReadingEnglishMathAverage %Demographic TrendsBreakouts of remediation data by race show that, anaverage total of 33.0% of Caucasians in the linkedrecords that completed an ACT assessment were inremedial coursework in Missouri higher educationinstitutions compared to 61.6% of African-Americansand 36.8% of Hispanics.The matched data on postsecondary remediationdisaggregated by gender did not show any significantgender differences in remedial placement for male(32.8%) and female (37.2%) Missouri high schoolgraduates in the linked records.Defining Remedial Coursework in Missouri Higher <strong>Education</strong> InstitutionsRemedial and developmental education courses are instructional courses designed for students who are deficient in the general competencies necessary forenrollment in a regular postsecondary curriculum and educational setting. Remedial and developmental courses are typically credit bearing, but do notusually meet general education requirements for a bachelor of arts, associate of arts or fulfilling the 42 credit hour transfer block course work. Missouripublic higher education institutions each establish their own methods of determining student need for remediation. While most schools have established ACTcut scores in math, English and reading as a guideline for their institution, there are significant differences across institutions.
11<strong>College</strong> Student Follow-upResearchers conducted analysis on matched records for graduates of 2- and 4-year Missouri public higher education institutions from the <strong>20</strong>06-07academic year, excluding students who appeared as re-enrolled in <strong>20</strong>07-08 at a public institution. Also excluded from this analysis were records fordoctoral and professional graduates, which the researchers assumed would not be immediately enrolling in other institutions and had completed theireducation for the short-term. A sample of 13,350 records was submitted to the National Student Clearinghouse for matching against: Private Missourihigher education institutions, Proprietary Missouri higher education institutions, or Out-of-state higher education institutions.Analysis of the returned, matched records from NSC showed that a total of 3,600 Missouri 2 and 4-year graduates (27.0%) were found to havecontinued their higher education by re-enrolling after their graduating term.Co ntinuing Postsecondary Enrollment o f Missouri Postsecondary Graduatesb y Ty pe o f Institution44.1%15.5%39.8%Independent 4-Year Public 4-Year Public 2-Year• Leading states for re-enrollment were Missouri (2,329), Kansas, andIllinois (172 each), Arizona (99), and Iowa (63).• The leading institution for in-state enrollment was the University ofMissouri (all campuses) at 390 students. Following (and breakingapart campuses) were Webster (218), Lindenwood (147), University ofMissouri St. Louis (139), University of Missouri Kansas City (128), andMissouri State (126). St. Louis <strong>Community</strong> <strong>College</strong> just misses the top5, with 121 completers enrolled.• Leading out-of-state institutions included the University of Phoenix(70, see AZ above), KU and KU Medical School (58 combined),Southern Illinois University (40), Johnson County <strong>Community</strong> <strong>College</strong>(36), and Graceland University (19).<strong>College</strong> DropoutsAdditional analysis was conducted toexamine whether student academiccharacteristics would predispose themto transfer or not transfer to anycollege after disappearing from publicsector college enrollment records.<strong>20</strong>07-08 Public <strong>College</strong> Drop-Outs: NSC Follow-UpTransferred toExpectationStopped-OutIn-State Private<strong>College</strong>TransferredOut-of-State Not FoundNot Expected to Transfer 12.6% 9.7% 11.4% 66.2%Expected to Transfer <strong>20</strong>.9% 10.0% 10.8% 58.3%*A "drop-out" here is defined as a student enrolled at a Missouri public college in <strong>20</strong>07-08 who did not re-enroll in Fall <strong>20</strong>08.*"Stop-out" is defined as a drop-out who later re-enrolled at a public college, starting in Spring <strong>20</strong>09.*"Expectation of transfer" is defined as a student who completed at least 12 credit hours and earned a cumulative GPA of at least 2.0 as of his or herlast term enrolled in <strong>20</strong>07-08.Previous research had suggested that students who maintain satisfactory academic progress up to the date of withdrawal from college are more likelyto continue their education in the future compared to students who do not have a strong academic record.The analysis suggests that students with markers of academic progress were more likely to re-enroll at any college than students without a strongacademic record. Such students were also more likely to have “stopped-out”—that is, to have taken a break from college before re-enrolling in apublic college—compared to their counterparts.Interestingly, even though the students in the “Expected to Transfer” group did transfer more often than their counterparts overall, they were lesslikely to be found in an out-of-state school specifically, though the difference is slight.
12STEM Degree Completer TrendsResearchers also conducted analysis on matched records of graduates of Missouri public higher education institutions with NSC records to look attrends for STEM degree completers.The analysis suggests that STEM completers earning an Associate’s degree were much less likely to pursue further study at the post-secondary levelthan non-STEM completers with the same level of attainment. The differences for other degree levels were slight; the difference for bachelor’s degreeholderswas statistically negligible. Meanwhile, both certificate and non-terminal graduate degree holders were slightly more likely to consideradditional training if they had a STEM background.Non-STEM Completers (<strong>20</strong>06-07): NSC Follow-UpIn-State% Out-of-State % Not-FoundAward Type % Public % PrivateCertificate 34.8% 2.2% 2.3% 60.6%Associate's 45.8% 11.8% 5.2% 37.2%Bachelor's 18.7% 6.5% 10.0% 64.7%Non-Terminal Graduate Credential 11.2% 2.4% 6.0% 80.3%STEM Completers (<strong>20</strong>06-07): NSC Follow-UpIn-State% Out-of-State % Not-FoundAward Type % Public % PrivateCertificate 35.7% 5.4% 1.7% 57.1%Associate's <strong>20</strong>.5% 15.8% 6.2% 57.4%Bachelor's <strong>20</strong>.6% 5.8% 9.5% 64.2%Non-Terminal Graduate Credential 14.2% 3.1% 5.5% 77.2%Missouri STEM Completer TrendsOverall trends in the number and characteristics of STEM degree completers indicated that Missouri has an equal share of female (50.6%) and male (49.4%)of students pursuing STEM fields. The top STEM degree programs for the <strong>20</strong>06-07 degree completers were:Health Professions and Related Clinical Sciences 35.3%Engineering 17.0%Biological and Biomedical Sciences 9.9%Computer and Information Sciences and Support Services 8.6%Engineering Technologies/Technicians 6.6%
13<strong>College</strong> Graduates Employment TrendsResearchers also conducted analysis on matched records ofgraduates of Missouri public higher education institutions withwage and employment records. Analysis was first conducted to$14,000look at trends in wages by gender and race/ethnicity.$12,000Demographic Trends$10,000Of the 35,903 Missouri post secondary completers for academicyear <strong>20</strong>07-<strong>20</strong>08, 21,081 (58.7%) were female and 14,818$8,000(41.3%) were male. Caucasians comprised 80.4% (28,874) and $6,000African Americans comprised 6.4% (2,298) of these completers. $4,000The data demonstrate that Missouri female college graduates$2,000earned less than their male counterparts for all degree levels with$0the exception of attainment of a Professional degree. The largestdisparity in earnings after completion of a degree occurred forMissouri females that attained a Mastersdegree (77.5% of male wages) and a Doctorate degree (81.7% of male wages).Average Wage (<strong>20</strong>08Q3) for Missouri <strong>College</strong> Graduates by Gender$7,145$5,<strong>20</strong>7 $5,575$4,673 $4,582AssociatesDegreeBachelorsDegreeMore mixed results were found when comparing wages for Missouri college graduates by race/ethnicity. Wage disparities between African Americanscollege graduates and their Caucasian counterparts did not occur until attainment of a Master’s degree or higher. Hispanic Missouri college graduatesconsistently earned less than both African American and Caucasian students across all degree levels for which data was available.FemaleMaleMastersDegree$13,322$12,315$10,877$10,515$9,214DoctorateProfessionalDegree$14,000$12,000$10,000$8,000$6,000$4,000$2,000$0AssociatesDegreeAverage Wage ( <strong>20</strong>08Q3) for <strong>College</strong> Graduates by RaceBachelorsDegreeMastersDegreeDoctorateHispanic African American CaucasianProfessionalDegree*Wage Data for some Hispanic Graduates and for all "Other" racial groupings suppressed for small cellsizes.Missouri Unemployment Insurance WageRecordsWage records are a method ofdetermining unemployment insurance (UI)benefits based on quarterly employeewage reports already filed by employerswith the state's Unemployment InsuranceAgency (UIA). Under federal law,employers are required to submit eachemployee's quarterly wage records. InMissouri, unemployment insurance isadministered by the Missouri Departmentof Labor and Industrial Relations –Division of Employment Security withfunding from the federal government.
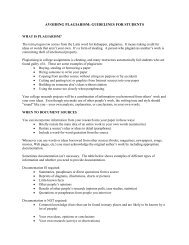
14Engineering TechnologiesCommunication, TechnologiesVisual and Performing ArtsMETS InitiativeHealth ProfessionsIndustrial ArtsComputer ScienceBusiness ManagementAverage Wage (<strong>20</strong>08Q3) for <strong>College</strong> Graduates -Associates Degree Completers by S ubjectSecurity ProfessionsLiberal ArtsThe Math, Engineering, Technology, and Science (METS)initiative in Missouri, led by the Missouri METS Coalition, isdesigned to raise awareness and to recognize the challengesthat Missouri will face in the coming years if more studentsare not fully prepared for careers that require knowledgeand skills in mathematics, engineering, technology, andscience.The initiative has identified four strategic challenges thatare central to improving METS-related skills education inMissouri:1. Improve all students’ performance from prekindergartenthrough graduate education,2. Expand the pool of students motivated topursuing science, technology, engineering, andmathematical occupations,3. Expand the pool of Missouri’s teachers who focuson these four gateway skills areas, and4. Increase the public awareness of the importanceof gateway skills industries and jobs in enhancingMissouri’s competitiveness and innovation.For more information, visit: www.missourimets.com$3,934$3,693$3,601$4,454$4,298$6,704$6,254$8,<strong>20</strong>3$7,627EngineeringHealth ProfessionsComputer ScienceEngineering TechnologiesBusiness ManagementLiberal ArtsMath and StatisticsCommunication, TechnologiesArchitectureAgricultureNatural ResourcesSecurity ProfessionsPublic AdminPhysical ScienceInterdisciplinary StudiesFamily and ConsumerSocial StudiesCommunication, JournalismParks and RecreationBiological & Medical<strong>Education</strong>Foreign LanguagesPsychologyHistoryEnglishEthnic and Area StudiesVisual and Performing ArtsPhilosophyType of Degree/Subject AreaMissouri <strong>20</strong>08 graduates that completed a Health Professions Associate’sdegree earned an average wage comparable to the wages earned forMissouri graduates with an Engineering Technologies Bachelor’s degree.For Missouri graduates of 4-year public institutions, those thatgraduated with STEM-related degree enjoyed higher wages in the fallfollowing graduation than many of their counterparts with non-STEMrelateddegrees. The one exception to this trend was for graduates withdegrees in STEM-related teacher education.Average Wages (<strong>20</strong>08Q3) for <strong>College</strong> Graduates-Bachelors Degree Completers by Subject$3,415$2,953$3,943$3,851$3,827$3,708$3,701$3,611$3,588$4,635$4,557$4,535$4,458$4,167$5,040$5,013$4,884$4,787$5,797$5,658$5,555$5,433$6,459$6,144$8,250$8,949$8,902$11,197
15Average Wages (<strong>20</strong>08Q3) for <strong>College</strong> Graduates-Masters Degree Completers by SubjectOf the Missouri <strong>20</strong>08 graduates that completed a Master’s degree,four of the top five earnings were for those that completed theirdegree in a STEM-related subject of study.EngineeringEngineering TechnologiesComputer ScienceHealth ProfessionsBusiness ManagementFamily and ConsumerBiological & MedicalLegalPhysical ScienceAgricultureCommunication, JournalismSecurity ProfessionsSocial StudiesInterdisciplinary StudiesLibrary SciencePublic AdminMath and StatisticsParks and RecreationLiberal Arts<strong>Education</strong>HistoryPhilosophyPsychologyEnglishTransportationForeign LanguagesVisual and Performing Arts$14,526$12,898$12,755$12,336$11,163$11,001$10,758$9,256$8,931$8,260$7,780$7,714$7,596$7,567$7,272$7,236$7,175$6,789$6,783$6,512$6,235$5,674$5,374$5,295$5,014$4,798$3,396For graduates of Missouri Doctoral degree programs, students with adegree in <strong>Education</strong> reaped the largest benefit from having continuedtheir education in terms of earning potential.<strong>Education</strong>Interdisciplinary StudiesPhysical ScienceHealth ProfessionsEngineeringSocial StudiesPsychologyBiological & MedicalAverage Wages (<strong>20</strong>08Q3) for <strong>College</strong> Graduates-Doctoral Degree Completers by Subject$6,334$11,448$11,044$10,127$10,036$11,688$14,076$17,021One of the most interesting career pathways for Missouri students interms of wages earned is Health Professions, a common area ofstudy for many STEM-related occupations. Missouri students thatcompleted a Health Professions degree at any level of degree offered,enjoyed some of the highest wages of any subject area.Average Wages (<strong>20</strong>08Q3) for <strong>College</strong> Graduates -First Professional Degree Completers by SubjectHealth ProfessionsLegal$6,404$16,000$14,000$12,000$14,617 $10,000$8,000$6,000$4,000$2,000$0Average Wages (<strong>20</strong>08Q3) for Health Professions Degree Completersby Degree Type$8,<strong>20</strong>3$8,949$12,336$11,448$14,617Associate’s degree Bachelor’s degree Master’s degree Doctoral degree First Professionaldegree
16Date of GraduationMatched records of Missouri <strong>20</strong>08 college graduates andMissouri wage records were analyzed over time toinvestigate any effect of time of graduation on earningboth prior to and after exiting. Graduate earnings wereanalyzed over seven quarters from the first quarter of<strong>20</strong>07 to the third quarter of <strong>20</strong>08. There were 7,422(<strong>20</strong>.67%) of Missouri college completers who were notincluded in the UI wage records at any time during theperiod.Of these graduates, 5,422 (15.1%) completed their degreesin August of <strong>20</strong>07, 10,908 (30.4%) completed theirdegrees in December of <strong>20</strong>07, and 19,573 (54.5%)completed their degrees in May of <strong>20</strong>08.$14,000$12,000$10,000$8,000$6,000$8,000$7,000$6,000$5,000$4,000$3,000$2,000$1,000$0Average Wage of Missouri Masters Degree GraduatesA verage Wage o f Missouri Bachelors Degree G raduates<strong>20</strong>07 Q1 <strong>20</strong>07 Q2 <strong>20</strong>07 Q3 <strong>20</strong>07 Q4 <strong>20</strong>08 Q1 <strong>20</strong>08 Q2 <strong>20</strong>08 Q3August <strong>20</strong>07 Graduate December <strong>20</strong>07 Graduate May <strong>20</strong>08 GraduateA majority of employed Bachelors degree (54.7%),Masters degree (68.8%), and Doctoral degree (62.5%)graduates showed up consistently in the wage recordsover the entire seven quarters. Return on investmentfor a completed degree began if at all only after thedegree was completed. There was a pronouncedincrease in average wage during the quarter immediatelyfollowing completion of the degree when no otherfactors were taken into account.$4,000<strong>20</strong>07 Q1 <strong>20</strong>07 Q2 <strong>20</strong>07 Q3 <strong>20</strong>07 Q4 <strong>20</strong>08 Q1 <strong>20</strong>08 Q2 <strong>20</strong>08 Q3August <strong>20</strong>07 Graduate December <strong>20</strong>07 Graduate May <strong>20</strong>08 GraduateThe lack of significant wage growth for doctoral degreecompleters may indicate a lack of job change among thesedegree completers. The dramatic change in wage for firstprofessional degree completers may indicate a lack of abilityto take on significant employment until the degree isobtained.$15,000$14,000$13,000$12,000$11,000$10,000$9,000$8,000Average Wage of Missouri Doctoral Degree Graduates<strong>20</strong>07 Q1 <strong>20</strong>07 Q2 <strong>20</strong>07 Q3 <strong>20</strong>07 Q4 <strong>20</strong>08 Q1 <strong>20</strong>08 Q2 <strong>20</strong>08 Q3August <strong>20</strong>07 Graduate December <strong>20</strong>07 Graduate May <strong>20</strong>08 Graduate
17Subject Area by GenderAdditional analysis of matched records was conducted for gender differences in subject area of study for Bachelor’s degrees. Male and female 4-yearcollege graduates in Missouri graduated with the same types of Bachelor’s degrees overall. Of the most popular Bachelor’s degree programs (byhighest number of graduates) 17 out of <strong>20</strong> subject areas were the same for both male and female completers, with Business Management the mostpopular for both genders. However, in only 8 of the 26 different types of Bachelor’s degrees did female graduates earn more than their malecounterparts after graduation.Average Wages for <strong>College</strong> Graduates - Bachelors Degree by S ubject by GenderEngineeringComputer ScienceEngineering TechnologiesHealth ProfessionsBusiness ManagementMath and StatisticsPublic AdminInterdisciplinary StudiesLiberal ArtsSecurity ProfessionsAgricultureFamily and ConsumerPhysical ScienceMaleSocial StudiesFemaleCommunication, JournalismParks and RecreationNatural ResourcesForeign LanguagesHistory<strong>Education</strong>Biological & MedicalEthnic and Area StudiesVisual and Performing ArtsPsychologyEnglishPhilosophy$- $2,000 $4,000 $6,000 $8,000 $10,000 $12,000
18Industry Employment and WagesAdditional analysis was conducted for gender differences in industry of employment for <strong>20</strong>07-08 Missouri college graduate records matched with wagerecords for the third quarter of <strong>20</strong>08. Female college graduates of all degree types constituted the largest share of graduates finding employment inthe <strong>Education</strong>al Services and Healthcare & Social Assistance sectors. Conversely, male college graduates constituted the largest share of graduatesfinding employment in Construction, Agriculture, and Utilities industry sectors.Industry Employment (<strong>20</strong>08Q3) for <strong>College</strong> Graduates - All Degree Types<strong>Education</strong>al ServicesHealth Care & Social AssistanceRetail TradeAccommodation and Food ServicesProfessional, Scientific, & <strong>Technical</strong> ServicesPublic AdministrationFinance and InsuranceAdministrative Support & Waste ManagementManfuacturingWholesale TradeOther SevicesInformationConstructionArts, Entertainment, & RecreationReal Estate LeasingTransportation WarehousingUtilitiesManagement of CompaniesAgriculture, Forestry, Fishing, & HuntingMiningMaleFemale0 500 1,000 1,500 2,000 2,500 3,000 3,500 4,000Analysis of earnings by industry was also conducted for <strong>20</strong>07-08 college graduates of all degree types. Male college graduates earned more than theirfemale counterparts after graduation in 17 out of <strong>20</strong> industry sectors. The gender wage disparity for college graduates was largest in these industries:• Manufacturing• Information Services• Professional, Scientific, & <strong>Technical</strong> Services
19ConclusionMost if not all of the knowledge gained through this project can be transferred to the implementation of a longitudinal data system that is basedupon education and workforce data. In addition to the new analysis of linked records, other numerous tangible benefits have already accumulateddue to the work of all staff and agencies involved.In addition to the formal agreements and relationships that have been established between the P-<strong>20</strong> Council departments—discussions, dataidentification, and data linking have lead to the formation of an informal P-<strong>20</strong> Interagency Data Workgroup. Continuation of this type of workgroupto discuss issues such as data, policy, access, data repositories/warehouse functionality will provide for a useful and supported longitudinal datasystem. This project has provided an opportunity—a learning experience—which can be transferred to the implementation of a longitudinal datasystem.Included in the contractual agreement between the Missouri Department of Higher <strong>Education</strong> and OSEDA was an analysis of alternative methods ofmatching administrative records. Comparing various methods using the existing NGA Grant provided datasets as well as planning/discussing the futureuse of the MOSIS Identifier linked to social security numbers was a valuable outcome of the overall project.Going ForwardIt is the hope of the researchers that the analysis included in this report, in addition to analysis contained in the other two P-<strong>20</strong> stakeholderfeedback reports for elementary/secondary and postsecondary education, serves as a starting point for conversations about the current state ofMissouri’s P-<strong>20</strong> pipeline. While numerous reports and initiatives in the past have stated the importance of linking unit record data across P-<strong>20</strong> stateagencies, this report serves as the first attempt in Missouri to actually link and analyze such information. The purpose of such analysis is to betterinform both the general public and policy makers about various issues that Missouri students face in transitioning between the K-12, college, andworkforce systems.As statewide data systems become more integrated and robust in terms of analytical capabilities, additional and more nuanced research will bepossible over the next few years. Recent national initiatives such as the U.S. Department of <strong>Education</strong>’s Race to the Top have at their centerpiece apush for states to continue to develop and improve their P-<strong>20</strong> longitudinal data systems for the purpose of better informing policymakers andeducational reform. National leaders recognize the importance of having a seamless transition for students throughout the education system who areultimately prepared with the skills needed for the New Economy.Data gives us the roadmap to reform. It tells us where we are, where we need to go, and who is most at risk.Hopefully some day we can track kids from pre-school to high-school and from high school to college and college to career.-U.S. Secretary of <strong>Education</strong> Arne Duncan, June 8, <strong>20</strong>09