FRET with TCS SP5
FRET with TCS SP5
FRET with TCS SP5

Create successful ePaper yourself
Turn your PDF publications into a flip-book with our unique Google optimized e-Paper software.
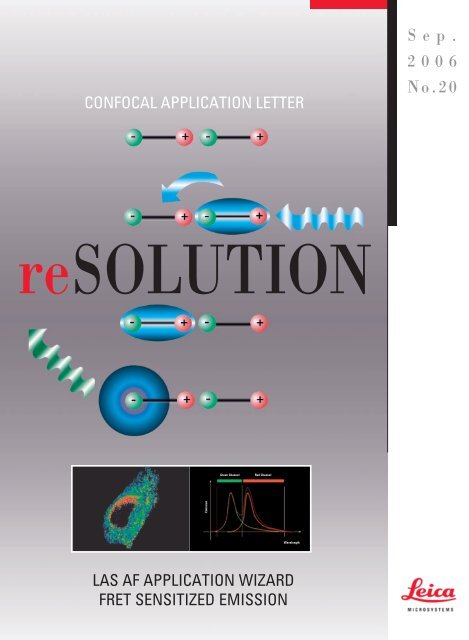
CONFOCAL APPLICATION LETTERSep.2006No.20reSOLUTIONGreen ChannelRed ChannelEmissionWavelengthLAS AF APPLICATION WIZARD<strong>FRET</strong> SENSITIZED EMISSION
<strong>FRET</strong> Sensitized Emission<strong>FRET</strong> <strong>with</strong> Leica <strong>TCS</strong> <strong>SP5</strong> (LAS AF)<strong>FRET</strong> Sensitized EmissionS1DonorS1AcceptorFluorescence Resonance Energy Transfer (<strong>FRET</strong>) is a technique,which allows insight into the interactions between proteins or moleculesin proximities beyond light microscopic resolution.The Principle:An excited fluorophore, called the donor, transfers its excited stateenergy to a light absorbing molecule which is called the acceptor.This transfer of energy is non-radiative.Sensitized Emission is one established method for the evaluation of<strong>FRET</strong> efficiencies. It can be applied to live cells as well as to fixedsamples.The Method:As this method is non-invasive, it is most frequently used for live cellexperiments. Because crosstalk is an important issue, controls andcomplex correction calculations are inherent to the method.Measurements are executed by detection of the fluorescent signalsof the donor and <strong>FRET</strong> as well as acceptor in a line by line sequentialscan acquisition.Proper excitation conditions play a major role. In the first sequence,the donor must be excited to generate donor fluorescence and sensitizedemission of the acceptor. In the second sequence, the selectiveexcitation of the acceptor will create acceptor fluorescence.<strong>FRET</strong> sample preparations must therefore include references ofdonor in the absence of the acceptor (donor only control) and acceptorin the absence of the donor (acceptor only control).Ideally, all references are included in the same preparation. Thedonor and acceptor references are used to obtain calibration coefficientsto correct for excitation and emission cross talk.It is important to be aware that throughout the entire experiment andcalibration routine, all measuring parameters such as gain, emissiondetection window, excitation intensities, zoom, format, scan speed,pinhole etc must remain constant.2Confocal Application Letter
<strong>FRET</strong> Sensitized Emission<strong>FRET</strong> Wizards in Leica Application SuiteAdvanced Fluorescence (LAS AF)➀Within the LAS AF ➀ menu bar you can find two wizards to perform<strong>FRET</strong> experiments: <strong>FRET</strong> AB (Acceptor Photo-Bleaching) and <strong>FRET</strong>SE (Sensitized Emission). This application note describes working<strong>with</strong> the <strong>FRET</strong> SE Wizard ➁.The wizard consists of 4 steps and in addition, an overview of theexperimental workflow.• Step 1: is dedicated to the imaging set-up.• Step 2: executes control and <strong>FRET</strong> measurements.• Step 3: guides through the calibration routine and calculates thecalibration coefficients.• Step 4: is dedicated to the execution of time-lapse experiments,evaluation of results and generation of experimental reports.➁Confocal Application Letter 3
Step 1: Setting of experimental conditionsAB5362C14ABCStep 2: Acquire image sequencesof controls for calibrationNote:It is vital to keep all measurements underidentical conditions. If your controls donot match the actual imaging conditions(saturation!) and if you have therefore toreadjust, all previous measurements underthe changed conditions will have to berepeated. All measurements performedunder differing conditions should be discarded!2314Confocal Application Letter
<strong>FRET</strong> Sensitized Emission<strong>FRET</strong> Sensitized Emission – Step by StepStep 1: Setting of experimental conditionsBegin the imaging set-up <strong>with</strong> the <strong>FRET</strong> sample <strong>with</strong> all fluorescenceinformation (donor, <strong>FRET</strong> and acceptor) in the same specimen. Defineimaging conditions for donor, <strong>FRET</strong> and acceptor fluorescence by followingthe workflow. You may start your experiment <strong>with</strong> previouslysaved imaging conditions. Use the Load and Save options ➀. If youwant to establish imaging conditions yourself you must start out inthe Beam Path Settings➂.1. Image acquisition of donor, <strong>FRET</strong> and acceptor will automaticallybe done in a line by line sequential scan mode, after the definitionof donor, <strong>FRET</strong> and acceptor. Start defining the donor and the <strong>FRET</strong>detection (Donor + <strong>FRET</strong>) ➁ via the Beam Path Settings window➂. Begin by simultaneous excitation and detection of the donorand acceptor (e.g.: Donor = CFP excitation 458nm; emission 462-510nm; Acceptor = YFP excitation 514nm; emission 518-580nm).This enables you to assess the fluorescence intensities, PMT gain,and laser dose for each label. Make all adjustments by using theLive button ➃. Check for appropriate imaging resolution. You maychange the zoom factor via the control panel or <strong>with</strong> the toolsunder Acquisition➄.2. Reduce now the laser light of the acceptor down to 0% ➅. Re-adjustthe acceptor PMT to be slightly below saturation. You are nowexciting only selectively for the donor and have properly definedyour conditions for the donor and <strong>FRET</strong> imaging.3. Continue by defining the acceptor set-up ➁ via the Beam PathSettings window ➂. Turn the donor excitation light down to 0%.Choose a new LUT for the directly excited acceptor signal (e.g.:light blue = donor; yellow = <strong>FRET</strong>; orange = acceptor) for betterdiscrimination. Start Live Scan➃.4. The images you see in the viewer are generated by means of a lineby line sequential scan. The first sequence A + B consists ofdonor (light blue) and <strong>FRET</strong> (Yellow). The excitation wavelength isselectively chosen for donor excitation. The second sequencecontains acceptor fluorescence (orange). The excitation light isselective for acceptor excitation.C5. Slowly increase the excitation light of the acceptor (in our example514 nm) until the signal of the acceptor (orange) is just belowsaturation. Do not change the PMT gain or offset as this willalso change the imaging conditions for the <strong>FRET</strong> (yellow) signaldetection!6. Define the number of averages for best imaging conditions. Thedesired acquisition mode may be chosen <strong>with</strong> the tools underAcquisition➄.7. Proceed to the next step Corr. Images to acquire control images ofthe specimen for calibration.Step 2: Acquire image sequences of controls for calibration1. In step 2 you may first take an image set of your <strong>FRET</strong> samplesince it is already under the scope and nicely set-up. Acquire thesequence via Capture Image ➀. The image set will be automaticallynamed ‘<strong>FRET</strong>’.2. Continue <strong>with</strong> the measurements of the controls (Donor only andAcceptor only) ➁. To keep track of the specimen choose thecorrect radio button for the according specimen.3. If controls are on separate slides you will now change specimen.For a better field of vision you may want to go back to zoom 1 to beable to find adequate cells to properly match the intensities and toavoid saturated regions. Use the function button Search Specimen➂. You now have access to all the acquisition tools needed.When you exit Search Specimen you will automatically return tothe zoom factor and resolution conditions of all previous measurementsin the experiment.4. Proceed from Corr. Images to the next step Corr. Factors to generatecalibration factors.Confocal Application Letter 5
2Step 3: Calibration13Step 3: Calibration➃46Confocal Application Letter
<strong>FRET</strong> Sensitized EmissionStep 3: Calibration1. Ensure you have the appropriate image set active in the experimentoverview to match the indication marked by the radio buttonin the interface ➀.2. Draw a region of interest (ROI) in the image where only donorsignal is found ➁. The mean intensities <strong>with</strong>in the ROI are shownin the workflow interface ➂. Press Accept to use values for calculationof calibration coefficients.3. Background subtraction is optional. It is only necessary if theimages show background above 0. If this is the case, draw a ROIin the image where only background signal is found and pressAccept to use these values.4. Continue likewise for acceptor only sequence.For ease of interpretation intensity distribution check the tableshowing the intensity distribution for measured specimen (e.g.CFP-YFP):IntensityCalibration Factors:1. Donor only reference generates correction factorCalibration Factors: corrects for donor cross-talk: = B/A10,90,80,70,60,50,40,30,20,10A2. The Acceptor only reference generates correctionfactors , , .CFPB = B/AEmission spectra of CFP [nm]A = Donor ChannelB = <strong>FRET</strong> Channel440 490 540 590 640Channel 1 (A) Channel 2 (B) Channel 3 (C)Specimen: <strong>FRET</strong> Signal (Donor) Signal (<strong>FRET</strong>) Signal (Acceptor)Specimen: Signal (Donor) Signal < Channel 1 No SignalDonor only(x-talk)Specimen: Very little to no Signal < Channel 3 Signal (Acceptor)Acceptor only Signal (x-excited (x-Excitation)x-talk Acceptor)5. Press Calculate Factors to generate correction factors ➃.All calculated calibration factors will be applied to the existing <strong>FRET</strong>sequences (fixed sample analysis) or any time-lapse experiment tofollow. Precondition: all measurements remain under unchangedimaging conditions.Intensity10,90,80,70,60,50,40,30,2 corrects for acceptor cross-excitation cross-talk: = A/C corrects for acceptor cross-excitation: = B/C corrects for <strong>FRET</strong> cross-talk: = A/BCYFPAcceptor selectively excitedAcceptor excited by donor excitation = A/C = B/C = A/BA = Donor ChannelB = <strong>FRET</strong> ChannelC = Acceptor Channel6. Continue to the next step Evaluation to perform live cell measurementsafter calibration and to retrieve <strong>FRET</strong> efficiencies.0,10A B440 490 540 590 640Emission spectra of YFP [nm]Confocal Application Letter 7
3Step 4: Calculation of <strong>FRET</strong> efficienciesand live cell measurements12458Confocal Application Letter
<strong>FRET</strong> Sensitized EmissionStep 4: Calculation of <strong>FRET</strong> efficiencies and live cell measurementsBefore running a time-lapse experiment you may choose the calculationmethod to calculate and represent the apparent <strong>FRET</strong> efficiencies➀. You may also change the method after running the experiment.Method 1 is automatically applied.If your <strong>FRET</strong> data shows a background above 0 you may run a backgroundsubtraction ➁. Draw a ROI in the image viewer where onlybackground signal is found ➂. Press Accept to include the backgroundsubtraction into calculations. You may also fill in a value byyourself to match background variations more precisely.For time-lapse experiments choose imaging conditions under Acquisitionin the Acquisition Mode ➃ and start your series <strong>with</strong> RunExperiment➄.Calculation of <strong>FRET</strong> efficiency:EA is the apparent <strong>FRET</strong> efficiency. A, B, C correspond to theintensities of the 3 signals (donor, <strong>FRET</strong>, acceptor) and , , and are the calibration factors generated by acceptor onlyand donor only references.Method 1:B – A x – C x E A (i) =CRef. Wouters et al., TRENDS in Cell Biology, Vol 11, No.5,May 2001: 203-211Method 2:B – A x – C x ( – x )E A (i) =C x (1 – x )Ref. Van Rheenen, J., M. Langeslag, K. Jalink: Correcting Confocal Acquisitionto Optimize Imaging of Fluorescence Resonance Energy Transfer by SensitizedEmission. Biophysical Journal, Vol. 86, April 2004: 1-13.Method 3:E A (i) =BAThe Ratiometric Calculation is used in samples <strong>with</strong> a fixedstochiometry (1:1) of donor and acceptor (e.g. Cameleons).Confocal Application Letter 9
Step 4: Calculation of <strong>FRET</strong>efficiencies and live cell measurements10Confocal Application Letter
<strong>FRET</strong> Sensitized EmissionTo see <strong>FRET</strong> and intensity values displayed in a graph during theexperiment change to the tab sheet Graph. Draw one or multiple ROIsin the image viewer to see intensities displayed in the graph.For apparent <strong>FRET</strong> efficiencies change to tab sheet Statistics.Single <strong>FRET</strong> images (e.g. fixed specimen) can be analyzed too, butwill show results only under Statistics and not in the graphicaldisplay. Change to tab sheet Statistics and use ROI functionalityto choose the appropriate regions of interest in the image.Suggested background reading:• Gadella T.W.J., G.N.M. Van der Krogt, T. Bisseling. GFP-based<strong>FRET</strong> Microscopy in Living Plant Cells. Trends Plant Sci. 4(7)287-291 (1999)• Gordon et al.: Quantitative Fluorescence Resonance EnergyTransfer Measurements Using Fluorescence Microscopy.Biophysical Journal, Vol. 74 2702-2713 (1998)• Lippincott-Schwartz, J., E. Snapp and A.K. Kenworthy. Studyingprotein dynamics in living cells. Molecular Cell Biology, 2444-456 (2001)• Van Rheenen, J., M. Langeslag, K. Jalink: Correcting ConfocalAcquisition to Optimize Imaging of Fluorescence ResonanceEnergy Transfer by Sensitized Emission. Biophysical Journal,Vol. 86 1-13 (2004)• Wouters F.S., P.J. Verveer & P.I.H. Bastiaens. Imagingbiochemistry inside cells. Trends Cell Biol., Vol. 5: 203-211(2001)• Zal T., R.J. Gascoigne: Photobleaching-Corrected <strong>FRET</strong>Efficiency Imaging of Live Cells. Biophysical Journal, Vol. 863923-3939 (2004)• Zhang, J., R.E. Campbell, A.Y. Ting, R.Y. Tsien: Creating newfluorescent probes for cell biology. Nature, Vol. 3 (2002)Confocal Application Letter 11
Leica Microsystems –the brand for outstanding productsLeica Microsystems’ mission is to be the world’s first-choice provider of innovativesolutions to our customers’ needs for vision, measurement and analysis of microstructures.Leica, the leading brand for microscopes and scientific instruments, developed fromfive brand names, all <strong>with</strong> a long tradition: Wild, Leitz, Reichert, Jung and CambridgeInstruments. Yet Leica symbolizes innovation as well as tradition.Leica Microsystems – an international company<strong>with</strong> a strong network of customer servicesAustralia: Gladesville Tel. +61 2 9879 9700 Fax +61 2 9817 8358Austria: Vienna Tel. +43 1 486 80 50 0 Fax +43 1 486 80 50 30Canada: Richmond Hill/Ontario Tel. +1 905 762 2000 Fax +1 905 762 8937Denmark: Herlev Tel. +45 4454 0101 Fax +45 4454 0111France: Rueil-Malmaison Tel. +33 1 47 32 85 85 Fax +33 1 47 32 85 86Germany: Bensheim Tel. +49 6251 136 0 Fax +49 6251 136 155Italy: Milan Tel. +39 0257 486.1 Fax +39 0257 40 3475Japan: Tokyo Tel. + 81 3 5421 2800 Fax +81 3 5421 2896Korea: Seoul Tel. +82 2 514 65 43 Fax +82 2 514 65 48Netherlands: Rijswijk Tel. +31 70 4132 100 Fax +31 70 4132 109People’s Rep. of China: Hong Kong Tel. +852 2564 6699 Fax +852 2564 4163Portugal: Lisbon Tel. +351 21 388 9112 Fax +351 21 385 4668Singapore Tel. +65 6779 7823 Fax +65 6773 0628Spain: Barcelona Tel. +34 93 494 95 30 Fax +34 93 494 95 32Sweden: Sollentuna Tel. +46 8 625 45 45 Fax +46 8 625 45 10Switzerland: Glattbrugg Tel. +41 1 809 34 34 Fax +41 1 809 34 44United Kingdom: Milton Keynes Tel. +44 1908 246 246 Fax +44 1908 609 992USA: Bannockburn/lllinois Tel. +1 847 405 0123 Fax +1 847 405 0164and representatives of Leica Microsystemsin more than 100 countries.The companies of the Leica MicrosystemsGroup operate internationallyin three business segments, where werank <strong>with</strong> the market leaders.• Microscopy SystemsOur expertise in microscopy is the basisfor all our solutions for visualization,measurement and analysis of microstructuresin life sciences and industry.With confocal laser technology andimage analysis systems, we providethree-dimensional viewing facilities andoffer new solutions for cytogenetics,pathology and materials sciences.• Specimen PreparationWe provide comprehensive systemsand services for clinical histo- andcytopathology applications, biomedicalresearch and industrial quality assurance.Our product range includesinstruments, systems and consumablesfor tissue infiltration and embedding,microtomes and cryostats as well asautomated stainers and coverslippers.• Medical EquipmentInnovative technologies in our surgicalmicroscopes offer new therapeuticapproaches in microsurgery.Copyright © Leica Microsystems CMS GmbH • Am Friedensplatz 3 • 68165 Mannheim • Germany 2006 • Tel. +49 (0)621-7028 0 • Fax +49 (0)621-7028 1028 LEICA and the Leica Logo are registered trademarks of Leica IR GmbH.Order no.: English 1593104007 • Printed on chlorine-free bleached paper. IX/06www.leica-microsystems.com/Confocal_Microscopes