Application note: White Light Laser - Department of Cell Biology and ...
Application note: White Light Laser - Department of Cell Biology and ...
Application note: White Light Laser - Department of Cell Biology and ...

You also want an ePaper? Increase the reach of your titles
YUMPU automatically turns print PDFs into web optimized ePapers that Google loves.
CONFOCAL APPLICATION LETTER<br />
August<br />
2 0 0 8<br />
No. 29<br />
reSOLUTION<br />
Solving the Challenge<br />
<strong>of</strong> Fluorescence<br />
Leica TCS SP5 X:<br />
The First COMPLETELY<br />
Tunable Confocal System<br />
K. Jalink, A. Diaspro, V. Caorsi, P. Bianchini<br />
Leica Microsystems
Fluorescence 1833 to 2008+<br />
In 1833, D. Brewster found a blood-red light in a<br />
solution <strong>of</strong> Chlorophyll at the edge <strong>of</strong> a focusing<br />
cone <strong>and</strong> in 1845, J. Herschel discovered a bluish<br />
shimmer when a quinine solution was observed<br />
in the bright sun. G. Stokes repeated those experiments<br />
<strong>and</strong> raised the first theory on the phenomenon<br />
<strong>and</strong> also coined the term Fluorescence<br />
(G. Stokes, 1852) 1 . At that time, the sun was the<br />
best light source for short wavelength, <strong>and</strong> the<br />
excitation filter was a piece <strong>of</strong> blue church glass.<br />
Emission could be separated in “transmitted fluorescence<br />
mode”, as we would call it today, when<br />
the object was looked at through a glass <strong>of</strong> dark<br />
yellow wine – the barrier filter. The fluorescent<br />
dye they observed was quinine, the working ingredient<br />
in tonic water that prevents <strong>and</strong> cures<br />
malaria fever. Quinine has a broad absorption in<br />
the UV-blue range <strong>and</strong> emits green-yellow light.<br />
Commercial Tonic Water is therefore a very popular<br />
specimen to introduce beginners into the<br />
world <strong>of</strong> fluorescence effects.<br />
Fluorescence was introduced as a new method<br />
in microscopy in the beginning <strong>of</strong> the 20th century,<br />
<strong>and</strong> the first commercially available fluorescence<br />
microscope was produced by Reichert in<br />
Vienna 1911. At that time, Fluorescence usually<br />
was done only with UV-illumination, using Cobaltglass<br />
in front <strong>of</strong> bright arc-lamps as excitation<br />
source. The samples were stained materials, that<br />
empirically were found to fluoresce, <strong>and</strong> mineral<br />
samples. At this time, the most famous biological<br />
stain available was Feulgen-stain for DNA.<br />
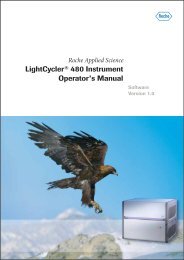
Fig 1: Feulgen stained mouse trophoblast.<br />
On the left is a fluorescence image<br />
taken with a widefield research microscope.<br />
On the right side, an optical section<br />
is recorded with confocal optics.<br />
A new world <strong>of</strong> applications was discovered<br />
when A. Coons published methods using fluorescently<br />
labeled antibodies to visualize specifically<br />
single proteins in cells, what was then known as<br />
Immunohistochemistry (Immunocytochemistry)<br />
(Coons et al 1941) 2 . Further support for fluorescence<br />
microscopy was the introduction <strong>of</strong> Fluorescence<br />
In Situ Hybridisation <strong>of</strong> DNA (Gall &<br />
Pardue) 3 . These methods soon became the most<br />
useful tools in cell biology, <strong>and</strong> also stimulated<br />
the invention <strong>of</strong> even more dyes with various<br />
colors to simultaneously stain multiple structural<br />
features, in different colors, in the same cell or<br />
nucleus.<br />
Biological research looks to underst<strong>and</strong> the processes<br />
that make up life. Therefore, researchers<br />
always look for specific stains that work in living<br />
material, without interfering with the living organism.<br />
A very powerful method was the introduction<br />
<strong>of</strong> fluorescent proteins (D. Prasher) 4 that<br />
can be expressed as endogenic stains in living<br />
cells in various colors. Not only can genetic information<br />
on expression schemes <strong>of</strong> proteins be<br />
observed but also the proteins themselves can<br />
be fluorescent genetic constructs. More recently<br />
are the development <strong>of</strong> biological markers that<br />
follow metabolic or environmental changes in<br />
selected locations <strong>of</strong> the cell.<br />
2 Confocal <strong>Application</strong> Letter
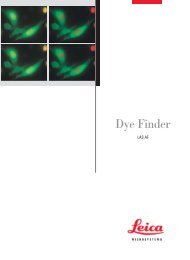
D y e S e p a r a t i o n<br />
Requirements for Fluorescence in Microscopes<br />
Fluorescence microscopy today is mainly performed<br />
by incident illumination. This improves<br />
the separation <strong>of</strong> the strong excitation light from<br />
the weakly emitted fluorescence. To accomplish<br />
this, an excitation filter is placed between an Hglamp<br />
<strong>and</strong> a beam splitting device. Beam splitters<br />
in common microscopes are dichroitic mirrors<br />
that reflect the short wavelength excitation light<br />
onto the specimen <strong>and</strong> transmit the longer wavelength<br />
<strong>of</strong> the emission. For observation, a barrier<br />
filter is placed in front <strong>of</strong> the detector, to remove<br />
as much as possible residual illumination. All<br />
these optical elements are typically mounted together<br />
in a filter block that is easily exchanged<br />
to allow observation <strong>of</strong> various stains <strong>and</strong> combinations<br />
<strong>of</strong> fluorochromes.<br />
2<br />
3<br />
1<br />
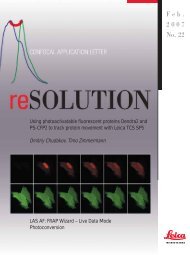
1 Excitation filter<br />
2 Dichroic mirror<br />
3 Emission filter<br />
Fig 2: Filter cube for conventional fluorescence<br />
microscopes contains all<br />
filter optics needed for a given fluorochrome<br />
or fluorochrome combination.<br />
A true confocal microscope focuses the illumination<br />
light to a single diffraction limited spot <strong>and</strong><br />
moves that spot line by line over the specimen.<br />
The technical solution for diffraction limited high<br />
intensity illumination requires laser light, which<br />
is perfectly collimated. Consequently, current<br />
confocal laser scanning microscopes employ a<br />
series <strong>of</strong> lasers that (unfortunately) emit only at<br />
distinct lines.<br />
Best cases are gas lasers, which emit a series<br />
(up to five) lines simultaneously. Nevertheless, to<br />
cope with the requirement for full spectral performance,<br />
a bulky setup <strong>of</strong> several combined lasers<br />
is necessary – still <strong>of</strong>fering only the physically<br />
possible emission lines <strong>of</strong> lasers that restrict<br />
flexibility in tuning into the correct excitation<br />
wavelength for the many fluorescent probes.<br />
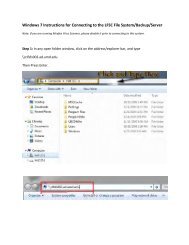
Fig 3: Some classical laser sources <strong>and</strong><br />
their main emission lines.<br />
(Note: not all lasers may be combined<br />
in one system due to restrictions with<br />
beam-combining optics or number <strong>of</strong><br />
ports.)<br />
400 450 500 550 600 650 700<br />
Confocal <strong>Application</strong> Letter 3
A New Source: The <strong>White</strong> <strong>Light</strong> <strong>Laser</strong><br />
Fig 4: Cross section <strong>of</strong> a photonic crystal<br />
fiber. The diameter <strong>of</strong> the fiber is<br />
approx. 2 µm.<br />
For flexible selection <strong>of</strong> the excitation wavelength,<br />
one would wish to have a laser that emits<br />
white light <strong>and</strong> allows selecting the excitation<br />
b<strong>and</strong> similar to wide-field microscopy – or even a<br />
laser that emits narrow lines with the frequency<br />
tunable like a radio receiver. Until recently, the<br />
only technology that provided tunable emission<br />
(in the visible range) were dyes lasers – complicated<br />
instruments that suffered from dye-degradation<br />
<strong>and</strong> very high intensity fluctuations rendering<br />
this concept useless for imaging.<br />
A new fiber technology was the breakthrough<br />
for the desired instrument: crystal photonic fibers,<br />
also called supercontinuum fibers. These<br />
fibers have a core that consists <strong>of</strong> an assembling<br />
<strong>of</strong> hollow tubes, usually arranged in a hexagonal<br />
pattern (crystal).<br />
If intense light pulses <strong>of</strong> a conventional laser are<br />
delivered at the fiber-entrance, the originally narrow<br />
line is broadened to a wide emission b<strong>and</strong> –<br />
a “white” emission. The efficiency in broadening<br />
depends on the fiber-pattern <strong>and</strong> on the mere<br />
length <strong>of</strong> the fiber. For imaging, the emission also<br />
needs to be bright enough to create a good <strong>and</strong><br />
noise-free image in a reasonable time.<br />
All these challenges have been solved 5 . The<br />
white laser used in the Leica TCS SP5 X consists<br />
<strong>of</strong> three fiber-based parts. First, a seed laser,<br />
generating a pulsed emission at 80 MHz in the<br />
infrared; second is a strong pump source, <strong>and</strong><br />
third, the supercontinuum fiber, that emits the<br />
visible light. This arrangement produces a continuous<br />
spectrum from 470 nm to 670 nm.<br />
The classical way to feed excitation light into<br />
the microscope would use a set <strong>of</strong> filters for the<br />
various spectral parts to select appropriate colors<br />
for the fluorochromes applied. A much better<br />
way is to employ an Acousto Optical Tunable Filter<br />
(AOTF) that is continuously tunable <strong>and</strong> <strong>of</strong>fers<br />
intensity regulation at the same time. In addition,<br />
the excitation regime may be reprogrammed in<br />
a matter <strong>of</strong> microseconds. Consequently, the<br />
Leica TCS SP5 X laser is an integrated design <strong>of</strong><br />
a white light emitting laser source with an appropriate<br />
acousto optical tunable filter. The control<br />
s<strong>of</strong>tware <strong>of</strong>fers sliders that can set to any wavelength<br />
in the emission range <strong>and</strong> have an additional<br />
h<strong>and</strong>le to control the intensity <strong>of</strong> the line<br />
selected. Up to 8 lines may be active simultaneously.<br />
4 Confocal <strong>Application</strong> Letter
D y e S e p a r a t i o n<br />
Fig 5: Control window for adjustment <strong>of</strong><br />
wavelength <strong>and</strong> intensity for each peak<br />
used from the white emission. Up to 8<br />
peaks could be used simultaneously.<br />
How <strong>White</strong> <strong>Laser</strong> Fits So Nicely to AOBS <strong>and</strong> SP<br />
To benefit from the tunability <strong>of</strong> the Leica WLL,<br />
it is also necessary to have the main beam splitting<br />
device following spectrally when excitation<br />
wavelengths are tuned. The perfect fit for this<br />
task is the active Acousto Optical Beam Splitter<br />
(AOBS ® ) that was introduced by Leica in 2002 6 .<br />
This device operates as a active programmable<br />
photon valve, which injects the dialed excitation<br />
light onto the sample <strong>and</strong> transmits the full emission<br />
(except for the nm size gap <strong>of</strong> the excitation<br />
line).<br />
As this device is controlled in the same way as<br />
the acousto optical tunable filter, both devices<br />
are coupled <strong>and</strong> work synchronously together<br />
without any need for the operator to select appropriate<br />
dichroics (<strong>and</strong> consequently never can<br />
select anything wrong). The AOBS <strong>of</strong>fers both<br />
full adaptability to a tunable laser source <strong>and</strong><br />
also represents the most photon-efficient way to<br />
separate excitation from emission.<br />
Another device that needs to be tunable in order<br />
to make full use <strong>of</strong> the advantages <strong>of</strong> a tunable<br />
laser <strong>and</strong> tunable beam-splitter is the detector<br />
itself. Here, Leica introduced the SP ® detector<br />
in 1997. This apparatus consists <strong>of</strong> a series <strong>of</strong><br />
spectrophotometer-elements that are coupled<br />
by mirror sliders 7 . The emission is spread into a<br />
spectrum by a prism, <strong>and</strong> the mirror-sliders direct<br />
any fraction <strong>of</strong> the spectrum onto photomultipliers.<br />
The various emissions <strong>of</strong> the fluorochromes<br />
in the sample can be separated by<br />
steplessly tunable b<strong>and</strong>s <strong>and</strong> up to five channels<br />
may be recorded simultaneously.<br />
As the light passes only a single glass-element<br />
(the prism) <strong>and</strong> is directed by highly reflective<br />
mirrors (~99% reflectance) this apparatus is the<br />
most photon-efficient design to record multiparameter<br />
fluorescence in confocal microscopes.<br />
The fully tunable SP detector adapts perfectly to<br />
the selected excitations. As an additional benefit,<br />
the spectrophotometer design inherently<br />
<strong>of</strong>fers the measurement <strong>of</strong> emission-spectra in<br />
situ.<br />
Confocal <strong>Application</strong> Letter 5
Benefit No. 1: Tune in to the Excitation Optimum<br />
If comparing excitation spectra <strong>and</strong> available<br />
emission lines <strong>of</strong> conventional lasers, the gap is<br />
obvious: most dyes cannot be excited at the position<br />
<strong>of</strong> their maximum cross section.<br />
A common dye like Alexa 488, although it is<br />
designated as a “488 nm dye”, has an excitation<br />
maximum at 500 nm, whereas the absorption at<br />
488 nm is only 75%.<br />
The white light laser allows users to steplessly<br />
tune the excitation, no matter what the name <strong>of</strong><br />
the fluorochrome is suggesting. So you may excite<br />
the fluorochrome at its maximum cross section;<br />
for Alexa 546 this would be 561 nm.<br />
Fig 6: Excitation spectra <strong>of</strong> various fluorescent<br />
proteins <strong>and</strong> excitation lines<br />
<strong>of</strong> commonly used conventional lasers<br />
(ROYB-type). Obviously, most <strong>of</strong> the<br />
shown FPs can be excited optimally<br />
with the laser combination indicated.<br />
(Courtesy: K. Jalink, Netherl<strong>and</strong>s Cancer<br />
Institute, Amsterdam)<br />
6 Confocal <strong>Application</strong> Letter
D y e S e p a r a t i o n<br />
Fig 7: Top: excitation at the peak <strong>of</strong> absorption (here with 561 nm<br />
from a DPSS laser) is restricting the b<strong>and</strong> for emission collection.<br />
Therefore, it might be beneficial to use a line that excites on<br />
the blue slope. Bottom: for Alexa 546, this could be the HeNe 543<br />
nm line. Unfortunately, this line is very weak <strong>and</strong> not efficient for<br />
a cross section <strong>of</strong> only 50%.<br />
Fig 8: Tunable excitation <strong>and</strong> ample power density allows to<br />
optimize the excitation wavelength <strong>and</strong> the collection b<strong>and</strong> for<br />
emission.<br />
Nevertheless, this is not necessarily the best<br />
position <strong>of</strong> excitation. In order to avoid excitation<br />
light to enter the detector, a certain “securitydistance”<br />
has to be kept between excitation <strong>and</strong><br />
the blue edge <strong>of</strong> the emission b<strong>and</strong> that is collected.<br />
If the stokes shift is rather low, then the<br />
residual window for emission collection might<br />
cut <strong>of</strong>f a significant part <strong>of</strong> the available photons,<br />
which is not desirable. So it sometimes does indeed<br />
make sense to excite the dye somewhat<br />
<strong>of</strong>f the peak in the blue range (Alexa 488 case)<br />
<strong>and</strong> compensate for the lesser absorption by increasing<br />
the laser intensity. Then you can collect<br />
the full emission spectrum.<br />
With the Leica tunable laser source you may also<br />
find a more efficient excitation for Alexa 546, <strong>and</strong><br />
get better images at e.g. 555 nm. Just try out <strong>and</strong><br />
evaluate the best settings during a few scans<br />
online!<br />
The combined operation <strong>of</strong> tunable excitation<br />
<strong>and</strong> tunable emission can help to find the best<br />
setting for excitation <strong>and</strong> emission: a s<strong>of</strong>tware<br />
tool is available, that acquires images at incrementing<br />
excitation wavelength (excitation scan)<br />
<strong>and</strong> also adjusts automatically the blue cut-<strong>of</strong>f <strong>of</strong><br />
the emission b<strong>and</strong>, for example always 10 nm <strong>of</strong>f<br />
the excitation to avoid reflected light to enter the<br />
detector.<br />
Furthermore, the environment in which the sample<br />
is surrounded will sometimes shift excitation.<br />
In some cases, specific dyes have been developed<br />
to exploit this phenomenon (pH or Ca +2<br />
dyes). Here, with the tunable laser you can adapt<br />
to these alterations <strong>and</strong> ensure optimal excitation<br />
under any circumstances.<br />
Confocal <strong>Application</strong> Letter 7
Benefit No. 2: Reduce Crosstalk Easily<br />
A common challenge with multiparameter fluorescence<br />
is that excitation even by a narrow line<br />
will excite not only the targeted dye, but also other<br />
dyes in the sample. In some cases, this might<br />
be beneficial, as you can excite more than one<br />
dye by the same wavelength. In most cases this<br />
is not wanted as the separation <strong>of</strong> various channels<br />
suffers from cross-excitation making some<br />
applications, like FRET experiments, difficult to<br />
work with.<br />
Of course, there are various protocols to enhance<br />
separation, <strong>and</strong> it is good practice to select dyes<br />
that separate well. It is then a good idea to start<br />
with the first step: appropriate combination <strong>of</strong><br />
excitation lines. Here again, the tunable wavelength<br />
<strong>of</strong> the white light laser source is an easy<br />
cure for cross-excitation. The longer-wavelength<br />
excitation can be moved out <strong>of</strong> the absorption <strong>of</strong><br />
the blue dye. Here, an interactive optimization<br />
for reduced cross-excitation <strong>and</strong> efficient emission-collection<br />
is easily done by dialing the excitation<br />
<strong>and</strong> adapting the emission-b<strong>and</strong> – online<br />
by a few scans only.<br />
If separation is still not optimized, the TCS SP5<br />
also <strong>of</strong>fers sequential scan: that is recording a<br />
line with the first excitation <strong>and</strong> subsequently<br />
the same line with the next excitation for the next<br />
dye – <strong>and</strong> so on. Furthermore, the SP-detector<br />
as a tunable device can be specified to collect<br />
sufficiently narrow b<strong>and</strong>s for minimal crosstalk<br />
on the emission side. If the above procedures<br />
still do not provide optimal separation, linear<br />
unmixing for dye separation – emission or excitation<br />
– is also implemented.<br />
FRET Optimized<br />
A commonly used method to obtain information<br />
on the distance <strong>of</strong> two proteins is called Förster<br />
Resonance Energy Transfer (FRET). If a fluorochrome,<br />
A, has an overlap <strong>of</strong> its excitation spectrum<br />
with the emission spectrum <strong>of</strong> a fluorochrome,<br />
D, then there is a probability, that the<br />
absorbed energy from D will pass directly without<br />
radiation to A. This allows A to emit a photon<br />
according to the emission properties <strong>of</strong> A. In<br />
FRET experiments, D is called the Donor <strong>and</strong> A is<br />
called the Acceptor.<br />
Förster Resonance Energy transfer occurs if the<br />
fluorophores distance is in the range <strong>of</strong> a few<br />
nanometers. If one can detect emission <strong>of</strong> A<br />
upon excitation <strong>of</strong> D, one can conclude that the<br />
distance is very close. By applying some calibrations,<br />
it is even possible in some cases, to roughly<br />
estimate the distance. If the fluorochromes are<br />
bound to proteins, one can estimate the spatial<br />
distances <strong>of</strong> the proteins in question.<br />
In fixed samples, the method FRET AB, that is<br />
FRET by Acceptor-Bleaching, is frequently applied.<br />
Here, the emission <strong>of</strong> the donor is measured,<br />
followed by bleaching <strong>of</strong> the acceptor<br />
molecules by sufficient high laser irradiation,<br />
<strong>and</strong> then the donor is measured again. If there<br />
was FRET before the bleaching, the donor molecule<br />
will be brighter in the second measurement,<br />
as there is no energy transferred to the acceptor<br />
<strong>and</strong> thus more fluorescence will be emitted.<br />
As an example, a FRET AB experiment with the<br />
FRET-pair Alexa 488 <strong>and</strong> Alexa 568 is described.<br />
This is only one out <strong>of</strong> a long list <strong>of</strong> possible FRET<br />
pairs, but commonly used. The bleaching <strong>of</strong> the<br />
acceptor is performed by the 543 nm HeNe laser<br />
line, if there is no better choice available. According<br />
to <strong>of</strong>ficially published data, the absorption<br />
<strong>of</strong> the donor is sufficiently low (< 2%), to not<br />
interfere with the acceptor-bleaching (fig. 9). The<br />
experiment was done as mentioned, <strong>and</strong> as a result,<br />
no increase <strong>of</strong> the donor was detectable,<br />
8 Confocal <strong>Application</strong> Letter
D y e S e p a r a t i o n<br />
so one would conclude that the proteins are not<br />
“colocalized”, <strong>and</strong> at least 10 nm apart. When<br />
measuring the excitation spectrum <strong>of</strong> the donor<br />
in situ (by white laser), it turned out, that the absorption<br />
at 543 nm is indeed much higher, about<br />
11%.<br />
When the same experiment was done with laser<br />
light tuned to 580 nm for the acceptor, the donor<br />
emission increased significantly by approx. one<br />
third – corresponding to 33% FRET-efficiency<br />
(fig. 10). 580 nm is sufficiently away from donor<br />
excitation, so the donor is not bleached during<br />
acceptor-bleaching <strong>and</strong> will emit more fluorescent<br />
light after the FRET-partner is removed. The<br />
lack <strong>of</strong> increase in the previous experiment was<br />
due to bleaching <strong>of</strong> donor by the laser light applied<br />
for acceptor-bleaching.<br />
With the white laser source it was possible to<br />
find the root cause for the problem by recording<br />
an excitation spectrum <strong>and</strong> to cure the problem<br />
by tuning to the appropriate laser wavelength.<br />
Fig 9: Excitation spectra <strong>of</strong> Alexa 488.<br />
Left: data from Invitrogen Spectra Viewer.<br />
Right: in-situ measured excitation,<br />
data taken with white laser excitation<br />
scan. (Courtesy: V. Caorsi, Genoa)<br />
Invitrogen Spectra Viewer: Abs 543<br />
= 2%<br />
Donor In-situ Excitation Spectrum<br />
Excitation at 543 = 10%<br />
Ex 488 nm<br />
CHD: 510–540 nm<br />
Ex 543 nm<br />
CHA: 630–700 nm<br />
Ex 495 nm<br />
CHD: 510–540 nm<br />
Ex 580 nm<br />
CHA: 630–700 nm<br />
Post-bleaching<br />
Pre-bleaching<br />
Pre-bleaching<br />
FRET-efficiency 0%<br />
Post-bleaching<br />
FRET-efficiency 32%<br />
Fig 10: FRET AB measurements. FRET<br />
efficiency is measured by increase <strong>of</strong><br />
donor emission after photobleaching<br />
<strong>of</strong> acceptor. In the left example with<br />
conventional lasers, donor emission<br />
is not increasing (green images in the<br />
left row). The right side shows a strong<br />
increase in donor fluorescence using<br />
a WLL tuned excitation for acceptor.<br />
(Courtesy: V. Caorsi, A. Diaspro,<br />
Genoa)<br />
Confocal <strong>Application</strong> Letter 9
Benefit No. 3: Measure Excitation Properties In Situ<br />
The white laser source in combination with an<br />
AOTF as fast programmable line-selector provides<br />
very straight forward a means to generate<br />
excitation spectra from dyes in situ. The s<strong>of</strong>tware<br />
allows for automatic incrementing the excitation<br />
wavelength while the scanner takes images<br />
at each !-position. There are two options<br />
to collect the emission. The st<strong>and</strong>ard operation<br />
will keep a preset emission b<strong>and</strong>; the result is a<br />
direct measure for excitation-dependence <strong>of</strong> the<br />
dye as a function <strong>of</strong> wavelength. A second operation<br />
mode will move the blue edge <strong>of</strong> the emission<br />
b<strong>and</strong> synchronously with the excitation in<br />
order to always record the maximally available<br />
fluorescence. This is especially valuable for<br />
screening new or unknown dyes to find out the<br />
best excitation-emission settings.<br />
Evaluation <strong>of</strong> excitation spectra is easily possible<br />
by just drawing regions <strong>of</strong> interest into<br />
the recorded images. The s<strong>of</strong>tware will provide<br />
graphs <strong>of</strong> fluorescence for all regions. As the<br />
measurement is done in the sample directly, the<br />
results are much more reliable as compared to<br />
published data. You may also measure series <strong>of</strong><br />
spectra with varying conditions <strong>of</strong> the solvent to<br />
find out about spectral changes, e.g. at various<br />
pH-levels.<br />
Fluorescent Proteins Excitation Spectra In Situ<br />
A set <strong>of</strong> new fluorescent proteins was examined<br />
by excitation scans. The data may be used to optimize<br />
excitation <strong>and</strong> reduce crosstalk when recording<br />
images with those FPs.<br />
This information is also needed when planning<br />
FRET pairs. And in general, changes in fluorescence<br />
parameters in living cells <strong>and</strong> under controlled<br />
conditions can be studied.<br />
Fig 11: Comparison <strong>of</strong> published data for<br />
excitation <strong>of</strong> mCherry <strong>and</strong> excitation<br />
scan with WLL. (Courtesy: K. Jalink,<br />
Netherl<strong>and</strong>s Cancer Institute, Amsterdam)<br />
10 Confocal <strong>Application</strong> Letter
D y e S e p a r a t i o n<br />
! 2 -Maps: More Parameters for More Information<br />
In systems with many fluorochromes – either<br />
artificially multilabelled samples or in plant material<br />
with complex mixtures <strong>of</strong> chromophores,<br />
the identification <strong>of</strong> the various molecular species<br />
by just the emission spectra is sometimes<br />
a problem. In those cases, a second parameter<br />
is very beneficial for enhanced separation. The<br />
white light laser as a source for excitation scans<br />
in combination with the SP-detector for emission<br />
scans provides this feature: by recording emission<br />
scans at a sequence <strong>of</strong> excitation wavelength,<br />
the single-dimensional information <strong>of</strong><br />
an emission spectrum can be spread out in two<br />
dimensions as excitation-emission map. Here,<br />
dyes that are indistinguishable by the emissions<br />
might be separable by their excitation parameters.<br />
Thus, the Leica TCS SP5 X <strong>of</strong>fers new tools<br />
for new research <strong>and</strong> new insights.<br />
Fig 12: Excitation – Emission maps <strong>of</strong><br />
fluorescence from bi<strong>of</strong>ilms. Two different<br />
species <strong>of</strong> Cyanobacteria are presented<br />
<strong>and</strong> show variant patterns <strong>of</strong><br />
fluorescence 8 .<br />
Literature<br />
1 Stokes, G.G. (1852) On the Change <strong>of</strong> Refrangibility <strong>of</strong> <strong>Light</strong>. Philosophical Transaction <strong>of</strong> the Royal Society <strong>of</strong> London,<br />
Vol. 142. pp. 463-562<br />
2 Coons AH, Creech HJ, Jones RN (1941) Immunological properties <strong>of</strong> an antibody containing a fluorescent group.<br />
Proc Soc Exp Biol Med 47:200-202.<br />
3 Gall, J. G. <strong>and</strong> Pardue, M. L. (1969). Formation <strong>and</strong> detection <strong>of</strong> RNA-DNA hybrid molecules in cytological preparations.<br />
Proc. Natl. Acad. Sci. USA 63, 378-383<br />
4 M Chalfie, Y Tu, G Euskirchen, WW Ward, DC Prasher: Green fluorescent protein as a marker for gene expression.<br />
Science 263 (1994) 802-05<br />
5 H. Birk <strong>and</strong> R. Storz, US Pat. 6.611.643 (2001)<br />
6 H. Birk, J. Engelhardt, R. Storz, N. Hartmann, J. Bradl <strong>and</strong> H. Ulrich. Programmable beam splitter for confocal laser<br />
scanning Microscopy. Progress in biomedical optics <strong>and</strong> imaging SPIE 3,13 16-27 ( 2002)<br />
7 J. Engelhardt US Pat. 5.886.784 (1997)<br />
8 R. Borlinghaus, H. Gugel, P. Albertano <strong>and</strong> V. Seyfried: Closing the spectral gap – the transition from fixed-parameter<br />
fluorescence to tunable devices in confocal microscopy. Proceedings <strong>of</strong> SPIE, 6090 (2006)<br />
Acknowledgements<br />
We are very thankful to Alberto Diaspro, University Genoa (Italia) <strong>and</strong> Kees Jalink, NKI Amsterdam<br />
(Nederl<strong>and</strong>) for support, system evaluation <strong>and</strong> many fruitful discussions. K. Jalink provided data<br />
on excitation spectra <strong>of</strong> fluorescent proteins. Valentina Caorsi <strong>and</strong> Paolo Bianchini (A. Diaspro’s<br />
Group) did the measurements for FRET AB.<br />
Cover image:<br />
Aut<strong>of</strong>luorescent image <strong>of</strong> chitin from Coccus sp. Color-coded z-series projection acquired on a Leica TCS SP5 X confocal system.<br />
Excitation 670 nm <strong>and</strong> detection range from 685-840 nm. (Courtesy: K. Jalink, Netherl<strong>and</strong>s Cancer Institute, Amsterdam)<br />
Confocal <strong>Application</strong> Letter 11
“With the user, for the user”<br />
Leica Microsystems<br />
Leica Microsystems operates internationally in four divisions,<br />
where we rank with the market leaders.<br />
• Life Science Division<br />
The Leica Microsystems Life Science Division supports the<br />
imaging needs <strong>of</strong> the scientific community with advanced<br />
innovation <strong>and</strong> technical expertise for the visualization,<br />
measurement, <strong>and</strong> analysis <strong>of</strong> microstructures. Our strong<br />
focus on underst<strong>and</strong>ing scientific applications puts Leica<br />
Microsystems’ customers at the leading edge <strong>of</strong> science.<br />
• Industry Division<br />
The Leica Microsystems Industry Division’s focus is to<br />
support customers’ pursuit <strong>of</strong> the highest quality end result.<br />
Leica Microsystems provide the best <strong>and</strong> most innovative<br />
imaging systems to see, measure, <strong>and</strong> analyze the microstructures<br />
in routine <strong>and</strong> research industrial applications,<br />
materials science, quality control, forensic science investigation,<br />
<strong>and</strong> educational applications.<br />
• Biosystems Division<br />
The Leica Microsystems Biosystems Division brings histopathology<br />
labs <strong>and</strong> researchers the highest-quality,<br />
most comprehensive product range. From patient to pathologist,<br />
the range includes the ideal product for each<br />
histology step <strong>and</strong> high-productivity workflow solutions<br />
for the entire lab. With complete histology systems featuring<br />
innovative automation <strong>and</strong> Novocastra reagents,<br />
Leica Microsystems creates better patient care through<br />
rapid turnaround, diagnostic confidence, <strong>and</strong> close customer<br />
collaboration.<br />
• Surgical Division<br />
The Leica Microsystems Surgical Division’s focus is to<br />
partner with <strong>and</strong> support surgeons <strong>and</strong> their care <strong>of</strong> patients<br />
with the highest-quality, most innovative surgi cal<br />
microscope technology today <strong>and</strong> into the future.<br />
The statement by Ernst Leitz in 1907, “with the user, for the user,” describes the fruitful collaboration<br />
with end users <strong>and</strong> driving force <strong>of</strong> innovation at Leica Microsystems. We have developed five<br />
br<strong>and</strong> values to live up to this tradition: Pioneering, High-end Quality, Team Spirit, Dedication to<br />
Science, <strong>and</strong> Continuous Improvement. For us, living up to these values means: Living up to Life.<br />
Active worldwide<br />
Australia: North Ryde Tel. +61 2 8870 3500 Fax +61 2 9878 1055<br />
Austria: Vienna Tel. +43 1 486 80 50 0 Fax +43 1 486 80 50 30<br />
Belgium: Groot Bijgaarden Tel. +32 2 790 98 50 Fax +32 2 790 98 68<br />
Canada: Richmond Hill/Ontario Tel. +1 905 762 2000 Fax +1 905 762 8937<br />
Denmark: Herlev Tel. +45 4454 0101 Fax +45 4454 0111<br />
France: Rueil-Malmaison Tel. +33 1 47 32 85 85 Fax +33 1 47 32 85 86<br />
Germany: Wetzlar Tel. +49 64 41 29 40 00 Fax +49 64 41 29 41 55<br />
Italy: Milan Tel. +39 02 574 861 Fax +39 02 574 03392<br />
Japan: Tokyo Tel. +81 3 5421 2800 Fax +81 3 5421 2896<br />
Korea: Seoul Tel. +82 2 514 65 43 Fax +82 2 514 65 48<br />
Netherl<strong>and</strong>s: Rijswijk Tel. +31 70 4132 100 Fax +31 70 4132 109<br />
People’s Rep. <strong>of</strong> China: Hong Kong Tel. +852 2564 6699 Fax +852 2564 4163<br />
Portugal: Lisbon Tel. +351 21 388 9112 Fax +351 21 385 4668<br />
Singapore Tel. +65 6779 7823 Fax +65 6773 0628<br />
Spain: Barcelona Tel. +34 93 494 95 30 Fax +34 93 494 95 32<br />
Sweden: Kista Tel. +46 8 625 45 45 Fax +46 8 625 45 10<br />
Switzerl<strong>and</strong>: Heerbrugg Tel. +41 71 726 34 34 Fax +41 71 726 34 44<br />
United Kingdom: Milton Keynes Tel. +44 1908 246 246 Fax +44 1908 609 992<br />
USA: Bannockburn/lllinois Tel. +1 847 405 0123 Fax +1 847 405 0164<br />
<strong>and</strong> representatives in more than 100 countries<br />
Order no. <strong>of</strong> the edition in: English 1593104016<br />
LEICA <strong>and</strong> the Leica Logo are registered trademarks <strong>of</strong> Leica IR GmbH.<br />
www.leica-microsystems.com