Findings from the 2009 Administration of the Your First College Year ...
Findings from the 2009 Administration of the Your First College Year ...
Findings from the 2009 Administration of the Your First College Year ...

Create successful ePaper yourself
Turn your PDF publications into a flip-book with our unique Google optimized e-Paper software.
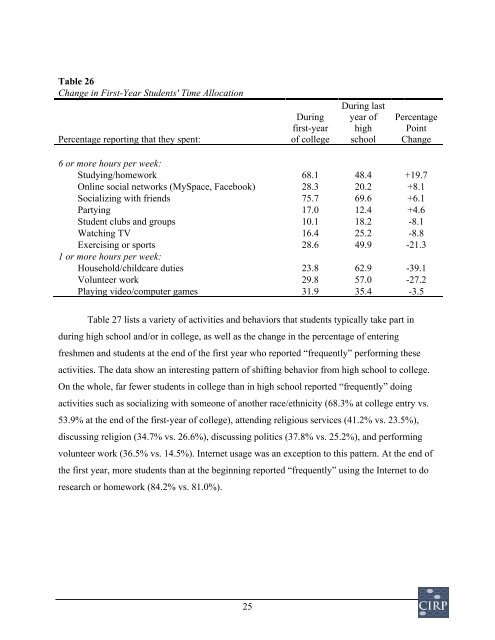
Table 26Change in <strong>First</strong>-<strong>Year</strong> Students' Time AllocationPercentage reporting that <strong>the</strong>y spent:Duringfirst-year<strong>of</strong> collegeDuring lastyear <strong>of</strong>highschoolPercentagePointChange6 or more hours per week:Studying/homework 68.1 48.4 +19.7Online social networks (MySpace, Facebook) 28.3 20.2 +8.1Socializing with friends 75.7 69.6 +6.1Partying 17.0 12.4 +4.6Student clubs and groups 10.1 18.2 -8.1Watching TV 16.4 25.2 -8.8Exercising or sports 28.6 49.9 -21.31 or more hours per week:Household/childcare duties 23.8 62.9 -39.1Volunteer work 29.8 57.0 -27.2Playing video/computer games 31.9 35.4 -3.5Table 27 lists a variety <strong>of</strong> activities and behaviors that students typically take part induring high school and/or in college, as well as <strong>the</strong> change in <strong>the</strong> percentage <strong>of</strong> enteringfreshmen and students at <strong>the</strong> end <strong>of</strong> <strong>the</strong> first year who reported “frequently” performing <strong>the</strong>seactivities. The data show an interesting pattern <strong>of</strong> shifting behavior <strong>from</strong> high school to college.On <strong>the</strong> whole, far fewer students in college than in high school reported “frequently” doingactivities such as socializing with someone <strong>of</strong> ano<strong>the</strong>r race/ethnicity (68.3% at college entry vs.53.9% at <strong>the</strong> end <strong>of</strong> <strong>the</strong> first-year <strong>of</strong> college), attending religious services (41.2% vs. 23.5%),discussing religion (34.7% vs. 26.6%), discussing politics (37.8% vs. 25.2%), and performingvolunteer work (36.5% vs. 14.5%). Internet usage was an exception to this pattern. At <strong>the</strong> end <strong>of</strong><strong>the</strong> first year, more students than at <strong>the</strong> beginning reported “frequently” using <strong>the</strong> Internet to doresearch or homework (84.2% vs. 81.0%).25