development of the hospitality quality consciousness scale - Asbbs.org
development of the hospitality quality consciousness scale - Asbbs.org
development of the hospitality quality consciousness scale - Asbbs.org
Create successful ePaper yourself
Turn your PDF publications into a flip-book with our unique Google optimized e-Paper software.
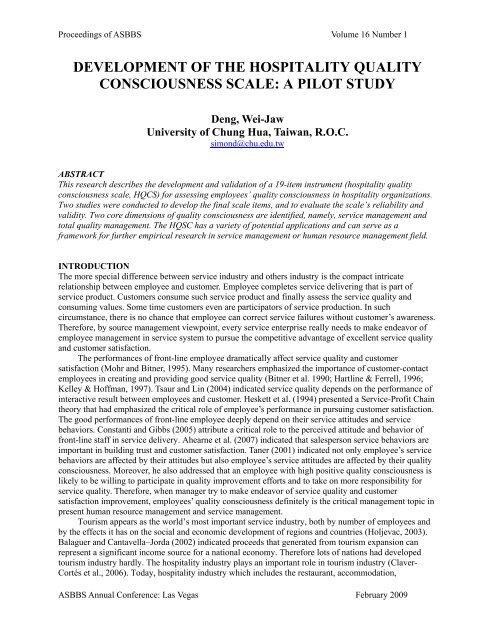
Proceedings <strong>of</strong> ASBBS Volume 16 Number 1Taoban Japanese restaurants.FIRST STUDYIn first study, <strong>the</strong> respondents are front-line employees in Tasty steak restaurants. One hundred front-lineemployees participated in this study. The survey method used in this study is mail questionnaire survey.Ten branches <strong>of</strong> Tasty steak restaurant in Nor<strong>the</strong>rn Taiwan were picked and mailed questionnaire to itsbranch manager for helping <strong>the</strong> execution <strong>of</strong> survey. After excluding questionnaires with missing values,a total <strong>of</strong> 76 valid and usable questionnaires were retained for analysis. The demographic pr<strong>of</strong>iles <strong>of</strong> <strong>the</strong>front-line employees are as follows. The sample included 16 (21%) males and 60 (79%) females among<strong>the</strong> respondents. The main age group was 21-30 and represented 69% <strong>of</strong> <strong>the</strong> respondents. Most <strong>of</strong> <strong>the</strong>respondents (75.6%) had a college or university level education. Most <strong>of</strong> <strong>the</strong> respondents (67%) had 1-3years <strong>of</strong> work experience, with an average length <strong>of</strong> 1.6 years.In <strong>the</strong> beginning <strong>of</strong> <strong>scale</strong> refinement, Churchill (1979) suggested that <strong>the</strong> purification <strong>of</strong> ameasurement instrument should begin with <strong>the</strong> computation <strong>of</strong> <strong>the</strong> coefficient α. Items with correcteditem-to-total correlation lower than 0.35 were discarded (Parasuraman et al., 1988). Moreover, if item isdeleted will increase <strong>the</strong> whole <strong>scale</strong>’s Cronbach’s α value <strong>the</strong>n it should delete from <strong>scale</strong>. As individualitems were deleted, each Cronbach’s α value was recomputed for <strong>the</strong> remaining items and <strong>the</strong> newcorrected correlations were evaluated for fur<strong>the</strong>r deletion <strong>of</strong> items. Item number 5, 22, 25 and 32 weredeleted from <strong>the</strong> analysis in first round (Table 1). Item number 21, 23 and 29 were deleted from <strong>the</strong>analysis in second round (α value <strong>of</strong> whole <strong>scale</strong> is 0.9726). No item was deleted from <strong>the</strong> analysis inthirdly round (α value <strong>of</strong> whole <strong>scale</strong> is 0.9737). Therefore, total seven items were deleted.Table 1Refinement results <strong>of</strong> reliability analysis in first roundItemnumberCorrected item-to-total correlationCronbach’s Αlpha valueIf item deleted1 .7391 .97412 .6643 .97433 .8628 .97364 .7602 .97405 .5340 .97496 .7325 .97407 .7331 .97408 .6486 .97439 .7175 .974110 .7093 .974211 .6513 .974312 .8041 .973813 .8101 .973914 .5745 .974615 .7617 .974016 .6706 .974317 .7633 .973918 .6600 .974319 .7313 .974120 .7486 .974022 .4968 .975024 .8246 .973725 .4791 .9750ASBBS Annual Conference: Las Vegas February 2009
Proceedings <strong>of</strong> ASBBS Volume 16 Number 126 .8473 .973627 .6523 .974328 .6001 .974630 .7101 .974131 .7004 .974232 .5130 .974933 .7041 .974234 .8898 .973535 .6659 .974336 .6808 .974237 .6500 .974438 .7081 .974139 .7573 .973940 .8312 .9737Cronbach’s Αlpha value <strong>of</strong> whole <strong>scale</strong> 0.9748A total <strong>of</strong> 33 items were retained for fur<strong>the</strong>r unidimensionality examination. Exploratory factoranalysis (EFA) was performed to identify and confirm <strong>the</strong> underlying structure <strong>of</strong> <strong>the</strong> items and to fur<strong>the</strong>rreduce <strong>the</strong>ir number. The Kaiser–Meyer–Olkin (KMO) measure and Bartlett’s test <strong>of</strong> sphericity were usedto ensure that <strong>the</strong> data had inherent sufficient correlations to perform EFA. In EFA analysis <strong>of</strong> this study,<strong>the</strong> principal component analysis with varimax rotation, eigenvalue exceeding 1 and factor loadingsexceeding 0.5 are used and set. The KMO index <strong>of</strong> EFA analysis under 33 items was 0.808, and Bartlett’stest <strong>of</strong> sphericity was significant at a level <strong>of</strong> 0.00, which justified <strong>the</strong> use <strong>of</strong> EFA.The first round <strong>of</strong> factor analysis was resulted in a five factors solution, which explained 74.25% <strong>of</strong>variance. To achieve a more meaningful solution, items were deleted if <strong>the</strong>y loaded equally heavily intomore than one factor, and <strong>the</strong>ir loadings were smaller than 0.55, in consideration <strong>of</strong> <strong>the</strong> small sample size(Hair et al., 1998). Each time items were deleted from <strong>the</strong> analysis, <strong>the</strong> factor analysis was re-run andcoefficient α was re-computed until a satisfactory result was achieved. In first round, Item number 10, 24and 40 were deleted because <strong>the</strong>ir factor loading were smaller than 0.55. Item number 1, 3, 7, 20, 34 and38 were deleted because <strong>the</strong>se items loaded equally heavily into more than one factor (Table 2). No itemwas deleted in second round. Therefore, total nine items were deleted in <strong>the</strong> EFA analysis. The process <strong>of</strong><strong>scale</strong> purification in this initial stage reduced <strong>the</strong> number <strong>of</strong> items from 40 to 24 items. Among <strong>the</strong>se 24items, <strong>the</strong> factor analysis extracted four factors which explained 73.23% <strong>of</strong> variance with item loadingsexceeding 0.55 (Table 3). Cronbach’s α value for each dimension ranged from 0.7518 to 0.9419. Thisdemonstrates that <strong>the</strong> <strong>scale</strong>s had considerable reliability (Cronbach’s α value for each dimension greaterthan 0.7) (Hair et al., 1998; Nunnally, 1978).Table 2Refinement results <strong>of</strong> factor analysis in first roundItem numberFactor loading1 2 3 4 58 .82327 .79130 .74515 .71113 .7046 .7032 .64328 .6253 b .624 .609ASBBS Annual Conference: Las Vegas February 2009
Proceedings <strong>of</strong> ASBBS Volume 16 Number 131 .60519 .5931 b .551 .53911 .71839 .67312 .64233 .64017 .61236 .5999 .57737 .55520 b .553 .5024 .55110 a .46826 .78934 b .519 .71735 .63838 b .579 .5087 b .558 .57324 a .51516 .73518 .70914 .68140 a .486Variance23.58 19.94 13.90 13.57 3.26explained (%)Note:a Indicate that <strong>the</strong> item was deleted because its low factor loadingb Indicate that <strong>the</strong> item was deleted because its multiple loadingTable 3Refinement results <strong>of</strong> factor analysis in second roundFactor loadingItem number8 .84127 .77230 .7506 .69515 .69213 .6852 .68328 .66731 .62511 .74539 .67636 .65612 .6549 .64533 .6331 2 3 4Variance Cronbach’s αexplained (%) value25.63 0.94222.73 0.942ASBBS Annual Conference: Las Vegas February 2009
Proceedings <strong>of</strong> ASBBS Volume 16 Number 14 .63237 .60317 .58714 .75416 .70919 .61018 .60726 .78935 .64415.71 0.8439.16 0.752SECOND STUDYIn second study, researcher sought to confirm <strong>the</strong> validity <strong>of</strong> <strong>the</strong> refined <strong>scale</strong> by analyzing a new data setobtained from ano<strong>the</strong>r survey. Using <strong>the</strong> 24-item HQCS, data were collected from respondents employedin Taoban Japanese restaurants that use same <strong>quality</strong> management system. Three hundred forty front-lineemployees from seventeen Taoban Japanese restaurants were asked to fill out <strong>the</strong> questionnaire. A total <strong>of</strong>304 available questionnaires were analyzed. The pr<strong>of</strong>ile <strong>of</strong> <strong>the</strong> respondents included that <strong>the</strong>y were, in <strong>the</strong>majority, female (76%), fewer than 40 years old (81%), with 1-3 years’ tenure at current positions (47%).Most <strong>of</strong> <strong>the</strong> respondents (72%) had a college or university level education.Confirmatory factor analysis (CFA) with maximum likelihood estimation in LISREL 8.80 wasutilized to examine <strong>the</strong> factor structure <strong>of</strong> <strong>the</strong> HQCS. Research postulated a priori measurement modellinking observed variables with latent factors, and <strong>the</strong>n tested that model for its ability to fit <strong>the</strong> data using2CFA. The fit <strong>of</strong> <strong>the</strong> measurement model for <strong>the</strong> data was based on <strong>the</strong> χ statistic, standardized rootmean square residual (SRMR), comparative fit index (CFI), and goodness-<strong>of</strong>-fit index (GFI). In <strong>the</strong> eventthat poorly fitting models emerged from <strong>the</strong> initial series <strong>of</strong> analyses, fur<strong>the</strong>r model re-specificationwould be needed to improve <strong>the</strong> model fit based on standardized residuals and modification indices.Large standardized residuals and modification indices identified pairs <strong>of</strong> indicators in which <strong>the</strong>covariance was ei<strong>the</strong>r over predicted or under predicted by <strong>the</strong> model. One <strong>of</strong> <strong>the</strong> two items was deletedbased on redundant content, salience, or content that was ambiguous for determining its placement within<strong>the</strong> model. The CFA was <strong>the</strong>n rerun to determine whe<strong>the</strong>r <strong>the</strong> modification resulted in an improved fit.This process was continued until a reasonable model was generated.The initial estimation <strong>of</strong> <strong>the</strong> 24 item <strong>of</strong> two-factor structure emotional labor model did not generate a2satisfactory result ( χ =565.92, SRMR=0.053, CFI=0.97, GFI=0.76). This indicated a poor fit between<strong>the</strong> sample data and <strong>the</strong> model. The data were subsequently subjected to a specification search aspreviously described. This search resulted in a final model consisting <strong>of</strong> 19 items (item 9, 13, 14, 31 and37 had been deleted), with 10 items loaded into <strong>the</strong> service <strong>quality</strong> factor, and 9 items loaded into <strong>the</strong>2TQM factor. The final model provided an improved and reasonable fit for <strong>the</strong> data ( χ =296.63,SRMR=0.045, CFI=0.98, GFI=0.91). Table 4 lists <strong>the</strong> dimension and attribute factor loadings andreliability scores. Both service <strong>quality</strong> and TQM indicators with loadings ranging from 0.72 to 0.87demonstrated that <strong>the</strong> HQCS attributes were moderately strong measures <strong>of</strong> employee’s <strong>quality</strong><strong>consciousness</strong>. In addition, <strong>the</strong> composite reliability for <strong>the</strong> service <strong>quality</strong> and TQM factors were 0.94and 0.93, respectively, which exceeded <strong>the</strong> recommended 0.70 (Hair et al., 1998; Nunnally, 1978), and<strong>the</strong>refore, evidenced <strong>the</strong> good internal consistency <strong>of</strong> <strong>the</strong> HELS.ASBBS Annual Conference: Las Vegas February 2009
Proceedings <strong>of</strong> ASBBS Volume 16 Number 1Table 4CFA results <strong>of</strong> HQCS (n=304)Dimension and attributeCompletelystandardized loadingsDimension/attributereliabilityErrorvarianceService <strong>quality</strong> .94 .182 Neat appearance <strong>of</strong> front-line employee will .736 .678 .24increase service <strong>quality</strong>4 Moment <strong>of</strong> truth will significantly affect service .768 .713 .23<strong>quality</strong>6 Appropriate Provision <strong>of</strong> customer required .866 .826 .12service will increase service <strong>quality</strong>8 Precise execution <strong>of</strong> role-prescribed service will .795 .743 .21increase service <strong>quality</strong>11 Short on-line waiting time will increase service .817 .766 .18<strong>quality</strong>12 Courtesy and friendliness <strong>of</strong> front-line employee .851 .807 .13will increase service <strong>quality</strong>15 Communication between customer andemployee is an important factor for affectingservice <strong>quality</strong>.811 .759 .1616 Personal attention given by front-line employeewill increase service <strong>quality</strong>17 Listening and understanding <strong>the</strong> specific needs<strong>of</strong> customers will increase service <strong>quality</strong>18 Never give any excuse for responding customerrequests will increase service <strong>quality</strong>.818 .769 .17.793 .740 .18.829 .782 .16Total <strong>quality</strong> management .93 .2319 Continuous service <strong>quality</strong> related training <strong>of</strong> .848 .797 .16company employee will increase <strong>quality</strong>competitiveness26 Effective communication between manager and .731 .658 .26employee is an important factor for affecting<strong>quality</strong> competitiveness27 Every employee willingly helps o<strong>the</strong>rs who have .825 .765 .17work related service problems will affect<strong>quality</strong> competitiveness28 Every employee has <strong>the</strong> belief that <strong>quality</strong>.872 .825 .13management is everyone’s duty will affect<strong>quality</strong> competitiveness30 Every employee has <strong>the</strong> belief that <strong>quality</strong> is <strong>the</strong> .837 .784 .23most important source <strong>of</strong> businesscompetitiveness will affect <strong>quality</strong>competitiveness33 Every employee has <strong>the</strong> belief that deliver <strong>the</strong> .717 .644 .38ASBBS Annual Conference: Las Vegas February 2009
Proceedings <strong>of</strong> ASBBS Volume 16 Number 1service right at first time will affect <strong>quality</strong>competitiveness35 Every employee willingly provides serviceimprovement idea to company will affect<strong>quality</strong> competitiveness36 Every employee positively collects relatedcustomer opinions and provides to companywill affect <strong>quality</strong> competitiveness39 Customer evaluates <strong>the</strong> consuming value byconsidering cost and <strong>the</strong> <strong>quality</strong> <strong>of</strong> wholeservice delivering system (includes service,employee and place).830 .777 .15.734 .663 .29.758 .692 .23Fit statistics2χ =296.63, SRMR=0.045, CFI=0.98, GFI=0.91Note: <strong>the</strong> number <strong>of</strong> attribute is <strong>the</strong> original item numberCONCLUSIONSIn highly global and competitive marketplace, every service enterprise really needs to make endeavor <strong>of</strong>employee management in service system to pursue <strong>the</strong> competitive advantage <strong>of</strong> excellent service <strong>quality</strong>and customer satisfaction. The <strong>quality</strong> <strong>consciousness</strong> <strong>of</strong> front-line employee affects his service attitudeand service behavior. Fur<strong>the</strong>rmore, service <strong>quality</strong> and customer satisfaction are affected by front-lineemployees’ service behavior and performance. Usually employee with high positive <strong>quality</strong> <strong>consciousness</strong>is likely to be willing to participate in <strong>quality</strong> improvement efforts and to take on more responsibility forservice <strong>quality</strong>. Therefore, when manager try to make endeavor <strong>of</strong> service <strong>quality</strong> and customersatisfaction improvement, employees’ <strong>quality</strong> <strong>consciousness</strong> definitely is <strong>the</strong> critical management topic inpresent human resource management and service management.This research proposed a novel <strong>hospitality</strong> <strong>quality</strong> <strong>consciousness</strong> <strong>scale</strong> to help restaurant forunderstanding <strong>the</strong> present situation <strong>of</strong> its employee <strong>quality</strong> <strong>consciousness</strong>. The Major dimensions <strong>of</strong>employee <strong>quality</strong> <strong>consciousness</strong> have been identified as TQM and service management, and a pool <strong>of</strong>measurement items has been confirmed. An instrument has also been formed that exhibits a high degree<strong>of</strong> validity and reliability. Fur<strong>the</strong>rmore, <strong>the</strong> HQCS is most valuable when it is used periodically to trackrestaurant employees’ <strong>quality</strong> <strong>consciousness</strong> performance and to pinpoint areas requiring moremanagerial attention and action for improving employees’ <strong>quality</strong> <strong>consciousness</strong>. In addition, humanresource manger in restaurant can use <strong>the</strong> HQSC as an assessment tool to identify <strong>the</strong> more “suitable” jobapplicant.Since research scope <strong>of</strong> this research was limited in restaurant industry, this HQCS requiresfur<strong>the</strong>r replication in different <strong>hospitality</strong> contexts to ensure its consistency and generalization. Therefore,researchers can apply this pilot HQCS and propose a general <strong>hospitality</strong> <strong>quality</strong> <strong>consciousness</strong> <strong>scale</strong> orapply this pilot HQCS in <strong>the</strong> relationship study with <strong>quality</strong> <strong>consciousness</strong>.REFERENCESAhearne, M., R. and E. Jones (2007) Examining <strong>the</strong> effect <strong>of</strong> salesperson service behavior in acompetitive context. Journal <strong>of</strong> <strong>the</strong> Academy <strong>of</strong> Marketing Science, Volume 35, Number 4, 603-616.Balaguer, L. and M. Cantavella-Jorda (2002) Tourism as a long-run economic growth factor: <strong>the</strong> Spanishcase. Applied Economics, Volume34, Number 7, 877-884.ASBBS Annual Conference: Las Vegas February 2009
Proceedings <strong>of</strong> ASBBS Volume 16 Number 1Bitner, M.J., B.H. Boom and M.S. Tetreault (1990) The service encounter: Diagnosing favorable andunfavorable incidents. Journal <strong>of</strong> Marketing, Volume 54, 71-84.Bro<strong>the</strong>rton, B. (1999) Towards a definitive view <strong>of</strong> <strong>the</strong> nature <strong>of</strong> <strong>hospitality</strong> and <strong>hospitality</strong> management.International Journal <strong>of</strong> Contemporary Hospitality Management, Volume 11, Number 4, 165-173.Byrne, J.A. (1992) Management’s New Gurus. Business Week, Volume 8, Number 4, 44-52.Chandler, G.N. and G.M. Mcevoy (2000) Human resource management, TQM, and Firm performance inSmall and Medium-Size enterprises. Entrepreneurship: Theory and Practice, Volume 25, 43-57.Churchill, G.A., Jr. (1979) A paradigm for developing better measures <strong>of</strong> marketing constructs. Journal <strong>of</strong>Marketing Research, Volume 16, 64-73.Claver-Cortés, E., J. Molina-Azorín and J. Pereira-Moliner (2006) Strategic groups in <strong>the</strong> <strong>hospitality</strong>industry: Intergroup and intragroup performance differences in Alicante, Spain. TourismManagement, Volume 27, Number 6, 1101-1116.Constanti, P. and P. Gibbs (2005) Emotional labor and surplus value: The case <strong>of</strong> holiday ‘reps’. TheService Industries Journal, Volume 25, Number 1, 103-116.Daniel, S.J., W.D. Reitsperger and T. Gregson (1995) Quality Consciousness in Japanese and U.S.electronics manufacturers: an examination <strong>of</strong> <strong>the</strong> impact <strong>of</strong> <strong>quality</strong> strategy and managementcontrol systems on perceptions <strong>of</strong> <strong>the</strong> importance <strong>of</strong> <strong>quality</strong> to expected management rewards.Management Accounting Research, Volume 6, Number 4, 367-382.DeVellis, R.F. (1991) Scale <strong>development</strong>: Theory and application. Sage, California.Hair, J.F., R.E. Anderson, R.L. Tatham and W.C. Black (1998) Multivariate data analysis. Macmillan,New York.Hartline, M.D. and O.C. Ferrell (1996) The management <strong>of</strong> customer-contact service employees: Anempirical investigation. Journal <strong>of</strong> Marketing, Volume 60, 52-70.Hartline, M.D. and O.C. Ferrell (1996) The management <strong>of</strong> customer-contact service employees: Anempirical investigation. Journal <strong>of</strong> Marketing, Volume 60, 52-70.Heskett, J.L., T.O. Jones, G.W. Loveman, W.E. Sasser and L.A. Schlesinger (1994) Putting <strong>the</strong> Service-Pr<strong>of</strong>it Chain to Work. Harvard Business Review, Volume 72, 88-99.Hinkin, T.R., J.B. Tracey and C.A. Enz (1997) Scale construction: Developing reliable and validmeasurement instruments. Journal <strong>of</strong> Hospitality and Tourism Research, Volume 21, 100-120.Holjevac, I.A. (2003) A vision <strong>of</strong> tourism and <strong>the</strong> hotel industry in <strong>the</strong> 21st century. International Journal<strong>of</strong> Hospitality Management, Volume 22, 129-134.Kelley, S.W. and K.D. H<strong>of</strong>fman (1997) An investigation <strong>of</strong> positive affect, prosocial behaviors andservice <strong>quality</strong>. Journal <strong>of</strong> Retailing, Volume 73, Number 3, 407-427.King, C.A. (1995) What is <strong>hospitality</strong>? International Journal <strong>of</strong> Hospitality Management, Volume 14,Number 3/4, 219-234.ASBBS Annual Conference: Las Vegas February 2009
Proceedings <strong>of</strong> ASBBS Volume 16 Number 1Luthans, F. (1995) Organizational Behavior, McGraw-Hill, New York.Mohr, L.A. and M.J. Bitner (1995) The Role <strong>of</strong> Employee Effort in Satisfaction with ServiceTransactions. Journal <strong>of</strong> Business Research, Volume 32, Number 3, 239-252.Nunnally, J.C. (1978) Psychometric Theory. McGraw-Hill, New York.Palmer, A. (1998) Principles <strong>of</strong> services marketing, 2nd Ed, McGraw-Hill, London.Parasuraman, A., V.A. Zeithaml and L.L. Berry (1985) A Conceptual Model <strong>of</strong> Service Quality and ItsImplications for Future Research. Journal <strong>of</strong> Marketing, Volume 49, 41-50.Parasuraman, A., V.A. Zeithaml and L.L. Berry (1988) SERVQUAL: A multiple-item <strong>scale</strong> for measuringconsumer perceptions <strong>of</strong> service <strong>quality</strong>. Journal <strong>of</strong> Retailing, Volume 64, Number 1, 12-40.Peterson, R.T. (2006) Scripts as a Training Tool for Hospitality and Tourism Employees: Selecting Topicsfor Coverage, International Journal <strong>of</strong> Hospitality & Tourism Administration, Volume 7, Number1, 63-82.Richardson, T.L. (1997) Total Quality Management. Delmar, England.Saylor, J.H (1992) TQM Field Manual, McGraw-Hill, New York.Taner, B. (2001) An Assessment <strong>of</strong> Quality Consciousness <strong>of</strong> Service Employees: An Application <strong>of</strong>Quality Consciousness Index. International Journal <strong>of</strong> Hospitality & Tourism Administration,Volume 2, 91-100.Tsaur, S.H. and Y.C. Lin (2004) Promoting service <strong>quality</strong> in tourist hotel: <strong>the</strong> role <strong>of</strong> HRM practices andservice behavior. Tourism Management, Volume 25, 417-480.Zeithaml, V.A., L.L. Berry and A. Parasuraman (1990) Delivering <strong>quality</strong> service: balancing customerperceptions and expectations, Free Press, New York.Zeithaml, V.A. and M.J. Bitner (2000) Services Marketing: Integrating Customer Focus Across <strong>the</strong> Firm,2nd Ed, McGraw-Hill, Boston.ASBBS Annual Conference: Las Vegas February 2009


