Revisiting speech rate and utterance length ... - ResearchGate
Revisiting speech rate and utterance length ... - ResearchGate
Revisiting speech rate and utterance length ... - ResearchGate

Create successful ePaper yourself
Turn your PDF publications into a flip-book with our unique Google optimized e-Paper software.
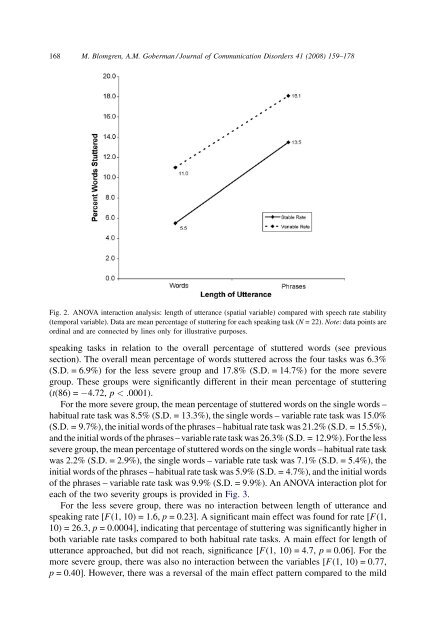
168M. Blomgren, A.M. Goberman / Journal of Communication Disorders 41 (2008) 159–178Fig. 2. ANOVA interaction analysis: <strong>length</strong> of <strong>utterance</strong> (spatial variable) compared with <strong>speech</strong> <strong>rate</strong> stability(temporal variable). Data are mean percentage of stuttering for each speaking task (N = 22). Note: data points areordinal <strong>and</strong> are connected by lines only for illustrative purposes.speaking tasks in relation to the overall percentage of stuttered words (see previoussection). The overall mean percentage of words stuttered across the four tasks was 6.3%(S.D. = 6.9%) for the less severe group <strong>and</strong> 17.8% (S.D. = 14.7%) for the more severegroup. These groups were significantly different in their mean percentage of stuttering(t(86) = 4.72, p < .0001).For the more severe group, the mean percentage of stuttered words on the single words –habitual <strong>rate</strong> task was 8.5% (S.D. = 13.3%), the single words – variable <strong>rate</strong> task was 15.0%(S.D. = 9.7%), the initial words of the phrases – habitual <strong>rate</strong> task was 21.2% (S.D. = 15.5%),<strong>and</strong> the initial words of the phrases – variable <strong>rate</strong> task was 26.3% (S.D. = 12.9%). For the lesssevere group, the mean percentage of stuttered words on the single words – habitual <strong>rate</strong> taskwas 2.2% (S.D. = 2.9%), the single words – variable <strong>rate</strong> task was 7.1% (S.D. = 5.4%), theinitial words of the phrases – habitual <strong>rate</strong> task was 5.9% (S.D. = 4.7%), <strong>and</strong> the initial wordsof the phrases – variable <strong>rate</strong> task was 9.9% (S.D. = 9.9%). An ANOVA interaction plot foreach of the two severity groups is provided in Fig. 3.For the less severe group, there was no interaction between <strong>length</strong> of <strong>utterance</strong> <strong>and</strong>speaking <strong>rate</strong> [F(1, 10) = 1.6, p = 0.23]. A significant main effect was found for <strong>rate</strong> [F(1,10) = 26.3, p = 0.0004], indicating that percentage of stuttering was significantly higher inboth variable <strong>rate</strong> tasks compared to both habitual <strong>rate</strong> tasks. A main effect for <strong>length</strong> of<strong>utterance</strong> approached, but did not reach, significance [F(1, 10) = 4.7, p = 0.06]. For themore severe group, there was also no interaction between the variables [F(1, 10) = 0.77,p = 0.40]. However, there was a reversal of the main effect pattern compared to the mild