Housing Need and Rent Burden in Colorado and its Metropolitan ...
Housing Need and Rent Burden in Colorado and its Metropolitan ...
Housing Need and Rent Burden in Colorado and its Metropolitan ...
You also want an ePaper? Increase the reach of your titles
YUMPU automatically turns print PDFs into web optimized ePapers that Google loves.
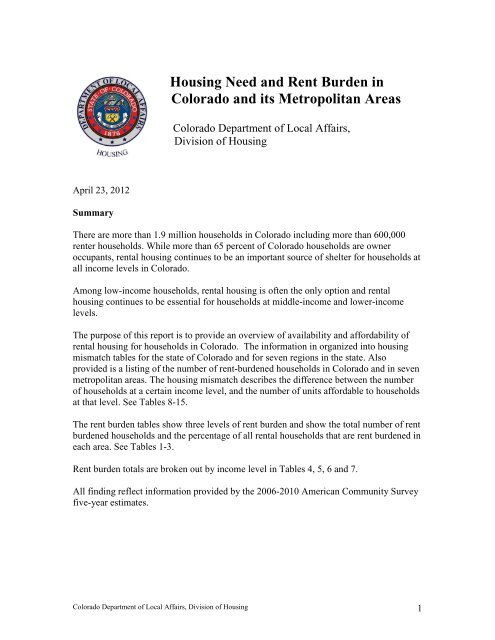
<strong>Hous<strong>in</strong>g</strong> <strong>Need</strong> <strong>and</strong> <strong>Rent</strong> <strong>Burden</strong> <strong>in</strong><strong>Colorado</strong> <strong>and</strong> <strong>its</strong> <strong>Metropolitan</strong> Areas<strong>Colorado</strong> Department of Local Affairs,Division of <strong>Hous<strong>in</strong>g</strong>April 23, 2012SummaryThere are more than 1.9 million households <strong>in</strong> <strong>Colorado</strong> <strong>in</strong>clud<strong>in</strong>g more than 600,000renter households. While more than 65 percent of <strong>Colorado</strong> households are owneroccupants, rental hous<strong>in</strong>g cont<strong>in</strong>ues to be an important source of shelter for households atall <strong>in</strong>come levels <strong>in</strong> <strong>Colorado</strong>.Among low-<strong>in</strong>come households, rental hous<strong>in</strong>g is often the only option <strong>and</strong> rentalhous<strong>in</strong>g cont<strong>in</strong>ues to be essential for households at middle-<strong>in</strong>come <strong>and</strong> lower-<strong>in</strong>comelevels.The purpose of this report is to provide an overview of availability <strong>and</strong> affordability ofrental hous<strong>in</strong>g for households <strong>in</strong> <strong>Colorado</strong>. The <strong>in</strong>formation <strong>in</strong> organized <strong>in</strong>to hous<strong>in</strong>gmismatch tables for the state of <strong>Colorado</strong> <strong>and</strong> for seven regions <strong>in</strong> the state. Alsoprovided is a list<strong>in</strong>g of the number of rent-burdened households <strong>in</strong> <strong>Colorado</strong> <strong>and</strong> <strong>in</strong> sevenmetropolitan areas. The hous<strong>in</strong>g mismatch describes the difference between the numberof households at a certa<strong>in</strong> <strong>in</strong>come level, <strong>and</strong> the number of un<strong>its</strong> affordable to householdsat that level. See Tables 8-15.The rent burden tables show three levels of rent burden <strong>and</strong> show the total number of rentburdened households <strong>and</strong> the percentage of all rental households that are rent burdened <strong>in</strong>each area. See Tables 1-3.<strong>Rent</strong> burden totals are broken out by <strong>in</strong>come level <strong>in</strong> Tables 4, 5, 6 <strong>and</strong> 7.All f<strong>in</strong>d<strong>in</strong>g reflect <strong>in</strong>formation provided by the 2006-2010 American Community Surveyfive-year estimates.<strong>Colorado</strong> Department of Local Affairs, Division of <strong>Hous<strong>in</strong>g</strong> 1
<strong>Rent</strong> <strong>Burden</strong> F<strong>in</strong>d<strong>in</strong>gs<strong>Rent</strong> burdened households are households that pay 30 percent or more of <strong>in</strong>come towardhous<strong>in</strong>g. This report shows data on households pay<strong>in</strong>g 30 percent, 35 percent, <strong>and</strong> 50percent or more of <strong>in</strong>come toward hous<strong>in</strong>g.The metropolitan areas with largest rent burdens were the Boulder area <strong>and</strong> Fort Coll<strong>in</strong>s-Lovel<strong>and</strong> area. These counties were among the counties with the highest rent burdens <strong>in</strong>all three categories.The metropolitan areas with smallest rent burdens were the Gr<strong>and</strong> Junction area <strong>and</strong> the<strong>Colorado</strong> Spr<strong>in</strong>gs area. These counties were among the counties with the lowest rentburdens <strong>in</strong> all three categories.Out of a total of 622,000 renter households <strong>in</strong> <strong>Colorado</strong>, there were approximately298,000 households (48 percent of all renter households) pay<strong>in</strong>g 30 percent or more of<strong>in</strong>come toward hous<strong>in</strong>g, <strong>and</strong> 243,000 households (39 percent of all renter households)pay<strong>in</strong>g 35 percent or more of <strong>in</strong>come toward hous<strong>in</strong>g. Approximately 150,000households (24 percent of all renter households) pay 50 percent or more of <strong>in</strong>cometoward hous<strong>in</strong>g.Among rent-burdened households <strong>in</strong> <strong>Colorado</strong>, 150,500 (50 percent) were householdswith <strong>in</strong>comes of less than $20,000 per year.<strong>Rent</strong> burden <strong>in</strong>formation is provided for six <strong>in</strong>come levels with<strong>in</strong> each metro area. Therent burden total for each <strong>in</strong>come level reflects the number of households at that <strong>in</strong>comelevel <strong>and</strong> <strong>in</strong> that metro area that pay 30 percent or more of <strong>in</strong>come toward gross rent.When broken out by <strong>in</strong>come levels, rent burdened households are most numerous at thelower <strong>in</strong>come levels. As <strong>in</strong>comes rise, fewer renters are rent burdened, <strong>and</strong> there arefewer renters at the higher <strong>in</strong>come levels.For households below the $20,000 <strong>in</strong>come level, the largest proportions of householdsthat are rent burdened were found <strong>in</strong> the Boulder area <strong>and</strong> the Fort Coll<strong>in</strong>s-Lovel<strong>and</strong> area.The areas with the smallest proportions of rent burdened households below the $20,000<strong>in</strong>come level were found <strong>in</strong> the Gr<strong>and</strong> Junction <strong>and</strong> Greeley areas. See Tables 4-7 fordetails.Mismatch F<strong>in</strong>d<strong>in</strong>gsThe mismatch <strong>in</strong> <strong>Colorado</strong> is largest at the lowest <strong>in</strong>come levels. Statewide, there are 1.8households for every unit affordable to households earn<strong>in</strong>g less than $10,000 per year.There are 2.2 households for every unit affordable to households earn<strong>in</strong>g less than$15,000 per year, <strong>and</strong> 2.0 households for every unit affordable to households earn<strong>in</strong>g lessthan $20,000 per year.<strong>Colorado</strong> Department of Local Affairs, Division of <strong>Hous<strong>in</strong>g</strong> 2
In general, there is at least one affordable unit for every household earn<strong>in</strong>g $35,000 ormore <strong>in</strong> <strong>Colorado</strong>.In other words, households that earn more than 60 percent of the area median <strong>in</strong>come willgenerally be able to f<strong>in</strong>d a rental unit that is affordable to that household. However, forhouseholds earn<strong>in</strong>g 45 percent of area median <strong>in</strong>come or less, rental hous<strong>in</strong>g is muchmore difficult to f<strong>in</strong>d. For households earn<strong>in</strong>g <strong>in</strong>comes below 30 percent of area median<strong>in</strong>come, there are generally two households for every affordable unit. In all regions of thestate, as <strong>in</strong>comes go down, the number of available affordable un<strong>its</strong> falls.F<strong>in</strong>d<strong>in</strong>gs varied from region to region. In the metro Denver area, there were 2.5households for every unit affordable to households mak<strong>in</strong>g less than $20,000 per year. InGreeley <strong>and</strong> Pueblo, there were 1.6 <strong>and</strong> 1.5 households for every unit affordable tohouseholds earn<strong>in</strong>g less than $20,000 per year, respectively.In the Gr<strong>and</strong> Junction metro area there were 1.3 households for every unit affordable tohouseholds mak<strong>in</strong>g less than $10,000, although there were 1.6 households for everyaffordable unit for households earn<strong>in</strong>g $20,000 or less.The area show<strong>in</strong>g the largest mismatch was the Boulder area. In the Boulder area, therewere 3.5 households for every unit affordable to households mak<strong>in</strong>g $20,000 or less.Methods<strong>Rent</strong> burden <strong>in</strong>formation is based on tables show<strong>in</strong>g “gross rent as a percentage ofhousehold <strong>in</strong>come <strong>in</strong> the past 12 months” <strong>in</strong> the American Community Survey. Totalun<strong>its</strong> are then calculated as a percentage of all renter households.The rent burden data (Tables 1-7) reflects only residents with<strong>in</strong> each listed county <strong>and</strong>does not reflect the <strong>in</strong>comes or rents of workers who commute to the counties listed.<strong>Rent</strong> burden <strong>in</strong>formation by <strong>in</strong>come level (Tables 4-7) is based on tables show<strong>in</strong>g“household <strong>in</strong>come by gross rent as a percentage of household <strong>in</strong>come” <strong>in</strong> the AmericanCommunity Survey.The mismatch tables are based on household <strong>in</strong>come data <strong>and</strong> rent level data provided bythe 2006-2010 five-year estimates of the American Community Survey (ACS) conductedby the U.S. Census Bureau. <strong>Hous<strong>in</strong>g</strong> unit totals <strong>and</strong> rents are drawn from both subsidized<strong>and</strong> market-rate un<strong>its</strong>. Unit supply at specific rent levels is then compared to householdtotals at specific <strong>in</strong>come levels. The data, which is the most recent data available forgross rent, reflects the economic <strong>and</strong> demographic conditions found <strong>in</strong> <strong>Colorado</strong> dur<strong>in</strong>g2010.“Affordability” assumes rent equal to less than 30 percent of the household’s <strong>in</strong>come.However, <strong>in</strong>comes analyzed are gross <strong>in</strong>comes <strong>and</strong> not based on monthly take-home payor after-tax pay. The mismatch does not reflect the impact of payroll taxes or <strong>in</strong>come<strong>Colorado</strong> Department of Local Affairs, Division of <strong>Hous<strong>in</strong>g</strong> 3
taxes, <strong>and</strong> therefore overestimates what some households have available to pay towardhous<strong>in</strong>g.The total number of available un<strong>its</strong> <strong>in</strong>cludes un<strong>its</strong> that are classified as “no cash rent.”These are un<strong>its</strong> that are provided <strong>in</strong> exchange for services, such as <strong>in</strong> the case of on-siteproperty managers. “No cash rent” also <strong>in</strong>cludes renters who live <strong>in</strong> un<strong>its</strong> rent-freebecause the un<strong>its</strong> are owned by friends or relatives who provide the un<strong>its</strong> <strong>in</strong> exchange forconsideration other than cash. Also <strong>in</strong>cluded is base hous<strong>in</strong>g (not <strong>in</strong>clud<strong>in</strong>g barracks <strong>and</strong>group hous<strong>in</strong>g) at military <strong>in</strong>stallations. “No cash rent” un<strong>its</strong> are <strong>in</strong>cluded at the lowestrent level, so it is assumed that households with little to no <strong>in</strong>come can afford these un<strong>its</strong>.The areas selected for regional mismatch analysis are dictated by the availability of datathrough the American Community Survey. Smaller regions have not been <strong>in</strong>cluded at thistime due to large marg<strong>in</strong>s of error with<strong>in</strong> the ACS data for small regions.All data <strong>in</strong> this report is based on rental un<strong>its</strong>, renter households <strong>and</strong> renter household<strong>in</strong>come. “RMI” describes renter median <strong>in</strong>come. “AMI” describes area median <strong>in</strong>comewhich reflects both renter <strong>and</strong> homeowner <strong>in</strong>comes.The unit totals also assume a five-percent vacancy rate, <strong>and</strong> that five percent more un<strong>its</strong>are available than were counted by the American Community Survey.Note: <strong>Rent</strong> burden totals should not be confused with mismatch totals. The mismatchprovides <strong>in</strong>formation on how many un<strong>its</strong> are available to renters seek<strong>in</strong>g to avoid a rentburden. The rent-burden totals provide <strong>in</strong>formation on how many renter households areactually rent burdened for any reason. For a variety of reasons, renters may choose to berent burdened if un<strong>its</strong> or unit locations are deemed unsafe or undesirable for some reason.Households with higher <strong>in</strong>comes have more flexibility <strong>in</strong> cop<strong>in</strong>g with rent burden than dolower-<strong>in</strong>come households.If a rent burden total is higher than the mismatch total, this suggests that households arerent burdened for reasons <strong>in</strong> addition to a physical lack of un<strong>its</strong> <strong>and</strong> that available un<strong>its</strong>are considered by renters to be undesirable <strong>in</strong> some way: The reasons for this can <strong>in</strong>cludesafety, size of unit, sanitary conditions of the unit, proximity to workplace, proximity topublic transportation, or aesthetic considerations.<strong>Colorado</strong> Department of Local Affairs, Division of <strong>Hous<strong>in</strong>g</strong> 4
<strong>Rent</strong> <strong>Burden</strong>s <strong>in</strong> <strong>Colorado</strong>Table 1: Households pay<strong>in</strong>g 50% or more of <strong>in</strong>come toward hous<strong>in</strong>gTotal number ofhouseholds pay<strong>in</strong>g50% or more of <strong>in</strong>cometoward hous<strong>in</strong>g.Percentage ofhouseholds pay<strong>in</strong>g 50%or more of <strong>in</strong>come towardhous<strong>in</strong>gMetro AreaBoulder 13,080 30.8%<strong>Colorado</strong> Spr<strong>in</strong>gs 17,296 22.4%Denver-Aurora-Broomfield 77,709 23.6%Fort Coll<strong>in</strong>s-Lovel<strong>and</strong> 11,530 30.1%Gr<strong>and</strong> Junction 3,243 20.5%Greeley 5,752 23.4%Pueblo 5,452 29.4%<strong>Colorado</strong> 150,142 24.1%Table 2: Households pay<strong>in</strong>g 35% or more of <strong>in</strong>come toward hous<strong>in</strong>gTotal number ofhouseholds pay<strong>in</strong>g35% or more of <strong>in</strong>cometoward hous<strong>in</strong>gPercentage of householdspay<strong>in</strong>g 35% or more of<strong>in</strong>come toward hous<strong>in</strong>gMetro AreaBoulder 19,857 46.7%<strong>Colorado</strong> Spr<strong>in</strong>gs 29,004 37.6%Denver-Aurora-Broomfield 128,796 39.2%Fort Coll<strong>in</strong>s-Lovel<strong>and</strong> 17,021 44.5%Gr<strong>and</strong> Junction 5,744 36.3%Greeley 9,622 39.1%Pueblo 8,303 44.8%<strong>Colorado</strong> 243,687 39.1%Table 3: Households pay<strong>in</strong>g 30% or more of <strong>in</strong>come toward hous<strong>in</strong>gTotal number of renterhouseholds pay<strong>in</strong>g 30%or more of <strong>in</strong>cometoward hous<strong>in</strong>gPercentage of renterhouseholds pay<strong>in</strong>g 30%or more of <strong>in</strong>come towardhous<strong>in</strong>gMetro AreaBoulder 23,714 55.8%<strong>Colorado</strong> Spr<strong>in</strong>gs 35,872 46.6%Denver-Aurora-Broomfield 158,067 48.1%Fort Coll<strong>in</strong>s-Lovel<strong>and</strong> 20,588 53.9%Gr<strong>and</strong> Junction 6,848 43.3%Greeley 11,794 48.0%Pueblo 9,785 52.8%<strong>Colorado</strong> 298,412 47.9%<strong>Colorado</strong> Department of Local Affairs, Division of <strong>Hous<strong>in</strong>g</strong> 5
<strong>Rent</strong> <strong>Burden</strong> by Income LevelTable 4: Households pay<strong>in</strong>g 30% or more of <strong>in</strong>come toward hous<strong>in</strong>g, by region, by <strong>in</strong>come level.<strong>Rent</strong> burdened households (pay<strong>in</strong>g 30% or more of <strong>in</strong>come toward hous<strong>in</strong>g) at <strong>in</strong>come level:Metro AreaLess than$10,000$10,000-$19,999$20,000-$34,999$35,000-$49,999$50,000-$74,999$75,000 ormoreBoulder 5,074 5,888 7,592 3,302 1,427 431<strong>Colorado</strong> Spr<strong>in</strong>gs 6,813 11,753 11,841 4,221 1,055 189Denver-Aurora-Broomfield 29,022 46,930 54,016 19,320 7,554 1,225Fort Coll<strong>in</strong>s-Lovel<strong>and</strong> 4,704 6,211 6,574 2,472 575 52Gr<strong>and</strong> Junction 1,530 2,270 2,157 676 168 47Greeley 2,569 4,125 3,378 1,184 483 55Pueblo 3,217 3,751 2,230 437 139 11<strong>Colorado</strong> 60,165 90,430 96,568 35,453 13,148 2,648Table 5: Percentage of all households that are rent burdened at each <strong>in</strong>come level.Percent of households that are at 30% rent burden at each <strong>in</strong>come level:Metro AreaLess than$10,000$10,000-$19,999$20,000-$34,999$35,000-$49,999$50,000-$74,999$75,000 ormoreBoulder 80.2% 90.7% 83.2% 48.6% 20.7% 6.3%<strong>Colorado</strong> Spr<strong>in</strong>gs 76.7% 91.8% 63.5% 30.1% 8.0% 2.0%Denver-Aurora-Broomfield 67.4% 88.0% 71.4% 34.4% 13.8% 2.7%Fort Coll<strong>in</strong>s-Lovel<strong>and</strong> 82.1% 87.4% 73.0% 35.5% 10.9% 1.3%Gr<strong>and</strong> Junction 70.7% 81.0% 59.6% 28.4% 6.4% 2.1%Greeley 68.5% 79.2% 61.8% 28.5% 14.7% 2.0%Pueblo 75.8% 79.5% 53.9% 19.0% 6.7% 1.1%<strong>Colorado</strong> 71.0% 85.7% 67.6% 33.5% 13.0% 3.2%<strong>Colorado</strong> Department of Local Affairs, Division of <strong>Hous<strong>in</strong>g</strong> 6
<strong>Rent</strong> <strong>Burden</strong> by Income LevelTable 6: Households pay<strong>in</strong>g 35% or more of <strong>in</strong>come toward hous<strong>in</strong>g, by region, by <strong>in</strong>come level.<strong>Rent</strong> burdened households (pay<strong>in</strong>g 35% or more of <strong>in</strong>come towardMetro Areahous<strong>in</strong>g) at <strong>in</strong>come level:Lessthan$10,000$10,000-$19,999$20,000-$34,999$35,000-$49,999$50,000-$74,999$75,000or moreBoulder 4,992 5,706 6,317 1,901 776 165<strong>Colorado</strong> Spr<strong>in</strong>gs 6,646 10,615 8,801 2,432 394 116Denver-Aurora-Broomfield 27,816 44,826 41,098 10,988 3,553 515Fort Coll<strong>in</strong>s-Lovel<strong>and</strong> 4,638 5,956 4,903 1,311 170 43Gr<strong>and</strong> Junction 1,460 2,113 1,657 418 72 24Greeley 2,459 3,792 2,508 631 185 47Pueblo 3,042 3,366 1,561 290 44 0<strong>Colorado</strong> 57,917 85,023 73,263 20,199 5,974 1,311Table 7: Percentage of all households that are rent burdened at each <strong>in</strong>come level.Metro AreaPercent of households at 35% rent-burden level at each <strong>in</strong>come level:Lessthan $10,000- $20,000- $35,000- $50,000- $75,000$10,000 $19,999 $34,999 $49,999 $74,999 or moreBoulder 78.9% 87.9% 69.2% 28.0% 11.3% 2.4%<strong>Colorado</strong> Spr<strong>in</strong>gs 74.8% 82.9% 47.2% 17.4% 3.0% 1.2%Denver-Aurora-Broomfield 64.6% 84.0% 54.3% 19.6% 6.5% 1.1%Fort Coll<strong>in</strong>s-Lovel<strong>and</strong> 81.0% 83.8% 54.5% 18.8% 3.2% 1.0%Gr<strong>and</strong> Junction 67.5% 75.4% 45.8% 17.6% 2.7% 1.1%Greeley 65.6% 72.8% 45.9% 15.2% 5.6% 1.7%Pueblo 71.7% 71.4% 37.8% 12.6% 2.1% 0.0%<strong>Colorado</strong> 68.4% 80.6% 51.3% 19.1% 5.9% 1.6%<strong>Colorado</strong> Department of Local Affairs, Division of <strong>Hous<strong>in</strong>g</strong> 7
Mismatch TablesTable 8: Availability of <strong>Rent</strong>al <strong>Hous<strong>in</strong>g</strong>, State of <strong>Colorado</strong>Income levelMaximummonthly rentaffordable to ahouseholdliv<strong>in</strong>g below<strong>in</strong>come level<strong>Rent</strong>al Un<strong>its</strong>available atrent level orbelow<strong>Rent</strong>erHouseholdsliv<strong>in</strong>g belowthe <strong>in</strong>comelevelNumber ofrenterhouseholdsper affordablerental unitNo. of un<strong>its</strong>available per100 renterhouseholdsIncome levelas % of arearenter median<strong>in</strong>come:$32,321Income levelas % of overallarea median<strong>in</strong>come:$56,456$10,000 $250 46,694 84,734 1.8 55 31% 18%$15,000 $375 63,201 140,232 2.2 45 46% 27%$20,000 $499 95,571 190,215 2.0 50 62% 35%$25,000 $624 169,094 241,507 1.4 70 77% 44%$35,000 $875 356,544 333,145 0.9 107 108% 62%$50,000 $1,250 535,989 438,916 0.8 122 155% 89%$75,000 $1,875 634,510 539,768 0.9 118 232% 133%$150,000 $3,750 653,401 622,289 1.0 105 464% 266%<strong>Colorado</strong> Department of Local Affairs, Division of <strong>Hous<strong>in</strong>g</strong> 8
Table 9: Availability of <strong>Rent</strong>al <strong>Hous<strong>in</strong>g</strong>, Boulder <strong>Metropolitan</strong> Statistical AreaIncome levelMaximummonthly rentaffordable toa householdliv<strong>in</strong>g below<strong>in</strong>come level<strong>Rent</strong>al Un<strong>its</strong>available atrent level orbelow<strong>Rent</strong>erHouseholdsliv<strong>in</strong>g belowthe <strong>in</strong>comelevelNumber ofrenterhouseholdsperaffordablerental unitNo. of un<strong>its</strong>available per100 renterhouseholdsIncome levelas % of arearentermedian<strong>in</strong>come:$33,739Income levelas % ofoverall areamedian<strong>in</strong>come:$64,839$10,000 $250 2,135 6,328 3.0 34 30% 15%$15,000 $375 2,769 9,657 3.5 29 44% 23%$20,000 $499 3,693 12,819 3.5 29 59% 31%$25,000 $624 5,975 15,897 2.7 38 74% 39%$35,000 $875 17,047 21,947 1.3 78 104% 54%$50,000 $1,250 31,659 28,738 0.9 110 148% 77%$75,000 $1,875 41,586 35,631 0.9 117 222% 116%$100,000 $2,499 44,269 38,685 0.9 114 296% 154%<strong>Colorado</strong> Department of Local Affairs, Division of <strong>Hous<strong>in</strong>g</strong> 9
Table 10: Availability of <strong>Rent</strong>al <strong>Hous<strong>in</strong>g</strong>, <strong>Colorado</strong> Spr<strong>in</strong>gs <strong>Metropolitan</strong> Statistical AreaIncome levelMaximummonthly rentaffordable to ahouseholdliv<strong>in</strong>g below<strong>in</strong>come level<strong>Rent</strong>al Un<strong>its</strong>available atrent level orbelow<strong>Rent</strong>erHouseholdsliv<strong>in</strong>g belowthe <strong>in</strong>comelevelNumber ofrenterhouseholdsper affordablerental unitNo. of un<strong>its</strong>available per100 renterhouseholdsIncome levelas % of arearenter median<strong>in</strong>come:$33,178Income levelas % ofoverall areamedian<strong>in</strong>come:$56,358$10,000 $250 3,992 8,886 2.2 45 30% 18%$15,000 $375 5,571 15,201 2.7 37 45% 27%$20,000 $499 11,828 21,687 1.8 55 60% 35%$25,000 $624 22,980 28,690 1.2 80 75% 44%$35,000 $875 46,397 40,320 0.9 115 105% 62%$50,000 $1,250 68,451 54,330 0.8 126 151% 89%$75,000 $1,875 79,378 67,525 0.9 118 226% 133%$100,000 $2,499 80,812 72,631 0.9 111 301% 177%<strong>Colorado</strong> Department of Local Affairs, Division of <strong>Hous<strong>in</strong>g</strong> 10
Table 11: Availability of <strong>Rent</strong>al <strong>Hous<strong>in</strong>g</strong>, Denver-Aurora-Broomfield <strong>Metropolitan</strong> Statistical AreaIncome levelMaximummonthly rentaffordable toa householdliv<strong>in</strong>g below<strong>in</strong>come level<strong>Rent</strong>al Un<strong>its</strong>available atrent level orbelow<strong>Rent</strong>erHouseholdsliv<strong>in</strong>g belowthe <strong>in</strong>comelevelNumber ofrenterhouseholdsper affordablerental unitNo. of un<strong>its</strong>available per100 renterhouseholdsIncome levelas % of arearenter median<strong>in</strong>come:$33,120Income levelas % ofoverall areamedian<strong>in</strong>come:$60,137$10,000 $250 18,740 43,090 2.3 43 30% 17%$15,000 $375 25,538 70,997 2.8 36 45% 25%$20,000 $499 38,037 96,430 2.5 39 60% 33%$25,000 $624 74,442 123,458 1.7 60 75% 42%$35,000 $875 178,179 172,118 1.0 104 106% 58%$50,000 $1,250 279,902 228,281 0.8 123 151% 83%$75,000 $1,875 335,146 283,192 0.8 118 226% 125%$100,000 $2,499 344,789 307,467 0.9 112 302% 166%<strong>Colorado</strong> Department of Local Affairs, Division of <strong>Hous<strong>in</strong>g</strong> 11
Table 12: Availability of <strong>Rent</strong>al <strong>Hous<strong>in</strong>g</strong>, Fort-Coll<strong>in</strong>s-Lovel<strong>and</strong> <strong>Metropolitan</strong> Statistical AreaIncome levelMaximummonthly rentaffordable to ahouseholdliv<strong>in</strong>g below<strong>in</strong>come level<strong>Rent</strong>al Un<strong>its</strong>available atrent level orbelow<strong>Rent</strong>erHouseholdsliv<strong>in</strong>g belowthe <strong>in</strong>comelevelNumber ofrenterhouseholdsper affordablerental unitNo. of un<strong>its</strong>available per100 renterhouseholdsIncome levelas % of arearenter median<strong>in</strong>come:$30,291Income levelas % ofoverall areamedian<strong>in</strong>come:$56,447$10,000 $250 2,539 5,729 2.3 44 33% 18%$15,000 $375 3,350 8,909 2.7 38 50% 27%$20,000 $499 4,851 12,353 2.5 39 66% 35%$25,000 $624 9,131 15,569 1.7 59 83% 44%$35,000 $875 22,068 21,356 1.0 103 116% 62%$50,000 $1,250 32,828 28,329 0.9 116 165% 89%$75,000 $1,875 39,316 33,583 0.9 117 248% 133%$100,000 $2,499 40,011 35,834 0.9 112 330% 177%<strong>Colorado</strong> Department of Local Affairs, Division of <strong>Hous<strong>in</strong>g</strong> 12
Table 13: Availability of <strong>Rent</strong>al <strong>Hous<strong>in</strong>g</strong>, Gr<strong>and</strong> Junction <strong>Metropolitan</strong> Statistical AreaIncome levelMaximummonthly rentaffordable toa householdliv<strong>in</strong>g below<strong>in</strong>come level<strong>Rent</strong>al Un<strong>its</strong>available atrent level orbelow<strong>Rent</strong>erHouseholdsliv<strong>in</strong>g belowthe <strong>in</strong>comelevelNumber ofrenterhouseholdsperaffordablerental unitNo. of un<strong>its</strong>available per100 renterhouseholdsIncome levelas % of arearentermedian<strong>in</strong>come:$31,781Income levelas % ofoverall areamedian<strong>in</strong>come:$52,067$10,000 $250 1,661 2,164 1.3 77 31% 19%$15,000 $375 2,323 3,879 1.7 60 47% 29%$20,000 $499 3,025 4,965 1.6 61 63% 38%$25,000 $624 5,275 6,385 1.2 83 79% 48%$35,000 $875 9,897 8,585 0.9 115 110% 67%$50,000 $1,250 14,499 10,965 0.8 132 157% 96%$75,000 $1,875 16,250 13,589 0.8 120 236% 144%$100,000 $2,499 16,593 14,975 0.9 111 315% 192%<strong>Colorado</strong> Department of Local Affairs, Division of <strong>Hous<strong>in</strong>g</strong> 13
Table 14: Availability of <strong>Rent</strong>al <strong>Hous<strong>in</strong>g</strong>, Greeley <strong>Metropolitan</strong> Statistical AreaIncome levelMaximummonthly rentaffordable toa householdliv<strong>in</strong>g below<strong>in</strong>come level<strong>Rent</strong>al Un<strong>its</strong>available atrent level orbelow<strong>Rent</strong>erHouseholdsliv<strong>in</strong>g belowthe <strong>in</strong>comelevelNumber ofrenterhouseholdsperaffordablerental unitNo. of un<strong>its</strong>available per100 renterhouseholdsIncome levelas % of arearentermedian<strong>in</strong>come:28,471Income levelas % ofoverall areamedian<strong>in</strong>come:55,596$10,000 $250 2,906 3,750 1.3 78 35% 18%$15,000 $375 3,772 6,665 1.8 57 53% 27%$20,000 $499 5,772 8,957 1.6 64 70% 36%$25,000 $624 9,529 10,759 1.1 89 88% 45%$35,000 $875 15,013 14,422 1.0 104 123% 63%$50,000 $1,250 21,121 18,572 0.9 114 176% 90%$75,000 $1,875 23,878 21,851 0.9 109 263% 135%$100,000 $2,499 24,471 22,875 0.9 107 351% 180%<strong>Colorado</strong> Department of Local Affairs, Division of <strong>Hous<strong>in</strong>g</strong> 14
Table 15: Availability of <strong>Rent</strong>al <strong>Hous<strong>in</strong>g</strong>, Pueblo <strong>Metropolitan</strong> Statistical AreaIncome levelMaximummonthly rentaffordable toa householdliv<strong>in</strong>g below<strong>in</strong>come level<strong>Rent</strong>al Un<strong>its</strong>available atrent level orbelow<strong>Rent</strong>erHouseholdsliv<strong>in</strong>g belowthe <strong>in</strong>comelevelNumber ofrenterhouseholdsperaffordablerental unitNo. of un<strong>its</strong>available per100 renterhouseholdsIncome levelas % of arearentermedian<strong>in</strong>come:20,844Income levelas % ofoverall areamedian<strong>in</strong>come:40,699$10,000 $250 2,410 4,242 1.8 57 48% 25%$15,000 $375 3,678 6,777 1.8 54 72% 37%$20,000 $499 6,007 8,959 1.5 67 96% 49%$25,000 $624 9,485 10,471 1.1 91 120% 61%$35,000 $875 15,147 13,094 0.9 116 168% 86%$50,000 $1,250 18,353 15,398 0.8 119 240% 123%$75,000 $1,875 19,352 17,459 0.9 111 360% 184%$100,000 $2,499 19,428 18,079 0.9 107 480% 246%<strong>Colorado</strong> Department of Local Affairs, Division of <strong>Hous<strong>in</strong>g</strong> 15


