The Topology of Magnetic Reconnection in Solar Flares
The Topology of Magnetic Reconnection in Solar Flares
The Topology of Magnetic Reconnection in Solar Flares

You also want an ePaper? Increase the reach of your titles
YUMPU automatically turns print PDFs into web optimized ePapers that Google loves.
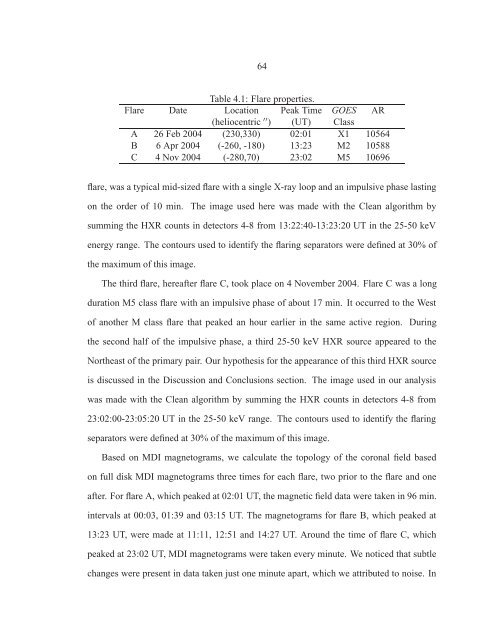
64Table 4.1: Flare properties.Flare Date Location Peak Time GOES AR(heliocentric ′′ ) (UT) ClassA 26 Feb 2004 (230,330) 02:01 X1 10564B 6 Apr 2004 (-260, -180) 13:23 M2 10588C 4 Nov 2004 (-280,70) 23:02 M5 10696flare, was a typical mid-sized flare with a s<strong>in</strong>gle X-ray loop and an impulsive phase last<strong>in</strong>gon the order <strong>of</strong> 10 m<strong>in</strong>. <strong>The</strong> image used here was made with the Clean algorithm bysumm<strong>in</strong>g the HXR counts <strong>in</strong> detectors 4-8 from 13:22:40-13:23:20 UT <strong>in</strong> the 25-50 keVenergy range. <strong>The</strong> contours used to identify the flar<strong>in</strong>g separators were def<strong>in</strong>ed at 30% <strong>of</strong>the maximum <strong>of</strong> this image.<strong>The</strong> third flare, hereafter flare C, took place on 4 November 2004. Flare C was a longduration M5 class flare with an impulsive phase <strong>of</strong> about 17 m<strong>in</strong>. It occurred to the West<strong>of</strong> another M class flare that peaked an hour earlier <strong>in</strong> the same active region. Dur<strong>in</strong>gthe second half <strong>of</strong> the impulsive phase, a third 25-50 keV HXR source appeared to theNortheast <strong>of</strong> the primary pair. Our hypothesis for the appearance <strong>of</strong> this third HXR sourceis discussed <strong>in</strong> the Discussion and Conclusions section. <strong>The</strong> image used <strong>in</strong> our analysiswas made with the Clean algorithm by summ<strong>in</strong>g the HXR counts <strong>in</strong> detectors 4-8 from23:02:00-23:05:20 UT <strong>in</strong> the 25-50 keV range. <strong>The</strong> contours used to identify the flar<strong>in</strong>gseparators were def<strong>in</strong>ed at 30% <strong>of</strong> the maximum <strong>of</strong> this image.Based on MDI magnetograms, we calculate the topology <strong>of</strong> the coronal field basedon full disk MDI magnetograms three times for each flare, two prior to the flare and oneafter. For flare A, which peaked at 02:01 UT, the magnetic field data were taken <strong>in</strong> 96 m<strong>in</strong>.<strong>in</strong>tervals at 00:03, 01:39 and 03:15 UT. <strong>The</strong> magnetograms for flare B, which peaked at13:23 UT, were made at 11:11, 12:51 and 14:27 UT. Around the time <strong>of</strong> flare C, whichpeaked at 23:02 UT, MDI magnetograms were taken every m<strong>in</strong>ute. We noticed that subtlechanges were present <strong>in</strong> data taken just one m<strong>in</strong>ute apart, which we attributed to noise. In