- 96 -2012Mobile WirelineCommunications CommunicationsServices Services Others ConsolidatedSegment revenues (Brought Forward) P=69,878,711 P=16,483,001 P=84,437 P=86,446,149EBITDA 32,445,341 2,737,792 (172,323) 35,010,810Depreciation and amortization (13,220,052) (10,350,911) (12,454) (23,583,417)EBIT 19,225,289 (7,613,119) (184,777) 11,427,393Net Income (Loss) Before Income Tax 2 17,687,147 (7,732,316) (186,487) 9,768,344Benefit from (provision for) income tax 2 (3,554,197) 693,237 (50,372) (2,911,332)Net Income (Loss) P=14,132,950 (P=7,039,079) (P=236,859) P=6,857,012Other Segment InformationIntersegment revenues (P=77,679) (P=206,911) (P=207,454) (P=492,044)Subsidy 1 (4,033,824) 62,117 (3,068) (3,974,775)Interest income 2 448,300 67,081 181 515,562Interest expense (2,002,475) (83,447) (156) (2,086,078)Equity in net losses of joint ventures (83,582) – – (83,582)Impairment losses and others (1,186,031) (677,553) – (1,863,584)Capital expenditure (23,165,833) (3,615,609) (28,118) (26,809,560)Cash FlowsNet cash provided by (used in):Operating activities P=17,901,778 P=6,259,215 P=76,262 P=24,237,255Investing activities (24,243,478) (344,365) (45,284) (24,633,127)Financing activities 2,197,903 – – 2,197,9031Computed as non-service revenues less cost of sales2 Net of final taxes2011Mobile WirelineCommunications CommunicationsServices Services Others ConsolidatedRevenuesService revenues:External customers:Voice P=35,290,101 P=2,938,717 P=– P=38,228,818Data 28,139,234 3,791,928 108,481 32,039,643Broadband – 7,496,503 – 7,496,503Nonservice revenues:External customers 3,028,245 725,038 – 3,753,283Segment revenues 66,457,580 14,952,186 108,481 81,518,247EBITDA 32,145,366 3,056,714 (87,007) 35,115,073Depreciation and amortization (11,402,577) (7,527,599) (11,051) (18,941,227)EBIT 20,742,789 (4,470,885) (98,058) 16,173,846Net Income (Loss) Before Income Tax 2 18,634,742 (4,478,893) (96,410) 14,059,439Benefit from (provision for) income tax 2 (4,190,298) (34,101) (3,235) (4,227,634)Net Income (Loss) P=14,444,444 (P=4,512,994) (P=99,645) P=9,831,805Other Segment InformationIntersegment revenues P=34,747 (P=264,929) (P=246,673) (P=476,855)Subsidy 1 (2,091,403) (42,060) (843) (2,134,306)Interest income 2 172,156 87,532 70 259,758Interest expense (1,994,371) (65,289) (2,059,660)Equity in net losses of joint ventures (27,345) – – (27,345)Impairment losses and others (1,068,597) (849,986) – (1,918,583)Capital expenditure (13,530,030) (3,777,427) (109,925) (17,417,382)Cash FlowsNet cash provided by (used in):Operating activities 23,605,233 6,114,936 206,006 29,926,175Investing activities (13,734,642) (4,345,211) (109,864) (18,189,717)Financing activities (12,520,892) – – (12,520,892)1Computed as non-service revenues less cost of sales2 Net of final taxes*SGVFS000196*
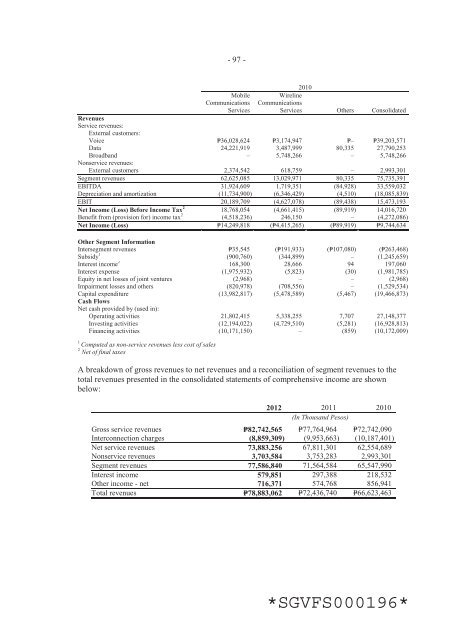
- 97 -2010MobileCommunicationsServicesWirelineCommunicationsServices Others ConsolidatedRevenuesService revenues:External customers:Voice P=36,028,624 P=3,174,947 P=– P=39,203,571Data 24,221,919 3,487,999 80,335 27,790,253Broadband – 5,748,266 – 5,748,266Nonservice revenues:External customers 2,374,542 618,759 – 2,993,301Segment revenues 62,625,085 13,029,971 80,335 75,735,391EBITDA 31,924,609 1,719,351 (84,928) 33,559,032Depreciation and amortization (11,734,900) (6,346,429) (4,510) (18,085,839)EBIT 20,189,709 (4,627,078) (89,438) 15,473,193Net Income (Loss) Before Income Tax 2 18,768,054 (4,661,415) (89,919) 14,016,720Benefit from (provision for) income tax 2 (4,518,236) 246,150 – (4,272,086)Net Income (Loss) P=14,249,818 (P=4,415,265) (P=89,919) P=9,744,634Other Segment InformationIntersegment revenues P=35,545 (P=191,933) (P=107,080) (P=263,468)Subsidy 1 (900,760) (344,899) – (1,245,659)Interest income 2 168,300 28,666 94 197,060Interest expense (1,975,932) (5,823) (30) (1,981,785)Equity in net losses of joint ventures (2,968) – – (2,968)Impairment losses and others (820,978) (708,556) – (1,529,534)Capital expenditure (13,982,817) (5,478,589) (5,467) (19,466,873)Cash FlowsNet cash provided by (used in):Operating activities 21,802,415 5,338,255 7,707 27,148,377Investing activities (12,194,022) (4,729,510) (5,281) (16,928,813)Financing activities (10,171,150) – (859) (10,172,009)1Computed as non-service revenues less cost of sales2 Net of final taxesA breakdown of gross revenues to net revenues and a reconciliation of segment revenues to thetotal revenues presented in the consolidated statements of comprehensive income are shownbelow:2012 2011 2010(In Thousand Pesos)Gross service revenues P=82,742,565 P=77,764,964 P=72,742,090Interconnection charges (8,859,309) (9,953,663) (10,187,401)Net service revenues 73,883,256 67,811,301 62,554,689Nonservice revenues 3,703,584 3,753,283 2,993,301Segment revenues 77,586,840 71,564,584 65,547,990Interest income 579,851 297,388 218,532Other income - net 716,371 574,768 856,941Total revenues P=78,883,062 P=72,436,740 P=66,623,463*SGVFS000196*
- Page 1 and 2:
GLOBE TELECOM, INC.5 th Floor, Glob
- Page 3:
Neither the delivery of this Prospe
- Page 8 and 9:
Definition of Termscorporation duly
- Page 10 and 11:
Definition of Terms“SEC Permit”
- Page 12 and 13:
Executive Summary G-Xchange, Inc. (
- Page 14 and 15:
Executive SummaryThe Company has a
- Page 16 and 17:
Executive SummaryOther fixed line d
- Page 18 and 19:
Executive SummaryOther Developments
- Page 20 and 21:
SUMMARY OF THE OFFERINGIssuer... ..
- Page 22 and 23:
Summary of the OfferingStatus of th
- Page 24 and 25:
Risk Factors and Other Consideratio
- Page 26 and 27:
Risk Factors and Other Consideratio
- Page 28 and 29:
Risk Factors and Other Consideratio
- Page 30 and 31:
Risk Factors and Other Consideratio
- Page 32 and 33:
PHILIPPINE TAXATIONThe following is
- Page 34 and 35:
Philippine TaxationVALUE-ADDED TAXG
- Page 36 and 37:
USE OF PROCEEDSFollowing the offer
- Page 38 and 39:
Determination of Offer PriceDETERMI
- Page 40 and 41:
Plan of Distribution(BPI). Globe an
- Page 42 and 43:
Plan of DistributionPAYMENTSThe Pay
- Page 44 and 45:
Description of the Bondsinspection
- Page 46 and 47:
Description of the BondsBusiness Da
- Page 48 and 49:
Description of the Bondsi. Any gove
- Page 50 and 51:
Description of the Bondscomputing t
- Page 52 and 53:
Description of the Bondscompensatio
- Page 54 and 55:
Description of the Bonds will adver
- Page 56 and 57:
Description of the Bondsthe payment
- Page 58 and 59:
Description of the Bondsthe Trust I
- Page 60 and 61:
Description of the Bondspayment of
- Page 62 and 63:
Description of the Bondsregard to p
- Page 64 and 65:
INDEPENDENT AUDITOR AND COUNSELLEGA
- Page 66 and 67:
DESCRIPTION OF BUSINESSOverviewGlob
- Page 68 and 69:
Description of BusinessBusiness Seg
- Page 70 and 71:
Description of BusinessBrowsing rat
- Page 72 and 73:
Description of BusinessFinancial St
- Page 74 and 75:
Description of BusinessGlobe Stores
- Page 76 and 77:
Description of BusinessRecent Promo
- Page 78 and 79:
Description of BusinessData and Bro
- Page 80 and 81:
Description of BusinessToll-FreeSer
- Page 82 and 83:
Description of BusinessManagedInter
- Page 84 and 85:
Description of BusinessTen operator
- Page 86 and 87:
Description of Businessmobile and f
- Page 88 and 89:
Description of Business(In Thousand
- Page 90 and 91:
Description of BusinessTransactions
- Page 92 and 93:
Description of BusinessPixlink, Unl
- Page 94 and 95:
Description of BusinessOn June 29,
- Page 96 and 97:
Buildings and Leasehold Improvement
- Page 98 and 99:
Description of Propertiessystems in
- Page 100 and 101:
Certain Legal Proceedingstheir lawy
- Page 102 and 103:
Certain Legal ProceedingsNTC from h
- Page 104 and 105:
Market Price and Dividends on Globe
- Page 106 and 107:
Market Price and Dividends on Globe
- Page 108 and 109:
Market Price and Dividends on Globe
- Page 110 and 111:
Market Price and Dividends on Globe
- Page 112 and 113:
Management’s Discussion and Analy
- Page 114 and 115:
Management’s Discussion and Analy
- Page 116 and 117:
Management’s Discussion and Analy
- Page 118 and 119:
Management’s Discussion and Analy
- Page 120 and 121:
Management’s Discussion and Analy
- Page 122 and 123:
Management’s Discussion and Analy
- Page 124 and 125:
Management’s Discussion and Analy
- Page 126 and 127:
Management’s Discussion and Analy
- Page 128 and 129:
Management’s Discussion and Analy
- Page 130 and 131:
Management’s Discussion and Analy
- Page 132 and 133:
Management’s Discussion and Analy
- Page 134 and 135:
Management’s Discussion and Analy
- Page 136 and 137:
Management’s Discussion and Analy
- Page 138 and 139:
Management’s Discussion and Analy
- Page 140 and 141:
Management’s Discussion and Analy
- Page 142 and 143:
Management’s Discussion and Analy
- Page 144 and 145:
Management’s Discussion and Analy
- Page 146 and 147:
Management’s Discussion and Analy
- Page 148 and 149:
Management’s Discussion and Analy
- Page 150 and 151:
Management’s Discussion and Analy
- Page 152 and 153:
Management’s Discussion and Analy
- Page 154 and 155:
Management’s Discussion and Analy
- Page 156 and 157:
Management’s Discussion and Analy
- Page 158 and 159:
Management’s Discussion and Analy
- Page 160 and 161:
Management’s Discussion and Analy
- Page 162 and 163:
Management’s Discussion and Analy
- Page 164 and 165:
Management’s Discussion and Analy
- Page 166 and 167:
Management’s Discussion and Analy
- Page 168 and 169:
Management’s Discussion and Analy
- Page 170 and 171:
Management’s Discussion and Analy
- Page 172 and 173:
Management’s Discussion and Analy
- Page 174 and 175:
Management’s Discussion and Analy
- Page 176 and 177:
Management’s Discussion and Analy
- Page 178 and 179:
Management’s Discussion and Analy
- Page 180 and 181:
Management’s Discussion and Analy
- Page 182 and 183:
Management’s Discussion and Analy
- Page 184 and 185:
Management’s Discussion and Analy
- Page 186 and 187:
Management’s Discussion and Analy
- Page 188 and 189:
Management’s Discussion and Analy
- Page 190 and 191:
Management’s Discussion and Analy
- Page 192 and 193:
Management’s Discussion and Analy
- Page 194 and 195:
Management’s Discussion and Analy
- Page 196 and 197:
DIRECTORS, EXECUTIVE OFFICERS ANDCO
- Page 198 and 199:
Directors, Executive Officers and C
- Page 200 and 201:
Directors, Executive Officers and C
- Page 202 and 203:
Directors, Executive Officers and C
- Page 204 and 205:
Standard ArrangementsDirectorsEXECU
- Page 206 and 207:
Executive Compensationi. The Compan
- Page 208 and 209:
Security Ownership of Management an
- Page 210 and 211:
Description of Debtshareholders, in
- Page 212 and 213:
FINANCIAL INFORMATIONThe following
- Page 215:
Globe Telecom, Inc. and Subsidiarie
- Page 219 and 220:
GLOBE TELECOM, INC. AND SUBSIDIARIE
- Page 221 and 222:
GLOBE TELECOM, INC. AND SUBSIDIARIE
- Page 223 and 224:
GLOBE TELECOM, INC. AND SUBSIDIARIE
- Page 225 and 226:
- 3 -Name of Subsidiary Place of In
- Page 227 and 228:
- 5 -The amendments require entitie
- Page 229 and 230:
- 7 -PAS 32, Financial Instruments:
- Page 231 and 232:
- 9 -The Globe Group offers loyalty
- Page 233 and 234:
- 11 -For all other financial instr
- Page 235 and 236:
- 13 -account in the consolidated s
- Page 237 and 238:
- 15 -Fair Value HedgesFair value h
- Page 239 and 240:
- 17 -2.7.4.2.1.1 SubscribersManage
- Page 241 and 242:
- 19 -2.7.4.3.2 Financial Liability
- Page 243 and 244:
- 21 -Transfers are made to investm
- Page 245 and 246:
- 23 -An impairment loss is recogni
- Page 247 and 248:
- 25 -Where an equity-settled award
- Page 249 and 250:
- 27 -Leases where the lessor retai
- Page 251 and 252:
- 29 -retains all the significant r
- Page 253 and 254:
- 31 -3.2.2 Allowance for impairmen
- Page 255 and 256:
- 33 -In 2012, 2011 and 2010, the G
- Page 257 and 258:
- 35 -3.2.8 Financial assets and fi
- Page 259 and 260:
- 37 -Inventories recognized as exp
- Page 261 and 262:
- 39 -TelecommunicationsEquipmentBu
- Page 263 and 264:
- 41 -9. Intangible Assets and Good
- Page 265 and 266:
- 43 -On May 10, 2011, the BOD of G
- Page 267 and 268: - 45 -converted into new BTI shares
- Page 269 and 270: - 47 -The interest rates and maturi
- Page 271 and 272: - 49 -The Globe Group, in their reg
- Page 273 and 274: - 51 -The funded status for the pen
- Page 275 and 276: - 53 -16.5 Transactions with key ma
- Page 277 and 278: - 55 -2011RevenuesAmount/Volume Out
- Page 279 and 280: - 57 -17. Equity and Other Comprehe
- Page 281 and 282: - 59 -For the Year Ended December 3
- Page 283 and 284: - 61 -The average share prices at d
- Page 285 and 286: - 63 -The overall expected rate of
- Page 287 and 288: - 65 -Interest expense - net is inc
- Page 289 and 290: - 67 -The reconciliation of the pro
- Page 291 and 292: - 69 -In addition, total payments t
- Page 293 and 294: - 71 -25.7 Construction Maintenance
- Page 295 and 296: - 73 -The succeeding discussion foc
- Page 297 and 298: - 75 -28.2.1.2 Foreign Exchange Ris
- Page 299 and 300: - 77 -The Globe Group makes a quart
- Page 301 and 302: - 79 -The table below provides info
- Page 303 and 304: - 81 -28.2.3 Liquidity RiskThe Glob
- Page 305 and 306: - 83 -20112012 2013 2014 20152016 a
- Page 307 and 308: - 85 -The following tables present
- Page 309 and 310: - 87 -2010Other Financial Liabiliti
- Page 311 and 312: - 89 -2010NotionalAmountNotionalAmo
- Page 313 and 314: - 91 -Nondeliverable ForwardsThe Gl
- Page 315 and 316: - 93 -28.10 Categories of Financial
- Page 317: - 95 -December 312012 2011 2010(In
- Page 321 and 322: - 99 -29.2 Wireline Communications
- Page 323 and 324: - 101 -31. Events after the Reporti
- Page 325 and 326: GLOBE TELECOM, INC. AND SUBSIDIARIE
- Page 327 and 328: GLOBE TELECOM, INC. AND SUBSIDIARIE
- Page 329 and 330: GLOBE TELECOM, INC. AND SUBSIDIARIE
- Page 331 and 332: GLOBE TELECOM, INC. AND SUBSIDIARIE
- Page 333 and 334: - 3 -PFRS 10 establishes a single c
- Page 335 and 336: - 5 -3. Property and EquipmentThe r
- Page 337 and 338: - 7 -4. Intangible Assets and Goodw
- Page 339 and 340: - 9 -As of March 31, 2013 and Decem
- Page 341 and 342: - 11 -On February 10, 2012, the BOD
- Page 343 and 344: - 13 -The Amendment to PAS 19 has b
- Page 345 and 346: - 15 -upgrade and overhaul of its b
- Page 347 and 348: - 17 -14.2 Capital and Financial Ri
- Page 349 and 350: - 19 -14.2.1.2 Foreign Exchange Ris
- Page 351 and 352: - 21 -comprise short-term bank depo
- Page 353 and 354: - 23 -December 31, 2012Neither Past
- Page 355 and 356: - 25 -March 31, 2013The following i
- Page 357 and 358: - 27 -March 31, 2012Liabilities:Lon
- Page 359 and 360: - 29 -The following tables present
- Page 361 and 362: - 31 -December 31, 2012Other Financ
- Page 363 and 364: December 31, 2012- 33 -NotionalAmou
- Page 365 and 366: - 35 -Deliverable ForwardsThe Globe
- Page 367 and 368: - 37 -The distinction of the result
- Page 369 and 370:
- 39 -March 31, 2013GrossamountsAmo
- Page 371 and 372:
- 41 -The Globe Group’s segment i
- Page 373 and 374:
- 43 -The reconciliation of the EBI
- Page 375 and 376:
- 45 -(EDGE), General Packet Radio
- Page 377 and 378:
RECONCILIATION OF RETAINED EARNINGS
- Page 379 and 380:
icialAsets(0ciZ(M mber31,201: sa@o
- Page 381 and 382:
5air3 op @o =o i@^ X3.9- >u "ai00OJ
- Page 383 and 384:
B01V.
- Page 385:
Guarantees of Securities of Other I