

GETINGE AB ANNUAL REPORT 2007 - Alle jaarverslagen
GETINGE AB ANNUAL REPORT 2007 - Alle jaarverslagen
GETINGE AB ANNUAL REPORT 2007 - Alle jaarverslagen

You also want an ePaper? Increase the reach of your titles
YUMPU automatically turns print PDFs into web optimized ePapers that Google loves.
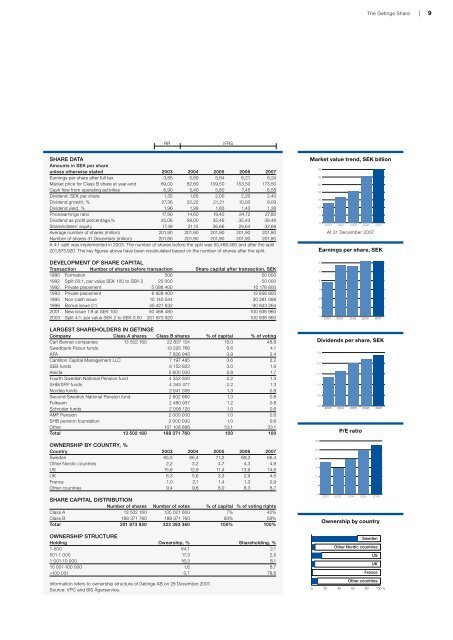
The Getinge Share | 9RRIFRSSHARE DATAAmounts in SEK per shareunless otherwise stated 2003 2004 2005 2006 <strong>2007</strong>Earnings per share after full tax 3,85 5,69 5,64 6,21 6,24Market price for Class B share at year-end 69,00 82,80 109,50 153,50 173,50Cash flow from operating activities 6,90 5,40 5,80 7,45 6,58Dividend, SEK per share 1,35 1,65 2,00 2,20 2,40Dividend growth, % 27,36 22,22 21,21 10,00 9,09Dividend yield, % 1,96 1,99 1,83 1,43 1,38Price/earnings ratio 17,90 14,60 19,40 24,72 27,80Dividend as profit percentage,% 35,06 29,00 35,46 35,43 38,46Shareholders’ equity 17,49 21,15 26,66 29,64 32,68Average number of shares (million) 201,90 201,90 201,90 201,90 201,90Number of shares 31 December (million) 201,90 201,90 201,90 201,90 201,90A 4:1 split was implemented in 2003. The number of shares before the split was 50,468,480 and after the split201,873,920. The key figures above have been recalculated based on the number of shares after the split.Market value trend, SEK billion353025201510502003 2004 2005 2006 <strong>2007</strong>At 31 December <strong>2007</strong>Earnings per share, SEKDEVELOPMENT OF SHARE CAPITALTransaction Number of shares before transaction Share capital after transaction, SEK1990 Formation 500 50 0001992 Split 50:1, par value SEK 100 to SEK 2 25 000 50 0001992 Private placement 5 088 400 10 176 8001993 Private placement 6 928 400 13 856 8001995 Non-cash issue 15 140 544 30 281 0881996 Bonus issue 2:1 45 421 632 90 843 2642001 New issue 1:9 at SEK 100 50 468 480 100 936 9602003 Split 4:1, par value SEK 2 to SEK 0.50 201 873 920 100 936 96065432102003 2004 2005 2006 <strong>2007</strong>LARGEST SHAREHOLDERS IN <strong>GETINGE</strong>Company Class A shares Class B shares % of capital % of votingCarl Bennet companies 13 502 160 22 837 124 18.0 48.8Swedbank Robur funds 13 225 766 6.6 4.1AFA 7 826 945 3.9 2.4Cantillon Capital Management LLC 7 197 485 3.6 2.2SEB funds 6 152 822 3.0 1.9Alecta 5 600 000 2.8 1.7Fourth Swedish National Pension fund 4 352 300 2.2 1.3SHB/SPP funds 4 345 477 2.2 1.3Nordea funds 2 641 356 1.3 0.8Second Swedish National Pension fund 2 602 660 1.3 0.8Folksam 2 480 937 1.2 0.8Schroder funds 2 006 125 1.0 0.6AMF Pension 2 000 000 1.0 0.6SHB pension foundation 2 000 000 1.0 0.6Other 107 108 888 53.1 33.1Total 13 502 160 188 371 760 100 100Dividends per share, SEK2,52,01,51,00,50,02003 2004 2005 2006 <strong>2007</strong>P/E ratioOWNERSHIP BY COUNTRY, %Country 2003 2004 2005 2006 <strong>2007</strong>Sweden 65,5 66,4 71,2 69,3 66,4Other Nordic countries 2,2 3,2 4,7 4,3 4,9US 15,6 12,9 11,4 13,9 14,6UK 6,3 5,6 3,3 2,9 4,5France 1,0 2,1 1,4 1,3 0,9Other countries 9,4 9,8 8,0 8,3 8,7SHARE CAPITAL DISTRIBUTIONNumber of shares Number of votes % of capital % of voting rightsClass A 13 502 160 135 021 600 7% 42%Class B 188 371 760 188 371 760 93% 58%Total 201 873 920 323 393 360 100% 100%3025201510502002 2003 2004 2005 2006Ownership by countryOWNERSHIP STRUCTUREHolding Ownership, % Shareholding, %1-500 64,1 2,1501-1 000 17,3 2,51 001-10 000 16,3 8,110 001-100 000 1,6 8,7>100 001 0,7 78,6Information refers to ownership structure of Getinge <strong>AB</strong> on 28 December <strong>2007</strong>.Source: VPC and SIS Ägarservice.SwedenOther Nordic countriesUSUKFranceOther countries0 20 40 60 80 100 %


