2012-13 Annual Water Quality Monitoring Plan - Hunter Water
2012-13 Annual Water Quality Monitoring Plan - Hunter Water
2012-13 Annual Water Quality Monitoring Plan - Hunter Water

Create successful ePaper yourself
Turn your PDF publications into a flip-book with our unique Google optimized e-Paper software.
<strong>2012</strong>-<strong>13</strong> <strong>Annual</strong> <strong>Water</strong> <strong>Quality</strong><strong>Monitoring</strong> <strong>Plan</strong>July <strong>2012</strong>
<strong>2012</strong>-<strong>13</strong> <strong>Annual</strong> <strong>Water</strong> <strong>Quality</strong> <strong>Monitoring</strong> <strong>Plan</strong>July <strong>2012</strong>
<strong>2012</strong>-<strong>13</strong> <strong>Annual</strong> <strong>Water</strong> <strong>Quality</strong> <strong>Monitoring</strong> <strong>Plan</strong>HW2006-1448/8/9.026July <strong>2012</strong><strong>Hunter</strong> <strong>Water</strong> Corporation36 Honeysuckle Drive Newcastle, NSW 2300PO Box 5171 HRMC NSW 2310www.hunterwater.com.au
Table of ContentsList of Tables ....................................................................................................................... iiList of Figures ..................................................................................................................... ii1 Operating Licence Requirements – <strong>Water</strong> <strong>Quality</strong> <strong>Monitoring</strong> .................................... 12 Strategic <strong>Water</strong> <strong>Quality</strong> <strong>Monitoring</strong> ............................................................................... 22.1 Source <strong>Water</strong> <strong>Monitoring</strong> ...................................................................................................... 32.2 Operational monitoring .......................................................................................................... 32.3 Customer based monitoring .................................................................................................. 32.4 Verification monitoring .......................................................................................................... 32.5 <strong>Monitoring</strong> in response to incidents and emergencies ........................................................... 33 Source <strong>Water</strong> .................................................................................................................. 43.1 Routine monitoring................................................................................................................ 4Notes on Raw (bulk) <strong>Water</strong> Testing ................................................................................... 83.2 Targeted, investigative and risk-based monitoring ............................................................... 104 Process Control and Operational <strong>Monitoring</strong> ............................................................. 125 Customer-Based <strong>Monitoring</strong>........................................................................................ 156 <strong>Water</strong> <strong>Quality</strong> <strong>Monitoring</strong> in Response to Incidents .................................................. 177 Verification <strong>Monitoring</strong>................................................................................................. 187.1 Background ........................................................................................................................ 187.2 Sampling frequency ............................................................................................................ 187.3 Assessing compliance on verification monitoring ................................................................. 227.3.1 Assessing verification compliance for Chichester, Grahamstown, Lemon TreePassage and Anna Bay/Nelson Bay water supply systems ....................................... 227.3.2 Assessing verification monitoring compliance for Gresford water supply system ....... 247.4 Comprehensive program for sampling and analysis ............................................................ 267.4.1 Treated <strong>Water</strong> – Chichester, Grahamstown, Lemon tree Passage and NelsonBay/Anna Bay Zones ............................................................................................... 267.4.2 Gresford <strong>Water</strong> Treatment <strong>Plan</strong>t (WTP) ................................................................... 287.4.3 Distribution System – Sample Points at Customer’s <strong>Water</strong> Services – Chichester,Grahamstown, Lemon Tree Passage and Nelson Bay/Anna Bay Zones ................... 297.4.4 Gresford distribution system ..................................................................................... 317.5 Laboratory testing and reporting processes ......................................................................... 337.5.1 <strong>Quality</strong> assurance .................................................................................................... 337.5.2 Data verification and record keeping ........................................................................ 33Definitions, Acronyms, and Abbreviations ..................................................................... 34References ........................................................................................................................ 36Appendix A – <strong>Water</strong> quality sample points and water supply zones ............................ 37www.hunterwater.com.au<strong>2012</strong>-<strong>13</strong> <strong>Annual</strong> <strong>Water</strong> <strong>Quality</strong> <strong>Monitoring</strong> <strong>Plan</strong> │ i
List of TablesTable 2.1Components of water quality monitoring and corresponding elementsof the Framework ................................................................................................ 2Table 3.1 Routine drinking water monitoring parameters for raw (bulk) water – Chichester,Grahamstown, Tomago, Lemon Tree Passage, and Nelson Bay/Anna BaySources .............................................................................................................. 4Table 3.2 Routine drinking water monitoring parameters for Gresford raw water .............. 10Table 3.3 Risks to drinking water quality and corresponding targeted water qualitymonitoring ......................................................................................................... 11Table 4.1 On-line instrumentation at critical control points ................................................ 12Table 7.1 Populations and no. samples required in zones ................................................ 19Table 7.2 Distribution System <strong>Water</strong> <strong>Quality</strong> Sample Points for <strong>2012</strong>-<strong>13</strong> .......................... 19Table 7.3 Key parameters and criteria used to assess drinking water quality compliance for<strong>2012</strong>-<strong>13</strong> – Chichester, Grahamstown, Lemon Tree Passage and AnnaBay/Nelson Bay zones. ..................................................................................... 23Table 7.4 Key parameters and criteria to be used to assess drinking water qualitycompliance for Gresford zone for <strong>2012</strong>-<strong>13</strong> ........................................................ 25Table 7.5 Routine Drinking <strong>Water</strong> <strong>Monitoring</strong> Parameters Treated <strong>Water</strong> – Chichester,Grahamstown, Lemon tree Passage and Nelson Bay/Anna Bay Zones ............ 26Table 7.6 Routine drinking water monitoring parameters for Gresford WTP treated water 28Table 7.7 Routine Analysis Distribution System – Sample Points at Customer’s <strong>Water</strong>Services – Chichester, Grahamstown, Lemon Tree Passage and NelsonBay/Anna Bay Zones ........................................................................................ 29Table 7.8 Routine Analysis Distribution System – Sample Points at Customers’ <strong>Water</strong>Services – Gresford .......................................................................................... 32List of FiguresFigure 4.1 SCADA diagram for Grahamstown <strong>Water</strong> Treatment <strong>Plan</strong>t ............................... <strong>13</strong>Figure 5.1 <strong>Hunter</strong> <strong>Water</strong> data dashboard showing number of water quality complaints, bycategory, over the previous 7 days. .................................................................. 15ii │ <strong>2012</strong>-<strong>13</strong> <strong>Annual</strong> <strong>Water</strong> <strong>Quality</strong> <strong>Monitoring</strong> <strong>Plan</strong>www.hunterwater.com.au
1 Operating Licence Requirements – <strong>Water</strong> <strong>Quality</strong> <strong>Monitoring</strong><strong>Hunter</strong> <strong>Water</strong> delivers its services under an operating licence granted by the StateGovernment and administered by the Independent Pricing and Regulatory Tribunal (IPART).The operating licence is the major customer protection instrument and prescribes standardsof service that must be met in relation to water quality, continuity, pressure, sewer overflowsand wastewater transportation.Section 3.3 of the <strong>Hunter</strong> <strong>Water</strong> Corporation Operating Licence 2007-<strong>2012</strong> sets out therequirements for water quality monitoring:3.3 <strong>Water</strong> <strong>Quality</strong> – <strong>Monitoring</strong>3.3.1 <strong>Hunter</strong> <strong>Water</strong> must prepare, to the satisfaction of NSW Health, a comprehensiveannual water quality monitoring plan (<strong>Annual</strong> <strong>Water</strong> <strong>Quality</strong> <strong>Monitoring</strong> <strong>Plan</strong>) for the<strong>Water</strong> Supply System by 31 March each year, for the duration of the Licence. This<strong>Annual</strong> <strong>Water</strong> <strong>Quality</strong> <strong>Monitoring</strong> <strong>Plan</strong> must:a) include monitoring of Bulk <strong>Water</strong> and Drinking <strong>Water</strong> quality and details oflaboratory testing and reporting processes to ensure quality control;b) have regard to the concepts of good practice set out in the Australian Drinking<strong>Water</strong> Guidelines and apply those concepts as specified by NSW Health;c) for Bulk <strong>Water</strong>, include a list of characteristics that will be monitored to identifypotential hazards with the water supply, or a change in water quality;d) include targeted, investigative and event-based monitoring; ande) include monitoring for any other water characteristic nominated by NSWHealth.3.3.2 <strong>Monitoring</strong> under the <strong>Annual</strong> <strong>Water</strong> <strong>Quality</strong> <strong>Monitoring</strong> <strong>Plan</strong> must be undertakenfor the period from the Commencement Date to 30 June 2008 and after that for eachsubsequent financial year.3.3.3 The sampling frequency and the locations chosen for the Drinking <strong>Water</strong> qualitymonitoring should be representative of the quality of Drinking <strong>Water</strong> supplied toConsumers.3.3.4 <strong>Hunter</strong> <strong>Water</strong> must provide IPART with a copy of the <strong>Annual</strong> <strong>Water</strong> <strong>Quality</strong><strong>Monitoring</strong> <strong>Plan</strong> as soon as possible after it is agreed with NSW Health. <strong>Hunter</strong> <strong>Water</strong>must make a copy of that plan available to the public after it has been provided toIPART.3.3.5 If <strong>Hunter</strong> <strong>Water</strong> and NSW Health cannot agree on the <strong>Annual</strong> <strong>Water</strong> <strong>Quality</strong><strong>Monitoring</strong> <strong>Plan</strong>, the views of NSW Health will prevail and <strong>Hunter</strong> <strong>Water</strong> must acceptthe <strong>Annual</strong> <strong>Water</strong> <strong>Quality</strong> <strong>Monitoring</strong> <strong>Plan</strong> determined by NSW Health.www.hunterwater.com.au<strong>2012</strong>-<strong>13</strong> <strong>Annual</strong> <strong>Water</strong> <strong>Quality</strong> <strong>Monitoring</strong> <strong>Plan</strong> │ 1
2 Strategic <strong>Water</strong> <strong>Quality</strong> <strong>Monitoring</strong>Protection of public health by assuring the safety of drinking water is the primary objective ofdrinking water quality management and treatment.The 2011 Australian Drinking <strong>Water</strong> <strong>Quality</strong> Guidelines (ADWG) Framework for theManagement of Drinking <strong>Water</strong> <strong>Quality</strong> (the framework) provides the basis for managementof drinking water quality at <strong>Hunter</strong> <strong>Water</strong> Corporation (<strong>Hunter</strong> <strong>Water</strong>). The frameworkemphasises a preventative risk management approach for all steps in water supply from thewater source to the consumer.The Framework incorporates a strategic approach to water quality monitoring:“The best assurance of drinking water safety is to develop a complete monitoringsystem which includes relevant monitoring aspects of research, operationalperformance, validation and verification…Essentially, a strategic water qualitymonitoring system involves an integrated program of source water, process controland event-driven monitoring when the system is being increasingly challenged,supplemented with verifying the effectiveness of distribution system preventionprograms, and monitoring consumer satisfaction”(Rizak and Hrudey 2007, p. 5.)<strong>Hunter</strong> <strong>Water</strong>’s drinking water quality monitoring plan corresponds to the following elementsof the Framework as shown in Table 2.1 below.Table 2.1 Components of water quality monitoring and corresponding elements ofthe Framework<strong>Monitoring</strong> ComponentFrameworkElementElement DescriptionSource <strong>Water</strong> <strong>Monitoring</strong> Element 2 Assessment of drinking water supplysystemOperational <strong>Monitoring</strong> Element 4 Operational procedures and processcontrolCustomer Based <strong>Monitoring</strong> Element 4 Operational procedures and processcontrolVerification <strong>Monitoring</strong> Element 5 Verification of drinking water quality<strong>Monitoring</strong> in response toincidents and emergenciesElement 6Management of incidents andemergencies2 │ <strong>2012</strong>-<strong>13</strong> <strong>Annual</strong> <strong>Water</strong> <strong>Quality</strong> <strong>Monitoring</strong> <strong>Plan</strong>www.hunterwater.com.au
2.1 Source <strong>Water</strong> <strong>Monitoring</strong>Historical water quality data can assist in understanding source water characteristics andsystem performance. This can aid the identification of hazards and aspects of the drinkingwater supply system which require improvement.Trend analysis and control charts to monitor source water quality are used for recognisingpotential problems or hazards and the accumulation of any gradual changes or cumulativeeffects.Source water quality monitoring builds on current knowledge and increases <strong>Hunter</strong> <strong>Water</strong>’sunderstanding of its supply systems.2.2 Operational monitoringOperational monitoring includes water quality monitoring to assess and confirm theperformance of preventive measures. On-line operational monitoring of water qualityparameters is a key component of process control and “real-time” management of drinkingwater quality. Data from operational monitoring is used as a trigger for corrective actions toimprove drinking water quality. Examples include on-line monitoring for fluoride, chlorineresidual, pH and turbidity.2.3 Customer based monitoringAn effective customer complaint and response system closely linked to operations is animportant component of preventive strategy for drinking water safety. Customer complaintsare documented and investigated. A customer complaints system is in place to highlight andtrack unusual types or numbers of complaints.2.4 Verification monitoringVerification of drinking water quality provides an assessment of the overall performance ofthe system and the ultimate quality of drinking water being supplied to customers. The waterquality verification monitoring plan includes monitoring at representative points throughoutthe supply system. All source waters, treatment processes, and distribution systems areroutinely monitored for a range of parameters using a National Association of TestingAuthorities (NATA) accredited laboratory testing program.2.5 <strong>Monitoring</strong> in response to incidents and emergenciesProtocols for response to water quality incidents and emergencies include increased andstrategic monitoring of water quality. <strong>Hunter</strong> <strong>Water</strong> has in place the capacity to sample andanalyse water quality at short notice, and with minimum turnaround times.www.hunterwater.com.au<strong>2012</strong>-<strong>13</strong> <strong>Annual</strong> <strong>Water</strong> <strong>Quality</strong> <strong>Monitoring</strong> <strong>Plan</strong> │ 3
3 Source <strong>Water</strong>Routine as well as targeted and investigative monitoring is undertaken at source waters.This water quality data is analysed and incorporated into the risk assessment process. Trendanalysis and control charts are used for recognising potential problems or hazards and theaccumulation of any gradual changes or cumulative effects.Analysis of source waters contributes to the framework principle “know your system”, that is,the data aids in understanding <strong>Hunter</strong> <strong>Water</strong>’s sources and assessing the risks.3.1 Routine monitoringUnder the operating licence, the water quality monitoring plan for bulk water must include alist of characteristics that will be monitored to identify potential hazards with the watersupply, or a change in water quality.Table 3.1 sets out routine drinking water quality parameters for raw (bulk) waters forChichester, Grahamstown, Tomago, Lemon Tree Passage, and Nelson Bay/Anna BaySources. Table 3.2 on page 9 sets out routine drinking water quality parameters for rawwater for Gresford.Table 3.1 Routine drinking water monitoring parameters for raw (bulk) water –Chichester, Grahamstown, Tomago, Lemon Tree Passage, and NelsonBay/Anna Bay SourcesParameter Frequency No. oflocationsAnalysis by:pH Daily 6 HWA <strong>Water</strong> TreatmentTurbidity Daily 6 HWA <strong>Water</strong> TreatmentFluorideIronManganeseDaily at Grahamstown,Dungog and Tomago.Weekly at Lemon TreePassage, Anna Bay andNelson Bay6 HWA <strong>Water</strong> TreatmentAluminium Weekly 6 HWA <strong>Water</strong> TreatmentCyanobacteriaWeekly (more frequentlyif elevatedconcentrations ofpotentially toxic generadetected)4 atGrahamstownand 7 atChichesterHWAE. coli Weekly 6 HWATotal Coliforms Weekly 6 HWA4 │ <strong>2012</strong>-<strong>13</strong> <strong>Annual</strong> <strong>Water</strong> <strong>Quality</strong> <strong>Monitoring</strong> <strong>Plan</strong>www.hunterwater.com.au
Parameter Frequency No. oflocationsAnalysis by:Heterotrophic Plate Count Weekly 2 HWAAmmonia Quarterly 6 HWANitrites Quarterly 6 HWANitrates Quarterly 6 HWACryptosporidiumGiardiaQuarterly at Lemon TreePassage, Nelson Bayand Anna Bay,FortnightlyGrahamstown andChichesterQuarterly at Lemon TreePassage, Nelson Bayand Anna Bay,FortnightlyGrahamstown andChichester6 HWA6 HWA2-Methylisoborneol (MIB) Weekly Grahamstownand Chichester 1HWAGeosmin Weekly Grahamstownand Chichester 1HWAAldrin Monthly 6 HWAAmitrole Monthly 6 ALSAtrazine Monthly 6 ALSChlordane Monthly 6 HWA2,4-D Monthly 6 ALSDDT Monthly 6 HWADieldrin Monthly 6 HWADiuron Monthly 6 ALSEndosulphan Monthly 6 HWAHeptachlor Monthly 6 HWA1 Sampling for MIB and Geosmin for Chichester source is undertaken in Dungog filtered water, ie afterflocculation and filtration, but before disinfection, fluoridation and pH and alkalinity correctionwww.hunterwater.com.au<strong>2012</strong>-<strong>13</strong> <strong>Annual</strong> <strong>Water</strong> <strong>Quality</strong> <strong>Monitoring</strong> <strong>Plan</strong> │ 5
Parameter Frequency No. oflocationsAnalysis by:Lindane Monthly 6 HWAMolinate Monthly 6 ALSPicloram Monthly 6 ALSPropiconazole Monthly 6 ALSTemephos Monthly 6 ALSPolychlorinated Biphenyl(PCB)Quarterly 6 ALSGlyphosate Quarterly 6 ALSMetsulfuron-methyl Quarterly 6 ALSAntimony Quarterly 6 HWAArsenicQuarterly atGrahamstown andChichester, weekly atTomago, Lemon TreePassage, Anna Bay,Nelson Bay6 HWABarium Quarterly 6 HWABeryllium Quarterly 6 HWABoron Quarterly 6 ALSCadmium Quarterly 6 HWAChromium Quarterly 6 HWACopper Quarterly 6 HWACyanide Quarterly 6 ALSIodide Quarterly 6 AWQCLead Quarterly 6 HWAMercury Quarterly 6 HWANickel Quarterly 6 HWAMolybdenum Quarterly 6 HWASelenium Quarterly 6 HWASodium Quarterly 6 HWA6 │ <strong>2012</strong>-<strong>13</strong> <strong>Annual</strong> <strong>Water</strong> <strong>Quality</strong> <strong>Monitoring</strong> <strong>Plan</strong>www.hunterwater.com.au
Parameter Frequency No. oflocationsAnalysis by:Sulphide Quarterly 6 HWATin Quarterly 6 HWAZinc Quarterly 6 HWAPathogenic Thermophilicand Nuisance MesophilicAmoeba<strong>Annual</strong>ly 6 AWQCBeryllium Once every five years 6 HWASilver Quarterly 6 HWABenzene Once every five years at 6 SGSChlorobenzeneLemon Tree Passage,Anna Bay, Nelson Bayand Chichester /6 SGSDichlorobenzenes1,2-dichlorobenzene1,3-dichlorobenzene1,4-dichlorobenzene<strong>Annual</strong>ly atGrahamstown andTomago6 SGSDichloroethanes1,1-dichloroethanes1,2-dichloroethanesDichloroethenes1,1-dichloroethenes1,2-dichloroethenesDichloromethane(methylene chloride)6 SGS6 SGS6 SGSEthylbenzene 6 SGSEthylenediamine tetraaceticacid (EDTA)6 SGSHexachlorobutadiene 6 SGSNitrilotriacetic acid 6 SGSwww.hunterwater.com.au<strong>2012</strong>-<strong>13</strong> <strong>Annual</strong> <strong>Water</strong> <strong>Quality</strong> <strong>Monitoring</strong> <strong>Plan</strong> │ 7
Parameter Frequency No. oflocationsAnalysis by:OrganotinsDibutyltinTributyltin6 Leeder ConsultingStyreneTetrachloroetheneTolueneOnce every five years atLemon Tree Passage,Anna Bay, Nelson Bayand Chichester /<strong>Annual</strong>ly atGrahamstown andTomago666SGSSGSSGSTrichlorobenzenes (total) 6 SGS1,1,1-Trichloroethane 6 SGSTrichloroethylene (TCE) 6 SGSVinyl Chloride 6 SGSRadiological - Gross alpha &beta activityOnce every two yearsfor groundwater (AnnaBay, Nelson Bay LemonTree Passage andTomago), once everyfive years for surfacewater (Grahamstownand Dungog)6 ANSTONotes on Raw (bulk) <strong>Water</strong> TestingThe six raw water sources referred to previously in Table 3.1 are:• Chichester Dam;• Grahamstown Dam;• Tomago bores;• Lemon Tree Passage bores;• Anna Bay bores; and8 │ <strong>2012</strong>-<strong>13</strong> <strong>Annual</strong> <strong>Water</strong> <strong>Quality</strong> <strong>Monitoring</strong> <strong>Plan</strong>www.hunterwater.com.au
• Nelson Bay bores.The six locations nominated represent each of the raw water sources excluding the Gresfordwater supply system.For Cyanobacteria, samples are only taken from the surface water supplies. The samplesare collected from Chichester Dam (at 6 depths and at off take), Williams River at Boags Hill(off take for pumping to Grahamstown) and at three locations within Grahamstown Dam andGrahamstown Dam raw. Triggers for notification of NSW Health and increased frequency ofmonitoring are based on cell count and biovolume in 2011 ADWG fact sheets, as advised byNSW Health.Particle counting is undertaken at Dungog and Grahamstown <strong>Water</strong> Treatment <strong>Plan</strong>ts.Weekly monitoring for the taste and odour compounds 2-Methylisoborneol (MIB) andGeosmin is undertaken at Grahamstown raw and Dungog filtered (i.e. after coagulation andfiltration, and before fluoridation, disinfection, pH and alkalinity correction). During taste andodour events, the frequency of analysis may be increased.<strong>Monitoring</strong> for Cryptosporidium and Giardia is undertaken fortnightly for Dungog andGrahamstown raw waters, and quarterly for Tomago, Lemon Tree Passage, Anna Bay andNelson Bay raw waters. The corresponding treated water is analysed if Cryptosporidium orGiardia are detected at any level in the raw water. Note that treated surface waters fromChichester and Grahamstown are also analysed for Cryptosporidium and Giardia quarterly(even if not detected in the raw water).<strong>Hunter</strong> <strong>Water</strong> is investigating pesticide usage within its catchments. A revised pesticidemonitoring schedule (including monitoring for pesticides at Gresford) will be developed andimplemented in line with the revised schedule.www.hunterwater.com.au<strong>2012</strong>-<strong>13</strong> <strong>Annual</strong> <strong>Water</strong> <strong>Quality</strong> <strong>Monitoring</strong> <strong>Plan</strong> │ 9
Gresford Raw <strong>Water</strong> <strong>Monitoring</strong>Gresford is a small water supply system, with about 150 properties connected to water atGresford and East Gresford. Routine source water quality monitoring for the Gresford watersupply is shown in Table 3.2. Given the scale of this water supply system, monitoring isundertaken for a smaller range of parameters than for the other six sources. The monitoringprogram was informed by risk assessment undertaken for this supply, and is designed toprovide data to adequately characterise the raw water quality for this supply.Table 3.2 Routine drinking water monitoring parameters for Gresford raw waterParameter Frequency No. of locations Analysis byE.coli Weekly 1 HWATotal Coliforms Weekly 1 HWATemperature Weekly 1 HWApH Weekly 1 HWATurbidity Weekly 1 HWACalcium Fortnightly 1 HWABlue-Green Algal Analysis Weekly (from Dec to Febinclusive)2 (Allyn andPaterson)HWACryptosporidium & Giardia Six-Monthly 2 (Allyn andPaterson)Total organic carbon Fortnightly 2 (Allyn andPaterson)Dissolved organic carbon Fortnightly 2 (Allyn andPaterson)HWAHWAHWAAlkalinity 3 times a week 1 (RWT) HWA <strong>Water</strong> TreatmentColour True and Apparent 3 times a week 1 (RWT) HWA <strong>Water</strong> TreatmentConductivity 3 times a week 1 (RWT) HWA <strong>Water</strong> TreatmentIron (total and soluble) Weekly 1 (RWT) HWA <strong>Water</strong> TreatmentManganese (total andsoluble)Weekly 1 (RWT) HWA <strong>Water</strong> TreatmentAluminium 3 times a week 1 (RWT) HWA <strong>Water</strong> Treatment3.2 Targeted, investigative and risk-based monitoring<strong>Hunter</strong> <strong>Water</strong> undertakes targeted, investigative and risk-based monitoring to increaseunderstanding of risks to drinking water quality. "Event-based" monitoring during rainfall10 │ <strong>2012</strong>-<strong>13</strong> <strong>Annual</strong> <strong>Water</strong> <strong>Quality</strong> <strong>Monitoring</strong> <strong>Plan</strong>www.hunterwater.com.au
events has been undertaken at Campvale Canal as the canal drains water from a semiurbancatchment and is pumped to Grahamstown Dam. This part of the catchment wasidentified during risk assessment as a potential risk of increased pathogens and pesticidesparticularly during rainfall events.This monitoring plan has been established to increase <strong>Hunter</strong> <strong>Water</strong>’s understanding of thesupply system and supports the collection of water quality data that adds value to theexisting body of knowledge from catchment to tap. These monitoring programs aim to fill inknowledge gaps identified through the Framework’s hazard identification and riskassessment process.Risks have been characterised in detail under the Framework, however, the broadcategories of risk for <strong>Hunter</strong> <strong>Water</strong>’s water supplies include:• Pathogens;• Blue-green algae (for surface storages);• High Turbidity; and• Chemicals (from natural geology, land use within catchment, pesticides, spillsand water treatment chemicals).Examples of risks identified and corresponding targeted monitoring are outlined in Table 3.3.Table 3.3 Risks to drinking water quality and corresponding targeted water qualitymonitoringRisk to Drinking <strong>Water</strong> <strong>Quality</strong>Pathogens, including bacteria, viruses,protozoaBlue-Green algal risksArsenic, Manganese, Iron in Tomago sourcePotential impact of Salt Ash Air WeaponsRangeCampvale Canal wet weather inflows toGrahamstown DamInflows to Chichester Dam from Chichesterand Wangat RiversTargeted <strong>Water</strong> <strong>Quality</strong> <strong>Monitoring</strong>E.coli, Cryptosporidium, Giardia and Amoeba(summer)Increased sampling frequency, speciation,and toxicity / Taste and Odour analysis asconcentrations of BGA increase in line withBGA contingency planWeekly analysis of Fe, Mn and As atindividual Tomago stations while operatingQuarterly Analysis for heavy metals at borestations downstream of this siteEvent-based monitoring for nutrients, E. coli,cryptosporidium and giardiaProposed rising inflow sampling to determinerelative load and characteristics ofsuspended solids after rainfall in theChichester and Wangat Rivers<strong>2012</strong>-<strong>13</strong> <strong>Annual</strong> <strong>Water</strong> <strong>Quality</strong> <strong>Monitoring</strong> <strong>Plan</strong> │ 11www.hunterwater.com.au
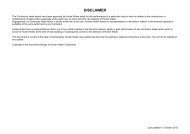
4 Process Control and Operational <strong>Monitoring</strong><strong>Hunter</strong> <strong>Water</strong> uses monitoring protocols for the operational performance of its water supplysystem including the selection of operational parameters and criteria and the routine analysisof results. These include the monitoring of key parameters such as turbidity, pH, colour, iron,manganese, aluminium, copper, lead, zinc, fluoride, chlorine and trihalomethanes (THMs).A critical control point is an activity, procedure or process at which control can be appliedand which is essential to prevent a hazard or reduce it to an acceptable level. Critical controlpoints are monitored throughout the system as part of <strong>Hunter</strong> <strong>Water</strong>’s process controlstrategy. The collective effect of the target criteria and critical limits at all identified controlpoints can consistently and effectively control all significant hazards.<strong>Monitoring</strong> of key parameters in water sourced from raw water storages is undertaken toidentify possible sources of contamination. <strong>Hunter</strong> <strong>Water</strong> also uses continuous on-linemonitoring equipment for the monitoring of target criteria and critical limit parameterswherever possible, particularly at the most important control points. This is carried out viatelemetered Supervisory Control and Data Acquisition (SCADA) systems, ProgrammableLogic Controllers (PLCs), water quality sampling results, catchment observation reports andtreatment plant operational spreadsheets. This operational data is collected and monitored ina form that allows rapid detection of trends and can act as a trigger for the correction ofdeviations in treatment processes.A planned sequence of measurements and observations throughout the supply system isused to assess and confirm the performance of preventive measures already in place.<strong>Hunter</strong> <strong>Water</strong> uses timely monitoring for operational parameters where continuous on-linemonitoring is not possible or necessary. These include regular inspections of the catchmentsand reservoirs and monitoring of surrogate water quality parameters. Operational surrogatesare another strategy that <strong>Hunter</strong> <strong>Water</strong> uses to monitor overall water treatment performance.These parameters include turbidity, chlorine residual, flow, rainfall events, pH, particlecounts and conductivity.On-line instrumentation used to monitor treated water quality at critical control points isshown in Table 4.1.Table 4.1 On-line instrumentation at critical control pointsLocation /InstrumentChlorineanalyserpHmeterTurbiditymeterFluorideanalyserChichester Dam √ √Dungog WTP √ √ √ √Buttai Chlorinator√Grahamstown WTP √ √ √ √12 │ <strong>2012</strong>-<strong>13</strong> <strong>Annual</strong> <strong>Water</strong> <strong>Quality</strong> <strong>Monitoring</strong> <strong>Plan</strong>www.hunterwater.com.au
Location /InstrumentChlorineanalyserpHmeterTurbiditymeterFluorideanalyserNorth LambtonChlorinator√Toronto Chlorinator√Cardiff Chlorinator√South WallsendChlorinator√Lemon Tree PassageWTP√ √ √ √Anna Bay WTP √ √ √ √Nelson Bay WTP √ √ √ √Gresford WTP √ √ √Data from on-line instruments is monitored 24 hours a day with alarms to alert the operatorwhen an alarm limit has been exceeded to allow appropriate corrective action taken.Figure 4.1 SCADA diagram for Grahamstown <strong>Water</strong> Treatment <strong>Plan</strong>twww.hunterwater.com.au<strong>2012</strong>-<strong>13</strong> <strong>Annual</strong> <strong>Water</strong> <strong>Quality</strong> <strong>Monitoring</strong> <strong>Plan</strong> │ <strong>13</strong>
Other examples of on-line monitoring for operational control include on-line monitoring ofrainfall in the Chichester catchment and turbidity at the dam. Due to increased solids loadingon the filters, flow through Dungog <strong>Water</strong> Treatment <strong>Plan</strong>t needs to be reduced duringperiods of elevated turbidity. Rainfall and turbidity data provides an early warning, or trigger,to reduce flow through the plant.Various processes are used to ensure that any potentially adverse monitoring results arerapidly notified to operational staff authorised to initiate corrective action. These include<strong>Water</strong> Treatment <strong>Plan</strong>t spreadsheets, automated alarms, data exception emails, as well aslaboratory non-conformance procedures.<strong>Hunter</strong> <strong>Water</strong> sets target criteria that are more stringent than critical limits and has in placeprocedures to ensure that the operational monitoring (process monitoring) is implementedeffectively.14 │ <strong>2012</strong>-<strong>13</strong> <strong>Annual</strong> <strong>Water</strong> <strong>Quality</strong> <strong>Monitoring</strong> <strong>Plan</strong>www.hunterwater.com.au
5 Customer-Based <strong>Monitoring</strong><strong>Hunter</strong> <strong>Water</strong> undertakes its customer-based monitoring on a continual basis which includesa process for recording all customer water quality complaints and the actions undertaken inresponse to these complaints. Routine water quality complaints such as dirty watercomplaints that require a simple follow-up (e.g. flushing) are recorded in the AssetsOperations Maintenance System (AOMS). Complaints that require more detailed follow-up(e.g. ongoing water quality problems) are dealt with under the Complaint ManagementSystem.<strong>Hunter</strong> <strong>Water</strong> responds to customer water quality complaints based on standard operatingprocedures. These procedures include a clear definition of authorities and responsibilities.A daily review of water quality monitoring results is made possible using internal datamanagement systems. Figure 5.1 shows a screen shot of the “<strong>Hunter</strong> <strong>Water</strong> SystemsPerformance Dashboard.”Figure 5.1 <strong>Hunter</strong> <strong>Water</strong> data dashboard showing number of water quality complaints,by category, over the previous 7 days.www.hunterwater.com.au<strong>2012</strong>-<strong>13</strong> <strong>Annual</strong> <strong>Water</strong> <strong>Quality</strong> <strong>Monitoring</strong> <strong>Plan</strong> │ 15
The dashboard shows numbers of water quality complaints over the seven days, by categoryof complaint. The dashboard can act as a trigger for further investigation or operationalresponse. For example, during a taste and odour event, feedback from customers may beused to trigger Powdered Activated Carbon (PAC) dosing. Feedback from customers can, attimes, be quicker than laboratory analysis of the taste and odour compoundsMethylisoborneol (MIB) and geosmin.16 │ <strong>2012</strong>-<strong>13</strong> <strong>Annual</strong> <strong>Water</strong> <strong>Quality</strong> <strong>Monitoring</strong> <strong>Plan</strong>www.hunterwater.com.au
6 <strong>Water</strong> <strong>Quality</strong> <strong>Monitoring</strong> in Response to Incidents<strong>Hunter</strong> <strong>Water</strong> ensures that appropriate water quality monitoring and assessment iscompleted in response to water quality incidents should they occur. Sampling and analysisof affected, or potentially affected, areas of the water supply system is done as soon as anysituation is assessed with results required in the fastest possible turnaround time.Procedures for corrective actions in response to water quality monitoring non-conformancesare used to manage all such events and provide clear definitions of roles andresponsibilities, including any notification requirements.The water quality exception reporting procedures are centrally located on the <strong>Hunter</strong> <strong>Water</strong>intranet site. <strong>Hunter</strong> <strong>Water</strong> operations staff are trained in these procedures.<strong>Hunter</strong> <strong>Water</strong> has developed contingency and emergency response plans includingprocedures for response to water quality incidents. Simulated emergency managementexercises are conducted on a regular basis to ensure key staff familiarity with the requiredprotocols. <strong>Hunter</strong> <strong>Water</strong> has involved NSW Health in understanding the potential incidentsand emergencies and in developing response plans.www.hunterwater.com.au<strong>2012</strong>-<strong>13</strong> <strong>Annual</strong> <strong>Water</strong> <strong>Quality</strong> <strong>Monitoring</strong> <strong>Plan</strong> │ 17
7 Verification <strong>Monitoring</strong>7.1 Background“Verification of drinking water quality provides an assessment of the quality of drinkingwater being supplied to consumers. It incorporates monitoring drinking water quality inthe distribution system and assessing consumer satisfaction.Verification of drinking water quality provides an important link back to the operation ofthe water supply system and additional assurance that the preventive measures andtreatment barriers in the water supply system have worked, and are working, to supplysafe drinking water. This information helps in assessing long-term system performanceand identifying any trends or problems within the water supply system that may havegone unrecognised, and it provides confidence to consumers and regulators regardingthe quality of water supplied.”ADWG 2011 Section 9.5 p. 9.17Sections 9 and 10 of 2011 ADWG “Overview of <strong>Monitoring</strong> and <strong>Monitoring</strong> for SpecificCharacteristics in Drinking <strong>Water</strong>” provides guidance on drinking water quality verificationmonitoring. Routine water quality monitoring is proposed to be undertaken by <strong>Hunter</strong> <strong>Water</strong>during <strong>2012</strong>-<strong>13</strong> in line with ADWG recommendations.In addition to these routine samples <strong>Hunter</strong> <strong>Water</strong> will respond to specific water qualityincidents with additional sampling targeted to identify levels and extent of specific waterquality parameters as well as collecting data to identify trends.<strong>Hunter</strong> <strong>Water</strong> currently has sixty-eight (68) licence sample points located throughout thedistribution system for routine monitoring. The sample points are listed in Table 7 and thelocation of the points is shown on Attachment 1: <strong>Plan</strong> Showing <strong>Water</strong> <strong>Quality</strong> Sample Pointsand <strong>Water</strong> Supply Zones. The set of sampling points used for routine monitoring of waterquality have been selected to be representative of the distribution system as a whole.7.2 Sampling frequencyThe ADWG Table 9.4 (ADWG 2011, p.9.20) sets out the recommended sampling frequencyfor microbiological monitoring. The sampling frequency is determined based on thepopulation served. In assessing the number of samples to be collected, the water supplysystem is divided into monitoring zones as recommended in the ADWG outlined in Section9.5.2 (ADWG 2011, p 9.18).This effectively means that more samples are collected and analysed than would becollected if the number of samples was based on the total population.Table 7.1 details the population and number of samples required in each zone.18 │ <strong>2012</strong>-<strong>13</strong> <strong>Annual</strong> <strong>Water</strong> <strong>Quality</strong> <strong>Monitoring</strong> <strong>Plan</strong>www.hunterwater.com.au
Table 7.1 Populations and no. samples required in zonesZone Estimated 2011PopulationNo. of samples requiredper fortnight 2No. Samples perfortnight (shown intable 7.2 ) 3Grahamstown 373,855 26 36Chichester <strong>13</strong>2,832 14 18Lemon Tree Passage 7,651 3 6Nelson Bay / AnnaBay 25,20856Gresford 331 2 2Total 539,877 50 68The proposed 68 distribution system sample point locations is shown in Table 7.2.Table 7.2 Distribution System <strong>Water</strong> <strong>Quality</strong> Sample Points for <strong>2012</strong>-<strong>13</strong>No Sample Point 4 Zone1 Hamilton, 118 Lindsay Street Grahamstown2 Tighes Hill, 11 Kings Road Grahamstown3 Lambton, 23 Pride Avenue Grahamstown4 Adamstown, 12 Fletcher Street Grahamstown5 Georgetown, 3 Parkview Street Grahamstown6 Newcastle, 36 Honeysuckle Drive Grahamstown7 New Lambton, 39 Victoria Street Grahamstown8 Newcastle, 3 Parnell Place Grahamstown9 Hamilton, 179 Beaumont Street Grahamstown10 Merewether, 76 Rowan Crescent Grahamstown2 As set out in ADWG Table 9.4 (ADWG 2011, p.9.20)3 Note that fortnightly sampling is undertaken on a “week-about” basis, i.e. weekly sampling is undertaken4 The locations of the sample points are shown in Appendix A (<strong>Plan</strong> showing water quality sample points andwater supply zones)www.hunterwater.com.au<strong>2012</strong>-<strong>13</strong> <strong>Annual</strong> <strong>Water</strong> <strong>Quality</strong> <strong>Monitoring</strong> <strong>Plan</strong> │ 19
No Sample Point 4 Zone11 Birmingham Gardens, 149 Wilkins St Grahamstown12 Stockton, <strong>13</strong>0 Dunbar Street Grahamstown<strong>13</strong> Waratah West, 39 Parkhill Parade Grahamstown14 Old Raymond Terrace Office, 44 William St Grahamstown15 Medowie, 6 McDonald Close Grahamstown16 Rankin Park, 3 Sygna Close (Elermore Vale) Grahamstown17 Wangi, 8 Puna Road Grahamstown18 Belmont, 10 Kyneton Street Grahamstown19 Swansea, 7 Josephson Street Grahamstown20 Balcolyn, 11 Yarrawonga Road Grahamstown21 Warners Bay, 46 Jonathon Street Grahamstown22 Edgeworth, 7 Alana Close Grahamstown23 Mt Hutton, 32 Tennent Road Grahamstown24 Cardiff, 51 Wansbeck Valley Road Grahamstown25 Eleebana, 93 Gladgunson Drive Grahamstown26 Toronto, 17 Thorne Street Grahamstown27 Morisset, 7 Yambo Street Grahamstown28 Caves Beach, 14 Ocean View Grahamstown29 West Wallsend, 7 Wallace Street Grahamstown30 Redhead, 34 Hutchison Street Grahamstown31 Charlestown, 30 Milson Street Grahamstown32 Dudley, 101 Ocean Street Grahamstown33 Garden Suburbs, 15 Irvine Street Grahamstown34 Redhead, 37 Bentley Street Grahamstown35 Tingira Heights, 37 Walumbi Avenue Grahamstown36 Old Maitland Office, 262 High St Chichester37 Old East Maitland Depot, 118 Victoria St Chichester20 │ <strong>2012</strong>-<strong>13</strong> <strong>Annual</strong> <strong>Water</strong> <strong>Quality</strong> <strong>Monitoring</strong> <strong>Plan</strong>www.hunterwater.com.au
No Sample Point 4 Zone38 Thornton, 4 Bunbury Street Chichester39 Kurri, 91 Maitland Street Chichester40 Bellbird, 23 Fisher St Chichester41 Pelaw Main, 43 Evatt Street Chichester42 Cessnock, 10 Cumberland Street Chichester43 Heddon Greta, 30 Cooper Street Chichester44 Metford, 19 Stradbroke Avenue Chichester45 Tarro, 9 Aldwick Street Chichester46 Rutherford, 5 Thompson Street Chichester47 Branxton, 25 Bridge Street Chichester48 Tanilba Bay, 44 Clemenceu Street Lemon Tree Passage49 Karuah, Lot 5B Pacific Hwy (=6 Tarean Rd) Lemon Tree Passage50 Nelson Bay, 32 Fingal St Nelson Bay / Anna Bay51 Fingal Bay, 21 Lentara Street Nelson Bay / Anna Bay52 Soldiers Point, 15 Sunset Blde Nelson Bay / Anna Bay53 Boat Harbour, 10 Andrew Close Nelson Bay / Anna Bay54 Maryland, 19 Faulkland Crescent Grahamstown55 Anna Bay, 14 Campbell Ave Nelson Bay / Anna Bay56 Shoal Bay 84 Rigney St Nelson Bay / Anna Bay57 Lemon Tree Passage 45 Gould Drive Lemon Tree Passage58 Seaham, 54 Warren St Chichester59 Lemon Tree Passage, 76 Francis Ave Lemon Tree Passage60 Lemon Tree Passage, 22 Geer Cl Lemon Tree Passage61 Tanilba Bay, 109 Diggers Dr Lemon Tree Passage62 71 Park St Gresford Gresford63 5 Short St Gresford Gresford64 Paterson Pre School (Gresford Road) Chichester65 Vacy Public School (Webbers Creek Road) Chichesterwww.hunterwater.com.au<strong>2012</strong>-<strong>13</strong> <strong>Annual</strong> <strong>Water</strong> <strong>Quality</strong> <strong>Monitoring</strong> <strong>Plan</strong> │ 21
No Sample Point 4 Zone66 9 Melbee Cr Dungog Chichester67 90 Fosterton St Dungog Chichester68 Clarence Town Caravan Park Chichester7.3 Assessing compliance on verification monitoring7.3.1 Assessing verification compliance for Chichester, Grahamstown,Lemon Tree Passage and Anna Bay/Nelson Bay water supplysystemsAssessing performance for compliance purposes will be carried out on a corporate andwater quality zone basis for <strong>2012</strong>-<strong>13</strong> for key parameters using the assessment methodsspecified in the ADWG for microbiological, physical and chemical parameters respectively.Zones are based on areas supplied by <strong>Water</strong> Treatment <strong>Plan</strong>ts.Key parameters and criteria used to assess drinking water quality compliance for <strong>2012</strong>-<strong>13</strong>for Chichester, Grahamstown, Lemon Tree Passage and Anna Bay/Nelson Bay zones areshown in Table 7.3.22 │ <strong>2012</strong>-<strong>13</strong> <strong>Annual</strong> <strong>Water</strong> <strong>Quality</strong> <strong>Monitoring</strong> <strong>Plan</strong>www.hunterwater.com.au
Table 7.3 Key parameters and criteria used to assess drinking water qualitycompliance for <strong>2012</strong>-<strong>13</strong> – Chichester, Grahamstown, Lemon Tree Passageand Anna Bay/Nelson Bay zones.ParameterMicrobiological/ Physical /ChemicalHealth-Related orAestheticGuideline ValueMethod ofAssessingCompliance 5E. coli Microbiological Health From Table 10.1 2011 ADWG Performance measure forEscherichia coli within the distribution system• Escherichia coli (E. coli) should not be detected in aminimum 100mL sample of drinking water.At least 98% ofscheduled samplescontain < 1 MPN per100 ml• If detected, immediate corrective action must betakenFrom Section 10.3.1 2011 ADWG Assessing Long termperformance:“A long-term target for E. coli may be determined inconsultation with the relevant health regulator.”A long term target that:At least 98% of scheduled samples contain < 1 MPNper 100 ml over a period of 12 monthshas been determined in consultation with NSW Health.pH Physical Aesthetic 6.5 to 9.2 The upper bound ofthe 95% confidenceTrue colour Physical Aesthetic < 25 HUinterval for the meanshould be less thanTurbidity Physical Aesthetic < 5 NTUthe guideline valueAluminium Chemical Aesthetic < 0.2 mg/LIron Chemical Aesthetic < 0.3 mg/LZinc Chemical Aesthetic < 3 mg/LChlorine Chemical Health < 5 mg/L The upper bound ofthe 95% confidenceCopper Chemical Health < 1 mg/Linterval for the 95 thpercentile should beLead Chemical Health < 0.01 mg/Lless than theguideline valueManganese Chemical Health < 0.1 mg/LTrihalomethanesChemical Health
7.3.2 Assessing verification monitoring compliance for Gresford watersupply systemThe ADWG 2011 (Section 9.11 p 9.29) advise that:“In general, drinking water quality monitoring of small water supplies should be basedon the principle that it is much more effective to test for a narrow range of keycharacteristics as frequently as possible, than to conduct comprehensive but lengthy(and possibly largely irrelevant) range of analyses less often.Key characteristics to be monitored as part of drinking water quality monitoringshould include those with the potential to present significant risks and for whichreliable verification of safety is required.”In line with this recommendation, key parameters and criteria used to assess drinking waterquality for compliance purposed for Gresford zone during <strong>2012</strong>-<strong>13</strong> are in Table 7.4.24 │ <strong>2012</strong>-<strong>13</strong> <strong>Annual</strong> <strong>Water</strong> <strong>Quality</strong> <strong>Monitoring</strong> <strong>Plan</strong>www.hunterwater.com.au
Table 7.4 Key parameters and criteria to be used to assess drinking water qualitycompliance for Gresford zone for <strong>2012</strong>-<strong>13</strong>Parameter Microbiological /Physical /ChemicalHealth-Related orAestheticGuideline ValueMethod of AssessingCompliance*E. coli Microbiological Health From Table 10.1 2011 ADWGPerformance measure forEscherichia coli within thedistribution system• Escherichia coli (E. coli)should not be detected in aminimum 100mL sample ofdrinking water.At least 98% ofscheduled samplescontain < 1 MPN per100 ml• If detected, immediatecorrective action must betakenFrom Section 10.3.1 2011 ADWGAssessing Long termperformance:“A long-term target for E. coli maybe determined in consultation withthe relevant health regulator.”A long term target that:At least 98% of scheduledsamples contain < 1 MPN per100 ml over a period of 12monthshas been determined inconsultation with NSW Health.pHTurbidityPhysicalAesthetic6.5 to 9.2 The upper bound of the95% confidenceinterval for the mean< 5 NTUshould be less than theguideline valueChlorineChemicalHealth< 5 mg/L The upper bound of the95% confidenceinterval for the 95 thpercentile should beless than the guidelinevalue<strong>2012</strong>-<strong>13</strong> <strong>Annual</strong> <strong>Water</strong> <strong>Quality</strong> <strong>Monitoring</strong> <strong>Plan</strong> │ 25www.hunterwater.com.au
7.4 Comprehensive program for sampling and analysisA comprehensive program of sampling and analysis for health and aesthetic water qualityparameters is proposed to be undertaken:• in raw waters (as detailed in section 3);• in treated waters at water treatment plants; and• within the distribution system.The number of sampling locations and frequency of sampling for parameters to be tested areshown in tables 3.1, 3.2, 7.5, 7.6, 7.7 and 7.8 for raw, treated and distribution systemmonitoring.7.4.1 Treated <strong>Water</strong> – Chichester, Grahamstown, Lemon tree Passage andNelson Bay/Anna Bay ZonesOperators attend Dungog, Grahamstown, Lemon Tree Passage, Anna Bay and Nelson Bayeach day. The plants are telemetered and monitored for key water quality parameters.Table 7.5 Routine Drinking <strong>Water</strong> <strong>Monitoring</strong> Parameters Treated <strong>Water</strong> – Chichester,Grahamstown, Lemon tree Passage and Nelson Bay/Anna Bay ZonesParameter Frequency No. of locations Analysis by:pH Daily and on-line 5 HWA <strong>Water</strong> TreatmentTurbidity Daily and on-line 5 HWA <strong>Water</strong> TreatmentTrue Colour Daily 5 HWA <strong>Water</strong> TreatmentHardness Monthly 5 HWATotal Dissolved Solids Quarterly 5 HWAFluoride Daily and on-line 5 HWA <strong>Water</strong> TreatmentIronManganeseDaily atGrahamstown,Dungog andLemon TreePassage, Weeklyat Anna Bay andNelson Bay5HWA <strong>Water</strong> TreatmentAluminium Weekly 5 HWA <strong>Water</strong> TreatmentChlorine Daily and online 5 HWA <strong>Water</strong> Treatment26 │ <strong>2012</strong>-<strong>13</strong> <strong>Annual</strong> <strong>Water</strong> <strong>Quality</strong> <strong>Monitoring</strong> <strong>Plan</strong>www.hunterwater.com.au
Parameter Frequency No. of locations Analysis by:Particle CountOn-LineGrahamstownand DungogHWA <strong>Water</strong> TreatmentCryptosporidiumAnalysis isroutinelyundertakenquarterly fortreated surfacewaters.GiardiaNote that treatedwater samples aretaken for allsources at samefrequency as forraw waters.Analysis isundertaken ifCryptosporidium orGiardia is detectedin correspondingraw water.Grahamstownand DungogHWAHeterotrophic Plate Count Weekly 5 HWAE. coli Weekly 5 HWATotal Coliforms Weekly 5 HWAFree Ammonia Monthly 5 HWANitrites Monthly 5 HWANitrates Monthly 5 HWACyanide Quarterly 5 ALSSulphide Quarterly 5 HWAIodide Quarterly 5 AWQCAntimony Quarterly 5 HWAAluminium Quarterly 5 HWAArsenic Quarterly 5 HWABarium Quarterly 5 HWABeryllium Quarterly 5 HWABoron Quarterly 5 ALSwww.hunterwater.com.au<strong>2012</strong>-<strong>13</strong> <strong>Annual</strong> <strong>Water</strong> <strong>Quality</strong> <strong>Monitoring</strong> <strong>Plan</strong> │ 27
Parameter Frequency No. of locations Analysis by:Cadmium Quarterly 5 HWACalcium Monthly 5 HWAChloride Quarterly 5 HWAChromium Quarterly 5 HWACopper Quarterly 5 HWALead Quarterly 5 HWAMagnesium Monthly 5 HWAMolybdenum Quarterly 5 HWAMercury Quarterly 5 HWANickel Quarterly 5 HWASelenium Quarterly 5 HWASilver Quarterly 5 HWASodium Quarterly 5 HWASulphate Quarterly 5 HWAZinc Quarterly 5 HWA7.4.2 Gresford <strong>Water</strong> Treatment <strong>Plan</strong>t (WTP)An operator attends Gresford <strong>Water</strong> Treatment plant three times a week. The plant istelemetered, with on-line monitoring and appropriate alarms set for pH, turbidity andchlorine.Routine water quality monitoring for the Gresford WTP is shown in Table 7.6.Table 7.6 Routine drinking water monitoring parameters for Gresford WTP treatedwaterParameter Frequency No. of Locations Analysis byE.coli Weekly 1 (CWT) HWA LaboratoriesTotal Coliforms Weekly 1 (CWT) HWA LaboratoriespH3 times a week and online1 (CWT) HWA <strong>Water</strong> Treatment28 │ <strong>2012</strong>-<strong>13</strong> <strong>Annual</strong> <strong>Water</strong> <strong>Quality</strong> <strong>Monitoring</strong> <strong>Plan</strong>www.hunterwater.com.au
Parameter Frequency No. oflocationsAnalysis by:Conductivity Fortnightly 66 HWATemperature Monthly 15 HWADissolved Oxygen Monthly 15 HWATrue Colour Monthly 15 HWAAluminium Total Fortnightly at 8 locations /Weekly at 6 locations8 / 6 HWAAluminium Soluble 8 / 6 HWALead Monthly 15 HWACopper Monthly 15 HWAZinc Monthly 15 HWATrihalomethanes Monthly 9 LabmarkAmmonia Monthly 16 HWASulphide Monthly 16 HWANitrates Monthly 16 HWANitrites Monthly 16 HWAAntimony Quarterly 15 HWACadmium Quarterly 15 HWANickel Quarterly 15 HWAChromium Quarterly 15 HWAAsbestos <strong>Annual</strong>ly 16 AdelaideMicroscopyCyanide <strong>Annual</strong>ly 16 ALSBenzo-(a)-pyrene <strong>Annual</strong>ly 5 SGSToluene Once every five years 9 ARLXylene Once every five years 9 ARL30 │ <strong>2012</strong>-<strong>13</strong> <strong>Annual</strong> <strong>Water</strong> <strong>Quality</strong> <strong>Monitoring</strong> <strong>Plan</strong>www.hunterwater.com.au
Parameter Frequency No. oflocationsAnalysis by:PlasticisersDi(2-etylhexyl)phthalateDi(2-etylhexyl)adipateOnce every five years 9 ARL7.4.4 Gresford distribution system<strong>Hunter</strong> <strong>Water</strong> undertakes the following routine verification monitoring within the distributionsystem at Gresford as shown in Table 7.8.www.hunterwater.com.au<strong>2012</strong>-<strong>13</strong> <strong>Annual</strong> <strong>Water</strong> <strong>Quality</strong> <strong>Monitoring</strong> <strong>Plan</strong> │ 31
Table 7.8 Routine Analysis Distribution System – Sample Points at Customers’ <strong>Water</strong>Services – GresfordParameterTotal ColiformsFrequencyFortnightlyE. coli FortnightlyFree ChlorinepHTurbidityTotal Dissolved Solids (TDS)AntimonyArsenicBariumBoronCadmiumCalciumChlorideChromiumCopperFluorideIodideIronLeadMagnesiumManganeseMercuryMolybdenumNickelNitrateNitriteSeleniumFortnightlyFortnightlyFortnightlySix-monthlySix-monthlySix-monthlySix-monthlySix-monthlySix-monthlySix-monthlySix-monthlySix-monthlySix-monthlySix-monthlySix-monthlySix-monthlySix-monthlySix-monthlySix-monthlySix-monthlySix-monthlySix-monthlySix-monthlySix-monthlySix-monthly32 │ <strong>2012</strong>-<strong>13</strong> <strong>Annual</strong> <strong>Water</strong> <strong>Quality</strong> <strong>Monitoring</strong> <strong>Plan</strong>www.hunterwater.com.au
ParameterSilverSodiumSulfateTotal Hardness as CaCO3ZincFrequencySix-monthlySix-monthlySix-monthlySix-monthlySix-monthly7.5 Laboratory testing and reporting processes7.5.1 <strong>Quality</strong> assuranceIndependently accredited testing methods and a NATA accredited laboratory, operating withNATA accredited methods are used for all parameters for verification monitoring (with twoexceptions 7 ). <strong>Hunter</strong> <strong>Water</strong> ensures that testing methods used for verification monitoringhave the required sensitivity and that samples are taken in a manner necessary to ensure nocontamination or degradation of the samples.Sampling and analysis for drinking water quality compliance is arranged by <strong>Hunter</strong> <strong>Water</strong>Australia Laboratories (HWAL). Sampling is undertaken in compliance with NATAaccreditation to ensure a representative sample is taken. Analysis for some parameters isoutsourced to other laboratories by HWAL. NATA accredited laboratories used foroutsources analysis include Australian Laboratory Services (ALS), Australian GovernmentAnalytical Laboratories (AGAL), Labmark, Analytical Reference Laboratory (ARL) and theAustralian <strong>Water</strong> <strong>Quality</strong> Centre (AWQC).Analysis for operational purposes is undertaken by <strong>Hunter</strong> <strong>Water</strong> Australia Process andOperations (HWAPO) and is not NATA accredited. However, an appropriate system ofquality assurance is used for this analysis7.5.2 Data verification and record keepingHWA Labs have QA systems in place for data verification and record keeping. All originalrecords are kept for a minimum of five years. Checks are undertaken on transfer of datafrom one system to another. Verification by a senior officer is required for results which areoutside of “normal” range. Laboratory data is stored on a Laboratory InformationManagement System (LIMS). This data is copied to <strong>Hunter</strong> <strong>Water</strong>’s data warehouse. Datamay be extracted for reporting purposes and trend analysis, either directly from the LIMS, orfrom the data warehouse.7 Except for asbestos and radiological analysis. NATA accreditation for these parameters is not available inAustralia. Analysis for these parameters is undertaken using quality-assured procedures, which have beenreviewed and found to be satisfactory by <strong>Hunter</strong> <strong>Water</strong>.www.hunterwater.com.au<strong>2012</strong>-<strong>13</strong> <strong>Annual</strong> <strong>Water</strong> <strong>Quality</strong> <strong>Monitoring</strong> <strong>Plan</strong> │ 33
Definitions, Acronyms, and AbbreviationsADWGAGALAestheticGuideline ValuesALSANSTOARLAWQCCWTDALDrinking <strong>Water</strong>FrameworkHealth-relatedGuideline ValuesHWAHWA <strong>Water</strong>TreatmentIPARTMOUNATANHMRCNRMMCNSW HealthNational Health and Medical Research Council (NHMRC) and Natural ResourceManagement Ministerial Council (NRMMC) 2011 Australian Drinking <strong>Water</strong>GuidelinesAustralian Government Analytical Laboratories (Sydney)Aesthetic Guideline Values are contained in the Australian Drinking <strong>Water</strong>Guidelines and mean the concentration or measure of a water qualitycharacteristic (a physical property of the water or a chemical) that is associatedwith good quality water.Australian Laboratory Services (Sydney)Australian Nuclear Science and Technology Organisation (Lucas Heights)Analytical Reference Laboratory (WA)Australian <strong>Water</strong> <strong>Quality</strong> Centre (SA)Clear <strong>Water</strong> TankDivision of Analytical LaboratoriesDrinking <strong>Water</strong> means water that, (following water treatment to the standard foruse as drinking water specified in the Australian Drinking <strong>Water</strong> Guidelines), issupplied via the <strong>Water</strong> Supply System primarily for human consumption but whichhas other personal, domestic or household uses such as bathing and showering.Framework for Management of Drinking <strong>Water</strong> <strong>Quality</strong>Health-related Guideline Values are contained in the Australian Drinking <strong>Water</strong>Guidelines and mean the concentration or measure of a water qualitycharacteristic, based on present knowledge that does not result in any significantrisk to the health of the consumer over a lifetime of consumption.<strong>Hunter</strong> <strong>Water</strong> Australia (HWA) is a fully owned subsidiary of HWC. HWA operatesall HWC’s water treatment plants, and undertakes Laboratory services for HWC.<strong>Hunter</strong> <strong>Water</strong> Australia Process and Operations i.e. analysis is carried out at<strong>Water</strong> Treatment <strong>Plan</strong>tsIndependent Pricing and Regulatory TribunalMemorandum of Understanding between <strong>Hunter</strong> <strong>Water</strong> and NSW HealthNational Association of Testing AuthoritiesNational Health and Medical Research CouncilNatural Resource Management Ministerial Council<strong>Hunter</strong> New England Local Health District and the New South Wales Ministry ofHealth34 │ <strong>2012</strong>-<strong>13</strong> <strong>Annual</strong> <strong>Water</strong> <strong>Quality</strong> <strong>Monitoring</strong> <strong>Plan</strong>www.hunterwater.com.au
OperatingLicencePLCRWTSCADASGSWTP<strong>Hunter</strong> <strong>Water</strong> Corporation Operating Licence is granted by the State Governmentand administered by the Independent Pricing and Regulatory Tribunal (IPART).The operating licence is the major customer protection instrument and prescribesstandards of service that must be met in relation to water quality, continuity,pressure and wastewater transportation.Programmable Logic ControllerRaw <strong>Water</strong> TankSupervisory Control and Data AcquisitionSGS Laboratories Melbourne<strong>Water</strong> Treatment <strong>Plan</strong>t<strong>2012</strong>-<strong>13</strong> <strong>Annual</strong> <strong>Water</strong> <strong>Quality</strong> <strong>Monitoring</strong> <strong>Plan</strong> │ 35www.hunterwater.com.au
ReferencesRizak S and Hrudey SE, 2007 Strategic <strong>Water</strong> <strong>Quality</strong> <strong>Monitoring</strong> for Drinking <strong>Water</strong> Safety.Cooperative Research Centre for <strong>Water</strong> <strong>Quality</strong> and Treatment Research Report No 37.http://www.wqra.com.au/publications/report37_strategic_water_monitoring.pdf2011 Australian Drinking <strong>Water</strong> GuidelinesNational Health and Medical Research Council (NHMRC) and Natural ResourceManagement Ministerial Council (NRMMC)http://www.nhmrc.gov.au/guidelines/publications/eh52<strong>Hunter</strong> <strong>Water</strong> Corporation Operating Licence 2007-<strong>2012</strong>http://www.hunterwater.com.au/files/HWC_Operating_Licence__190607.pdf36 │ <strong>2012</strong>-<strong>13</strong> <strong>Annual</strong> <strong>Water</strong> <strong>Quality</strong> <strong>Monitoring</strong> <strong>Plan</strong>www.hunterwater.com.au
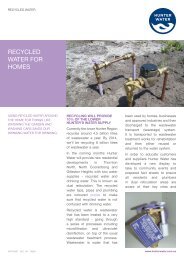
Appendix A – <strong>Water</strong> quality sample points and water supply zoneswww.hunterwater.com.au<strong>2012</strong>-<strong>13</strong> <strong>Annual</strong> <strong>Water</strong> <strong>Quality</strong> <strong>Monitoring</strong> <strong>Plan</strong> │ 37
DRINKING WATER QUALITY LICENCESEE INSERT ASAMPLE POINTS AS OF JULY 2008No.Sample Point651 HAMILTON2 TIGHES HILL3 LAMBTON684 ADAMSTOWN5 GEORGETOWN6HWC HEAD OFFICE647NEW LAMBTON8 NEWCASTLE9 HAMILTON10 MEREWETHER11 BIRMINGHAM GARDENS12 STOCKTON47 4958<strong>13</strong> WARATAH WEST14OLD RAYMOND TERRACE OFFICE15 MEDOWIE16RANKIN PARK17 WANGI WANGI18 BELMONT19 SWANSEA4636GRAHAMSTOWN1548PORT STEPHENS6159605752NELSON BAY WTP50BAYANNA565120 BALCOLYN21 WARNERS BAY22 EDGEWORTH23 Mt.HUTTON24CARDIFF37443814DAMTOMAGOSANDBEDSLEMON TREEPASSAGE WTP55SANDBEDSANNA BAY WTP5325 ELEEBANA26 TORONTO27 MORISSET28 CAVES BEACH29 WEST WALLSEND4239414345GRAHAMSTOWNWTPTOMAGO 1 & 2WTPFULLERTONCOVE30 REDHEAD31 CHARLESTOWN4032 DUDLEY33 GARDEN SUBURBS5434 REDHEAD35TINGIRA HTS36MAITLAND37OLD EAST MAITLAND DEPOT38 THORNTON39 KURRI KURRI40BELLBIRD292224111633<strong>13</strong>374521910126 8CHICHESTER DAM41 PELAW MAIN31SOUTH42 CESSNOCK43 HEDDON GRETA44 METFORD233245 TARRO46 RUTHERFORD2625 21 353447 BRANXTON48 TANILBA BAY1830PACIFIC49KARUAH50NELSON BAY51 FINGAL BAYLAKE52 SOLDIERS POINT53BOAT HARBOUR54MARYLAND17MACQUARIE19OCEAN6755565758ANNA BAYSHOAL BAYLEMON TREE PASSAGESEAHAM2720286362DUNGOG WTP6659606162636465666768LEMON TREE PASSAGELEMON TREE PASSAGETANILBA BAYGRESFORDGRESFORDPATERSON PRE-SCHOOLVACY PUBLIC SCHOOLDUNGOGDUNGOGCLARENCE TOWNGRESFORD WTPINSERT ANDISCLAIMER<strong>Hunter</strong> <strong>Water</strong> Corporation, their subsidiaries or agents acceptsno responsibility for any errors, omissions or inaccuracieswhatsoever contained within or arising from this map.Verification of the information shown should be obtained byCHICHESTERLEGENDSWIMS GROUPPLAN SHOWINGWATER QUALITY SAMPLING POINTS AND WATER SUPPLY ZONESWEan appropriately qualified person(s).Date of Aerial Photograhy 1998CCadastral/Contour/Aerial PhotographyData L.P.I. 20<strong>13</strong>GRAHAMSTOWNNELSON BAY / ANNA BAYWATER QUALITY SAMPLE POINTWATERSUPPLY NETWORKA Division of <strong>Hunter</strong> <strong>Water</strong> Australia Pty. Ltd.ABN 19 080 869 90536 Honeysuckle Drive Newcastle West 2302<strong>Quality</strong>EndorsedFOR NEWCASTLE, LAKE MACQUARIE, MAITLAND,CESSNOCK, PORT STEPHENS AND DUNGOG AREA.SDATUM GDA94MGA ZONE 56CSewer/<strong>Water</strong> Data H.W.C.20<strong>13</strong>This map is not to be reproduced without prior consent.LEMON TREE PASSAGEGRESFORDWATER TREATMENT PLANT<strong>Hunter</strong> <strong>Water</strong> AustraliaPO BOX 5007 HRMC 2310Ph (02) 4907 7000Fax (02) 4907 7020CompanyISO 9001 Lic QEC12424Standards AustraliaScale: 307682.92619:1Drawn:palmieridDate: 14-MAR-20<strong>13</strong>Checked: A.R.LargeFilename: 1938-6687-<strong>Water</strong>-<strong>Quality</strong>-Sample-Points3.dgnPentable:1938-6687-wqsp.penA1