Chet Balder Vice President Ardmin Properties Real ... - Live Out Loud
Chet Balder Vice President Ardmin Properties Real ... - Live Out Loud
Chet Balder Vice President Ardmin Properties Real ... - Live Out Loud

You also want an ePaper? Increase the reach of your titles
YUMPU automatically turns print PDFs into web optimized ePapers that Google loves.
<strong>Chet</strong> <strong>Balder</strong><strong>Vice</strong> <strong>President</strong><strong>Ardmin</strong> <strong>Properties</strong><strong>Real</strong> Estate Investment Group:Fundamentals in BusinessA look at the past and the present
Imagine• Imagine…Going back to college• Imagine…Going back to your first job• Imagine…Buying your first house• Imagine…knowing key buying opportunities
Stock Chart
Market Cycle QuadrantsPhase I - ExpansionPhase II - Hypersupply• Declining Vacancy• New Construction• Rents Rise Rapidly• Property Values RiseEquilibrium• Increasing Vacancy• New Construction• Rent Growth Declines• Property Values LevelLong TermOccupancy AverageNew Construction RentsEqual Existing RentsPhase IV- RecoveryPhase III - Recession• Declining Vacancy• No New Construction• Below Inflation Rental Growth• Property Values Level• Increasing Vacancy• No New Construction• Negative Rental Growth• Property Values Decline
Agenda• Going Back in Time…<strong>Ardmin</strong> <strong>Properties</strong>• Business & <strong>Real</strong> Estate• Opportunities in today’s Economy• How to Invest – Active or Passive?• Case Study• Questions
ARDMIN…..It All Started With A DinnerNo No Joe….Why would someoneinvest in <strong>Real</strong> Estate when the StockMarket is giving 20% Returns?ARDMIN Planning Meeting 2000…….An Idea Is Born
<strong>Ardmin</strong> <strong>Properties</strong>• First <strong>Real</strong> Estate Syndication in 2003• Market at its bottom…2 years after 9/11/2001• Bought Fox Lake Town Center 2003 LLC– Bought at $50 psf…– Talked movie theater into expanding in unusable space– Build out new Retail• Cash Flow and Refinance 143% of investment• Still have 137% of money left in the property
What is the market going to do?• This is a low…markets will go UP!• What have you done to take advantage ofthis huge buying opportunity?• Have you been looking at newbusinesses/investments?• If now is not the time to buy, I have neverseen a buying opportunity!!!
The Time is NOW!• We are at a time that investors wait adecade or more for!• What is the best 5 run for Stockperformance?– 1995 to 2000• 23%• 25%• 40%
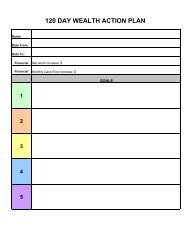
Have a Business Plan• Mission Statement• The Team• Market Summary• Opportunities• Business Concept• Competition• Goals & Objectives• Financial Plan• Resource Requirements• Risks & Rewards• Key IssuesGross Sales / Income- Expenses= Profit
What have you change in your businesswith the new economy?• Evaluate Expenses– Negotiate contracts lower– Form you new businesses to reduce costs– Form JV partnerships to reduce costs• Change Vendors– Non performing Vendors– Require more work for the same pay• Change Personal– Reduce staff– Trade staff up – more qualified people for less money• New sources of revenue– All companies are evaluating bottom line NOW.– Change of direction from the old economy• New Business Plan• Evaluate the new profit margin• Know what you are best in class in• Buy Your competitors
What are your expect Returns?• For your investments?• For your business?• What is your risk tolerance?• What assumptions are you using?– When will the economy recover?• How to measure this?• What variables need to change?• What Are your Money Rules?
Valuation of Business / Investment• Profit to Earnings Ration (PE)– Gross Sales– EBIT• Multiplier on Gross Sales• Multiplier on Gross Profit• Property Value – NOI/CAP Rate• Sales Comparisons
Value of the Hard Assets• Business– Hard Assets– Current Profitability– Future Growth Expected– Need to buy/sell• <strong>Real</strong> Estate– Hard Assets– Current Profitability– Future Growth Expected– Need to buy / sell
Commercial Property• DEFINITION: Business property, suchas an office building, retail stores,medical center or hotel that operateswith a profit. A risk/return relationshipexists in commercial property. Thereturn is comprised of the net rentalincome, capital appreciation in priceand tax savings.
Risk Elements of <strong>Real</strong> Estate• Leverage– In a good economy• Makes investments grow faster– In a negative economy• Makes investments reduce faster– In either, if cash flow is produced, buy definition, it is lower risk• Inflation Hedge– <strong>Real</strong> Estate rises with the price of inflation– Leveraged property raises cash on cash value faster• Changes is economy– Good economy• Increasing Rents– In a negative economy• Decreasing rents• Effectiveness in Property Management– Lease Rates– Length of Leases– Concession of Improvements, rent or abatement– Expense controls
Risk In Investments• Treasury Bill• State Bonds• City Bonds• <strong>Real</strong> Estate Bonds• Coprorate Bonds• <strong>Real</strong> Estate• Mutual Funds / Stock Indexes• Individual Stocks• Private Companies• Start up companies
<strong>Real</strong> Estate Characteristics• Type– Industrial– Hotel– Mixed-Use– Multi-Family– Office– Retail– Raw Land– Single family• Location– Urban– Suburban– Rural• Phase– Hold Land– New Construction– Stabilized– Renovation
Elements That Drive Returnsfor <strong>Real</strong> Estate1. Cash flow• 0% - 15 %2. Debt Reduction• 0% - 5%3. Appreciation• 0% - 100%4. Tax Savings (Cost Segregation)• 0% - 15%ANNUAL RETURN0%10%14%24%29%
Evaluating An InvestmentNet Operating Income (NOI)– Definition: Gross income of a rental property minus allowances and operatingexpenses, excluding depreciation and debt service.– Formula [ NOI = GROSS INCOME – TOTAL OPERATING EXPENSES]CAPitalization Rate (CAP RATE)– Definition: A calculation of the performance of the income potential from aproperty– Derived From:• Product Type Specific• Impacted by location and condition of product• Market Driven– Formula [CAP = NOI/PROPERTY VALUE]– Formula [PROPERTY VALUE = NOI/CAP]EXAMPLE: $1,000,000 = $100,000/10%($200,000 Investment)$1,100,000 = $110,000 /10% (50% ROI)$1,111,111 = $100,000 /9% (55% ROI)
Tools To Compare Investments• Average Annual Return (AAR)– Total Return divided by the number of years of the deal.– Five years – 100% Total Return– Average Annual Return – 20%• Internal Rate of Return (IRR)– The IRR is the annualized effective compounded return ratewhich can be earned on the invested capital, i.e. the yield onthe investment.– A mathematical formulation to take into account the timevalue of money. Also used to value two or more unlikeinvestments.– Assumption is that as cash flow comes out, it is invested in anew investment at the same rate.
Evaluate The Following Investments<strong>Real</strong> Estate InvestmentYEAR 1 YEAR 2 YEAR 3 YEAR 4 YEAR 5 YEAR 6 YEAR 7 YEAR 8 YEAR 9 YEAR 10CASH FLOWS $987 $1,385 $1,546 $951 $1,518 $1,238 $1,959 $2,002 $1,480 $18,644Return ON+OF ($10,000) $987 $1,385 $1,546 $951 $1,518 $1,238 $1,959 $2,002 $1,480 $28,644InvestmentIRR= 20.15%Money Market 20% InterestAVG ANN RETURN= 31.71% $3,171 INITIAL INVESTMENT NOT INCLUDEDCASH FLOWS $2,015 $2,015 $2,015 $2,015 $2,015 $2,015 $2,015 $2,015 $2,015 $2,015Return ON+OF ($10,000) $2,015 $2,015 $2,015 $2,015 $2,015 $2,015 $2,015 $2,015 $2,015 $12,015InvestmentIRR= 20.15%AVG ANN RETURN= 20.15% $2,015 INITIAL INVESTMENT NOT INCLUDEDUtility Stock 14% Dividend + 161% GrowthCASH FLOWS $1,400 $1,400 $1,400 $1,400 $1,400 $1,400 $1,400 $1,400 $1,400 $17,500Return ON+OF ($10,000) $1,400 $1,400 $1,400 $1,400 $1,400 $1,400 $1,400 $1,400 $1,400 $27,500InvestmentIRR= 20.15%AVG ANN RETURN= 30.10% $3,010 INITIAL INVESTMENT NOT INCLUDEDGrowth Stock 0% Dividend + 527% GrowthCASH FLOWS $- $- $- $- $- $- $- $- $- $52,700Return ON+OF ($10,000) $- $- $- $- $- $- $- $- $- $62,700InvestmentIRR= 20.15%AVG ANN RETURN= 52.70% $5,270 INITIAL INVESTMENT NOT INCLUDED
<strong>Ardmin</strong> <strong>Properties</strong><strong>Real</strong> Estate Investment GroupWhat do you look for in today’sEnvironment?
Today’s Environment:• Lending– Difficult to get a Loan– Higher Loan to Value– Personal Guarantees– More reserves needed– Higher Vacancy– Not as many Lenders• Recession– Higher CAP rates– Some people need to sell• Institutions• Groups• Individuals– Selling property to fundother debt– Not as many buyers– Slower paying rent– More vacancy– When is the market turnaround? 1 year? 3 Years?
Economy IssuesCommercial <strong>Real</strong> Estate?NOI CAP Rate Value$ 1,200,000.00 6.00% $ 20,000,000.00LTV 90.00% $ 18,000,000.00Equity 10.00% $ 2,000,000.00NOI CAP Rate Value$ 1,200,000.00 7.00% $ 17,142,857.14LTV 75.00% $ 12,857,142.86Equity 25.00% $ 4,285,714.29
Two Ways to make Money:• Passive–Who is my Partner?–What is the Deal?–How is it Structured?• Active– Who do we need toPartner with?– What Deal do we wantto create?–How do we Structurethe deal?Money working forthemWorking for their money
Active Investor:Summary• Build with Partners• Create your Deal• Define the StructureCommercial real-estate investing takes afulltime commitment with specializedprofessionals.
Passive Investor:Summary• Confirm the Partners• Understand the Deal• Verify the StructureAll investments come with risk. Understandthese risks that realize the opportunity.
<strong>Ardmin</strong> <strong>Properties</strong><strong>Real</strong> Estate Investment GroupRunning your own Business
WAUKEGAN PROFESSIONAL BUILDING 2009 LLC
The DealProposition: Buy the lowest risk deal we havepurchased to date:89% occupiedBuy at a 10%- 11% Cap RateProjected 25% Average ReturnsFilled with all Physicians & LawyerExit Strategy: Sell building as the market stabilizesin 1-3 yearsSell at a 8.75% Cap RateLook to lease up basement with Storage
The Property• 30 miles North of Chicago• Waukegan, IL• 28,000 square foot• 100% occupancy
Cash Flow ProjectionsClass A$10,000 INVESTMENT2009 FY 2010 FY$772 $1,0397.72% 10.39%2011 FY$16,442164.42%Investor Class AInternal Rate of Return 23.65%Average Annual Return 27.51%Total Investment Return $182.53%Minimum Investment $50,000Property Participation Incentive 15%* Projections are not guaranteed
A Detailed Look at the Numbers• Purchase Price: $ 3,100,000• Building Area: 30,049 square foot (7,500 sf Basement)• Current Vacancy: 11%• Lease Type: 2-5 year leases• Number Of Units: 15 current tenants…All physicians and lawyers• NOI:Fiscal Year 1 $ 296,160.00Fiscal Year 2 $ 329,887.00Fiscal Year 3 $ 341,341.00• Projected Sale Price: $ 3,901,041• Projected Hold Period: 1-3 years• Projected AAR: 27% Annually• Projected IRR: 24%• Projected 1 st year Cash Flow: Over 7%• Investment Offering: $ 501,500 requried to close• Financing Approved: $ 2,170,000 from a bank 70% LTV
Legal StructureARDMININVESTMENTCLASS “A”INVESTORCLASS “B”INVESTORWaukegan ProfessionalBuilding 2009LLCARDMIN PROPERTIESMANAGEMENTGROUP INC.
Expectations for theWaukegan PropertyNOI$341.341CAP Rate11%Property Value$3,100,000$341.341$341.3419%8%$3,792,677$4,266,762Two ways to increase the NOI– Decrease Expenses– Increase the Rent
Imagine• Imagine…Going back to college• Imagine…Going back to your first job• Imagine…Buying your first house• Imagine…knowing key buyingopportunities
Questions & Answers<strong>Chet</strong> <strong>Balder</strong> (847) 863-2785cbalder@<strong>Ardmin</strong><strong>Properties</strong>.com
Need More About <strong>Ardmin</strong> <strong>Properties</strong>?•Go to www.<strong>Ardmin</strong><strong>Properties</strong>.com•Click on the Investor Relations tab•Click on New User Registration•Fill out the online information•Fill out, print and sign the “NDA & NSA"•Fax or mail the information to our office.•Upon receipt, we will send you out all the informationon our current offering and you will be on our futuremailing list for all future offerings.