Free Space Measurement Technique on Dielectric Properties of ...
Free Space Measurement Technique on Dielectric Properties of ...
Free Space Measurement Technique on Dielectric Properties of ...

Create successful ePaper yourself
Turn your PDF publications into a flip-book with our unique Google optimized e-Paper software.
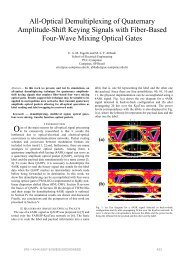
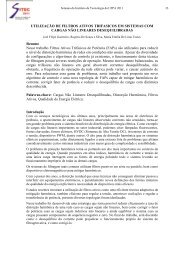
II.METHODOLOGYA. Equipment and <str<strong>on</strong>g>Measurement</str<strong>on</strong>g> SetupThe basic free space measurement system c<strong>on</strong>sists <strong>of</strong>: (1) anetwork analyzer, in this case is an Agilent PNA networkanalyzer, (2) a sample holder, (3) two horn antennas, and (4)Agilent 85071E s<strong>of</strong>tware. Two horn antennas will be used asthe transmitter and receiver, respectively, and the agriculturalwaste material boards will be placed in between them as thematerial under test (MUT) [1]. The horn antenna is shown inFigure 1. The antenna’s dimensi<strong>on</strong> used was 309 mm x 238.5mm x 294 mm, with operating capability between 2.2 GHz to3.3 GHz with VSWR is less or equal to 1.225.Figure 1: Horn antennaThe Network Analyzer provided S- parameters such asand , and was installed with Agilent Technologies 85071E,the material measurement s<strong>of</strong>tware. This s<strong>of</strong>tware has thecapability to determine the intrinsic electromagnetic properties<strong>of</strong> many dielectric and magnetic materials. The 85071Es<strong>of</strong>tware c<strong>on</strong>trolled the network analyzer and calculated thecomplex permittivity ε’ (or dielectric c<strong>on</strong>stant) andpermeability µ’, including the loss factor. Results weredisplayed as a functi<strong>on</strong> <strong>of</strong> frequency, with 1 to 2% accuracy(typical). Depending <strong>on</strong> the Agilent network analyzer andfixture used, test frequencies can also be extended to 325 GHz[3]. Figure 2 shows PNA network analyzer that used in themeasurement.Figure 2: PNA Network Analyzer<str<strong>on</strong>g>Free</str<strong>on</strong>g> <str<strong>on</strong>g>Space</str<strong>on</strong>g> <str<strong>on</strong>g>Measurement</str<strong>on</strong>g> system setup is shown in Figure3. The data gathered through this measurement will be able todetermine a set <strong>of</strong> dielectric c<strong>on</strong>stant and loss factor, in orderfor characterizati<strong>on</strong> <strong>of</strong> these agricultural materials. Theseresults are also important to investigate and study theproperties <strong>of</strong> the materials which are planned to be used forthe further RF microwave design. In additi<strong>on</strong> to this, resultsgraphs can also be viewed through the measurement s<strong>of</strong>twarethat was available as an opti<strong>on</strong> in PNA Network Analyzer –the Agilent 85071E <str<strong>on</strong>g>Measurement</str<strong>on</strong>g> s<strong>of</strong>tware.Figure 3: <str<strong>on</strong>g>Free</str<strong>on</strong>g> <str<strong>on</strong>g>Space</str<strong>on</strong>g> <str<strong>on</strong>g>Measurement</str<strong>on</strong>g> SystemRice Husk, Rice Straw, and Kenaf material boards werethe Material under Test (MUT) for the <str<strong>on</strong>g>Free</str<strong>on</strong>g> <str<strong>on</strong>g>Space</str<strong>on</strong>g><str<strong>on</strong>g>Measurement</str<strong>on</strong>g> <str<strong>on</strong>g>Technique</str<strong>on</strong>g>. These boards were placedperpendicularly with the bottom plane that was used to supporthorn antennas and agricultural material boards. Sampleholders were used to hold the material boards such that it isn<strong>on</strong>-c<strong>on</strong>tacting with the horn antennas. Without sampleholder, it will cause the material board to be deviate to somedegrees. <str<strong>on</strong>g>Measurement</str<strong>on</strong>g>s without the sample holder haveproduced some deviati<strong>on</strong>, which in turn will lead toinaccuracies [3]. The tested material boards are shown inFigure 4.(a) (b) (c)Figure 4: Rice Husk, Rice Straw and Kenaf material boardsB. Calibrati<strong>on</strong><str<strong>on</strong>g>Measurement</str<strong>on</strong>g> errors such as systematic, random and drifterrors are most probably due to imperfecti<strong>on</strong>s in the analyzer,and instrument noises (source phase noise, sampler noise, IFnoise) [7]. These undesired errors must be removed by two portcalibrati<strong>on</strong>, for both reflecti<strong>on</strong> and transmissi<strong>on</strong> measurements.Two-port calibrati<strong>on</strong> is d<strong>on</strong>e <strong>on</strong> four known standards (shortopen-loadthrough or SOLT) [8]. In this calibrati<strong>on</strong>, an Agilent85052 D calibrati<strong>on</strong> kit was used.C. Time Gating SettingThe material board samples were placed in between thehorn antennas and the time domain gating feature <strong>of</strong> the PNAwas used to determine the actual placement distance <strong>of</strong>material under test [8]. The setting <strong>of</strong> time domain gatingfeature can be seen in Figure 5. The average difference mustbe more or equal to 40 dB when measuring a n<strong>on</strong>-metal plate,compared to measuring a metal plate. The ‘a’ symbol showsthe plot <strong>of</strong> the measurement with metal plate and n<strong>on</strong>- metalplate. The two resp<strong>on</strong>ses appeared at ‘b’ and ‘c’ as shown infigure 5 were the transmitting and receiving horn antennaresp<strong>on</strong>ses. This was d<strong>on</strong>e across the frequency range <strong>of</strong> 2.2GHz and 3.3 GHz, frequencies where the use <strong>of</strong> the hornantennas was optimized.2009 SBMO/IEEE MTT-S Internati<strong>on</strong>al Microwave & Optoelectr<strong>on</strong>ics C<strong>on</strong>ference (IMOC 2009) 184
acfrom that, a s<strong>of</strong>tware simulati<strong>on</strong> setup was also introduced toprovide an avenue <strong>of</strong> comparis<strong>on</strong> <strong>of</strong> S- Parameter betweenhardware measurement and s<strong>of</strong>tware simulati<strong>on</strong>. <strong>Dielectric</strong>properties results that obtained through measurement werecalculated averagely from 2.2 GHz until 3.3 GHz.Figure 5: Time Gating SettingD. Simulati<strong>on</strong>Computer Simulati<strong>on</strong> Technology (CST) simulati<strong>on</strong>program was then used in order to study the variati<strong>on</strong> <strong>of</strong> the<str<strong>on</strong>g>Free</str<strong>on</strong>g> <str<strong>on</strong>g>Space</str<strong>on</strong>g> <str<strong>on</strong>g>Measurement</str<strong>on</strong>g> setup, which is shown in Figure 6.The measurement setup was remodeled in this s<strong>of</strong>twareprogram al<strong>on</strong>g with the agricultural material board <strong>of</strong> exactdimensi<strong>on</strong>s. Waves were excited through the horn ports, andthe scattering parameters characterizing the material wereobtained. The parameters that needed to be specified in thissimulati<strong>on</strong> were the dielectric properties <strong>of</strong> the agriculturalmaterial boards (measured through free space measurementtechnique), range <strong>of</strong> frequencies in hardware measurement,actual dimensi<strong>on</strong>s <strong>of</strong> the equipment and it material under test.46 mm294 mm(a)309 mm(b)215 mmFigure 6: <str<strong>on</strong>g>Free</str<strong>on</strong>g> <str<strong>on</strong>g>Space</str<strong>on</strong>g> <str<strong>on</strong>g>Measurement</str<strong>on</strong>g> System in CST29.5 mmIII. RESULT AND DISCUSSIONSeveral variati<strong>on</strong>s <strong>of</strong> MUT were tested to investigate thedegree <strong>of</strong> distincti<strong>on</strong> that the <str<strong>on</strong>g>Free</str<strong>on</strong>g> <str<strong>on</strong>g>Space</str<strong>on</strong>g> <str<strong>on</strong>g>Measurement</str<strong>on</strong>g><str<strong>on</strong>g>Technique</str<strong>on</strong>g> was able to obtain. These MUTs include 1.<strong>Dielectric</strong> properties <strong>of</strong> rice husk with the effect <strong>of</strong> differentresin Phenol Formaldehyde, PF and Urea Formaldehyde, UF.2. <strong>Dielectric</strong> properties <strong>of</strong> three type agricultural wastematerial boards with the effect <strong>of</strong> different percentage <strong>of</strong> resinPhenol Formaldehyde, PF. 3. <strong>Dielectric</strong> properties <strong>of</strong> threetype agricultural waste material boards with the distant effectbetween horn antennas with material under test (MUT). ApartA. <strong>Dielectric</strong> <strong>Properties</strong> <strong>of</strong> Rice Husk with the effect <strong>of</strong> bothresin PF and UF.Both Urea Formaldehyde (UF) and Phenol Formaldehyde(PF) are str<strong>on</strong>g adhesives, which are popularly used to createstr<strong>on</strong>g b<strong>on</strong>ds between adjacent material layers [9], thus waschosen as the agricultural waste material b<strong>on</strong>ding agent. FromTable I, the dielectric c<strong>on</strong>stant, ε’, <strong>of</strong> the rice husk b<strong>on</strong>dedusing PF composite was found to be higher than the UFcomposite. This trend was also observed in differingpercentage (20% and 30%) c<strong>on</strong>tents <strong>of</strong> both resins. Highermoisture level in PF will lead to higher dielectric c<strong>on</strong>stant datacompare to low moisture level c<strong>on</strong>tain in UF [11-12].TABLE I. DIELECTRIC PROPERTIES OF RICE HUSK WITH EFFECTOF PF AND UFResin Percentage, %<strong>Dielectric</strong> <strong>Properties</strong>ε’ ε”PF10 3.236 0.27420 3.405 0.26830 3.681 0.439UF10 2.891 0.22220 3.275 0.32930 3.581 0.272One <strong>of</strong> the reas<strong>on</strong>s to this was due to UF, being less waterabsorbent, while its original liquid form is also densercompared to PF [9]. As can be seen across all percentages, theloss factor <strong>of</strong> the rice husk particle boards have been found tobe increasing and declining unsteadily. This is due to theuneven distributi<strong>on</strong> <strong>of</strong> the resin <strong>on</strong> the raw rice husk. Somepart <strong>of</strong> the rice husk board was covered with a high amount <strong>of</strong>resin, while some other parts with a low volume <strong>of</strong> resin. Thusthe loss factor for the part that high resin c<strong>on</strong>centrati<strong>on</strong> wasfound to be higher compared to areas <strong>of</strong> low resinc<strong>on</strong>centrati<strong>on</strong> [10].B. <strong>Dielectric</strong> <strong>Properties</strong> <strong>of</strong> three types agricultural wastesmaterial boards with the effect <strong>of</strong> different percentage <strong>of</strong>resin Phenol Formaldehyde, PFThe agricultural waste material boards were fabricatedwith resin Urea Formaldehyde (UF) c<strong>on</strong>centrati<strong>on</strong> varyingfrom 10 % to 50% by volume and the thicknesses were 8 mm.Table II gives the ε’ and ε” values for three types <strong>of</strong>agricultural waste material boards and it was observed that ε’increases as the c<strong>on</strong>centrati<strong>on</strong> <strong>of</strong> PF was increased from 10%,30%, and 50% respectively. This is due to higher volumefracti<strong>on</strong> <strong>of</strong> the chemical resin in the composite. Water ischaracterized by high dielectric values and thus explains thehigher dielectric c<strong>on</strong>stant values at elevated moisture c<strong>on</strong>tents2009 SBMO/IEEE MTT-S Internati<strong>on</strong>al Microwave & Optoelectr<strong>on</strong>ics C<strong>on</strong>ference (IMOC 2009) 185
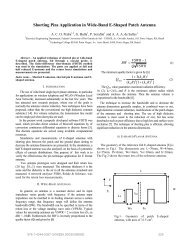
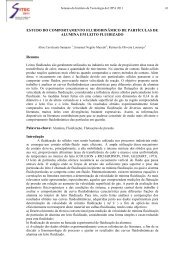
[11-13]. Thus, it showed that for similar measurementdistances for all three materials, the dielectric c<strong>on</strong>stant, ε’increased linearly with the increase in percentage <strong>of</strong> bothresins. The inaccuracies <strong>of</strong> ε” measurement in free spacetechnique are due to two main sources <strong>of</strong> errors; namely (1)the diffracti<strong>on</strong> effects at the edges <strong>of</strong> agricultural residuesmaterial specimen and (2) multiple reflecti<strong>on</strong> during signaltransmissi<strong>on</strong> occurring between the two horn antennas andmode transiti<strong>on</strong>s via surface <strong>of</strong> the sample. These propagati<strong>on</strong>effects had lead to low signal strength, as well as a lengthenedtime for signal to reach the MUTs [14].TABLE II. DIELECTRIC PROPERTIES OF AGRICULTURALWASTESWITH EFFECT OF DIFFERENT PERCENTAGE OF RESIN PFMaterial Percentage, % <strong>Dielectric</strong> <strong>Properties</strong>ε’ ε”RH10 3.139 0.47730 3.473 0.61750 4.491 0.484RS10 1.891 0.21530 1.974 0.37250 2.639 0.211K10 2.101 0.05430 2.141 0.06950 2.382 0.132C. <strong>Dielectric</strong> <strong>Properties</strong> <strong>of</strong> three types agricultural wastematerial boards with the effect <strong>of</strong> different sampledistancesThis part <strong>of</strong> the investigati<strong>on</strong> was carried out to identifyrelati<strong>on</strong>ships between the dielectric properties and the threedifferent distances established between horn antennas to theMUTs. Table III shows the variati<strong>on</strong>s <strong>of</strong> dielectric c<strong>on</strong>stant, ε’and loss factor, ε” versus resin percentage (UF and PF)between the frequency range <strong>of</strong> 2.2GHz to 3.3GHz, at roomtemperature (27ºC). As can be seen in the table III, thedielectric c<strong>on</strong>stant, ε’ values dropped c<strong>on</strong>stantly from aninitial measurement distance (215 mm between horn antennato agricultural waste sample board) compared to largermeasurement distances <strong>of</strong> 377 mm as well as measurementdistances at 475.5 mm.antennas. The results can be seen in Table III. This is due tothe electromagnetic penetrati<strong>on</strong> into the material boards,which was less for larger distances and vice versa for theshorter distances during measurement [14]. Hence, thematerial boards have underg<strong>on</strong>e more energy loss than it wasabsorbing. The reas<strong>on</strong> <strong>of</strong> inc<strong>on</strong>sistent value <strong>of</strong> ε” was similarto observati<strong>on</strong> in the previous measurement [16].D. S- Parameter simulati<strong>on</strong> vs measurementFinally, a comparis<strong>on</strong> between the hardware measurementand s<strong>of</strong>tware simulati<strong>on</strong> was carried out, generating a list <strong>of</strong> S-parameters ( and ). For the hardware measurement,and can be calculated automatically by using the NetworkAnalyzer and s<strong>of</strong>tware, while for the s<strong>of</strong>tware simulati<strong>on</strong>, thedielectric c<strong>on</strong>stant data from the hardware measurement wasused to produce the and results via simulati<strong>on</strong> usingComputer Simulati<strong>on</strong> Technology (CST) s<strong>of</strong>tware.Scattering parameter <strong>of</strong> and <strong>of</strong> the kenaf boardswith different composite percentage <strong>of</strong> Phenol Formaldehyde,PF resin, showed good agreement with the similar <strong>of</strong> graphobtained from hardware measurement, within the frequencyband <strong>of</strong> 2.2 GHz to 3.3 GHz, as shown in Table IV andFigures 7,8, and 9.TABLE IV. and MEASUREMENT AND SIMULATION OF KENAFAT 10%, 30%, AND 50%PFPF%S- Parameter(measurement) (simulati<strong>on</strong>) (measurement) (simulati<strong>on</strong>)10 -12.129 -13.680 -0.100 -0.86130 -12.127 -16.344 0.000 -0.18850 -10.504 -15.694 -0.013 -0.439TABLE III. DIELECTRIC PROPERTIES OF THREE TYPESAGRICULTURAL WASTE MATERIAL BOARDS WITH DIFFERENTSAMPLE DISTANCEMaterialsRiceHuskRiceStrawKenafResinSample Distance (mm)volume 215 377 475.5(%) ε’ ε” ε’ ε” ε’ ε”10 3.236 0.274 3.139 0.477 2.885 0.49630 3.581 0.439 3.473 0.617 3.249 0.65150 4.558 0.216 4.491 0.484 4.031 0.53910 1.906 0.135 1.891 0.215 1.814 0.24630 2.012 0.123 1.974 0.211 1.907 0.23450 2.736 0.224 2.639 0.372 2.485 0.39210 2.101 0.054 2.029 0.124 2.003 0.127830 2.141 0.069 2.109 0.168 2.029 0.28450 2.382 0.133 2.310 0.240 2.103 0.210Figure 7: and measurement and simulati<strong>on</strong> <strong>of</strong> kenaf 10% PFThe decreasing trend <strong>of</strong> dielectric c<strong>on</strong>stant was found whenall the three type agricultural waste material boards (rice husk,rice straw, and kenaf) were placed further from the hornFigure 8: and measurement and simulati<strong>on</strong> <strong>of</strong> kenaf 30% PF2009 SBMO/IEEE MTT-S Internati<strong>on</strong>al Microwave & Optoelectr<strong>on</strong>ics C<strong>on</strong>ference (IMOC 2009) 186
Malaysian Ministry <strong>of</strong> Science, Technology and Innovati<strong>on</strong>(MOSTI) (e-ScienceFund Grant 9005-00016) which enabledthe producti<strong>on</strong> <strong>of</strong> this article.Figure 9: and measurement and simulati<strong>on</strong> <strong>of</strong> kenaf 50% PFHowever, some uncertainty was detected between andwhen comparing between hardware result and s<strong>of</strong>twaresimulati<strong>on</strong>, which is typically less than 50%. This can be seenin Table V. This was caused due to several uncertainty factorssuch as instrumentati<strong>on</strong>, dimensi<strong>on</strong>al and geometricaluncertainty <strong>of</strong> MUTs, roughness and c<strong>on</strong>ductivity <strong>of</strong> thec<strong>on</strong>ducti<strong>on</strong> surfaces [15]. Additi<strong>on</strong>al variati<strong>on</strong>s may also havebeen caused by the systematic uncertainties in the particularinstrumentati<strong>on</strong>, calibrati<strong>on</strong> standards and the dimensi<strong>on</strong>alimperfecti<strong>on</strong>s <strong>of</strong> the implemented test fixture [16-18].IV. CONCLUSIONThe <str<strong>on</strong>g>Free</str<strong>on</strong>g> <str<strong>on</strong>g>Space</str<strong>on</strong>g> <str<strong>on</strong>g>Measurement</str<strong>on</strong>g> was found to be a suitablemethod in determining the dielectric properties, especiallywhen a n<strong>on</strong>-destructive measurement <strong>of</strong> flat materials isdesired. This method is simple, fast and <strong>of</strong>fers superioraccuracy, as materials were placed between antennas for an<strong>on</strong>-c<strong>on</strong>tacting measurement. The free space method worksbest for large flat solid materials, while granular and powderedmaterials can also be measured in a fixture. Calibrati<strong>on</strong> andgating techniques performed in the network analyzer can beused to reduce measurement errors. <strong>Dielectric</strong> c<strong>on</strong>stant, lossfactor, and S-parameters were determined and tabulated forrice husk, rice straw, and kenaf boards at specified moisturec<strong>on</strong>tents or b<strong>on</strong>ding structure <strong>of</strong> resins for the frequency rangefrom 2.2 GHz to 3.3 GHz at room temperature <strong>of</strong> 27 ºC. Fromthe result obtained, rice husk was found to possess a highdielectric c<strong>on</strong>stant compared to rice straw and kenaf, due tothe natural properties <strong>of</strong> rice husk. The large surface area <strong>of</strong>rice straw has provided the ability to absorb moreelectromagnetic signal.V. ACKNOWLEDGEMENTVI.REFERENCES[1] M.S. Venkatesh and G.S.V. Raghavan, “An overview <strong>of</strong> dielectricproperties measuring techniques”, Canadian Biosystems Engineering,2005[2] B.-K. Chung, “<strong>Dielectric</strong> C<strong>on</strong>stant <str<strong>on</strong>g>Measurement</str<strong>on</strong>g> For Thin Material AtMicrowave Frequencies,” Progress In Electromagnetics Research, PIER75, 239–252, 2007.[3] Agilent Technologies, “Basic <strong>of</strong> Measuring the <strong>Dielectric</strong> <strong>Properties</strong>Meterials – Applicati<strong>on</strong> notes”, 26 June 2006[4] C.A. Balanis, “Antenna Theory: Analysis and Design”, 3 rd Editi<strong>on</strong>,Wiley Interscience, 2005[5] Deepak Kumar Ghodga<strong>on</strong>kar, Nor Azlin Ali,”Microwave N<strong>on</strong>destructiveTesting <strong>of</strong> Composite Materials using <str<strong>on</strong>g>Free</str<strong>on</strong>g>-<str<strong>on</strong>g>Space</str<strong>on</strong>g> Microwave<str<strong>on</strong>g>Measurement</str<strong>on</strong>g> <str<strong>on</strong>g>Technique</str<strong>on</strong>g>s.” 15 th World C<strong>on</strong>ference <strong>on</strong> N<strong>on</strong> DestructiveTesting, Roma (Italy), 15-21 October 2000.[6] Suhardy Daud, Mohd Nazry Salleh, Farizul Hafiz Kasim and SaifulAzhar Saad, “Analysis <strong>of</strong> Chemical Elements in Major Perlis’sAgricultural Residue”, School <strong>of</strong> Materials Engineering, KolejUniversiti Kejuruteraan Utara Malaysia (KUKUM,2006)[7] Samir Trabelsi and Stuart O Nels<strong>on</strong>, “<str<strong>on</strong>g>Free</str<strong>on</strong>g>-<str<strong>on</strong>g>Space</str<strong>on</strong>g> <str<strong>on</strong>g>Measurement</str<strong>on</strong>g> Of<strong>Dielectric</strong> <strong>Properties</strong> Of Cereal Grain And Oilseed At MicrowaveFrequencies,” Meas. Sci. Technol. 14 (2003) 589–600[8] Agilent Technologies, “Agilent 85071E Materials <str<strong>on</strong>g>Measurement</str<strong>on</strong>g>S<strong>of</strong>tware – Technical Overview”, 27 June 2006[9] L.T. Chew, C.L. Ong, “Urea Formaldehyde Particle Boards FromYemane”, Forest Research Institute Malaysia, Kep<strong>on</strong>g, 52109 KualaLumpur, Malaysia.[10] Russell Hornung “ Inserti<strong>on</strong> Loss and Loss tangent” Arl<strong>on</strong>, Magnetic forelectr<strong>on</strong>ic divisi<strong>on</strong>.[11] T. Jayanthy, P.E. Sankaranarayanan<str<strong>on</strong>g>Measurement</str<strong>on</strong>g> <strong>of</strong> Dry RubberC<strong>on</strong>tent in Latex Using Microwave <str<strong>on</strong>g>Technique</str<strong>on</strong>g>,” <str<strong>on</strong>g>Measurement</str<strong>on</strong>g> ScienceReview, Volume 5, Secti<strong>on</strong> 3, 2005[12] V. V. Navarkhele, S.T. Nakade and A.A. Shaikh, “A dielectric approachto determine water c<strong>on</strong>tent in soil using microwave transmissi<strong>on</strong>technique,” J. Indian Inst. Sci., Nov.–Dec. 2006, 86, 723–729[13] G. Ayalew, N.M. Holden and S.M. Ward,”Microwave dielectricproperties <strong>of</strong> horticultural peat products” Mires and Peat, Volume 2,Article 03, 2007[14] David M. Pozar, “Microwave Engineering”, 3rd Ed., Wiley, 2005[15] M. Tabassum Afzal, Bruce Colpitts, Kurt Galik, “<strong>Dielectric</strong> <strong>Properties</strong><strong>of</strong> S<strong>of</strong>twood Species Measured with an Open-ended Coaxial Probe”, 8thInternati<strong>on</strong>al IUFRO Wood Drying C<strong>on</strong>ference – 2003[16] Kamal Sarabandi and Fawwaz T. Ulaby “<str<strong>on</strong>g>Technique</str<strong>on</strong>g> for Measuring the<strong>Dielectric</strong> C<strong>on</strong>stant <strong>of</strong> Thin Materials”, IEEE Transacti<strong>on</strong>s OnMicrowave Theory and techniques,VOL. 31, NO. 4, December 1988[17] P. Kumar, P. Cor<strong>on</strong>el, J. Simuvic, V.D. Tru<strong>on</strong>g, And K.P. Sandeep“<str<strong>on</strong>g>Measurement</str<strong>on</strong>g> <strong>of</strong> <strong>Dielectric</strong> <strong>Properties</strong> <strong>of</strong> Pumpable Food Materialsunder Static and C<strong>on</strong>tinuous Flow C<strong>on</strong>diti<strong>on</strong>s” Food Engineering andPhysical <strong>Properties</strong>[18] J. Wang, T. Schmugge, and D. Williams “<strong>Dielectric</strong> C<strong>on</strong>stant Of SoilsAt Microwave Frequencies “NASA Technical Paper 1238The authors would like to acknowledge UniversitiMalaysia Perlis (Short Term Grant 9001-00110) and2009 SBMO/IEEE MTT-S Internati<strong>on</strong>al Microwave & Optoelectr<strong>on</strong>ics C<strong>on</strong>ference (IMOC 2009) 187