Swelling and Morphology of the Skin Layer of Polyamide Composite ...
Swelling and Morphology of the Skin Layer of Polyamide Composite ...
Swelling and Morphology of the Skin Layer of Polyamide Composite ...

Create successful ePaper yourself
Turn your PDF publications into a flip-book with our unique Google optimized e-Paper software.
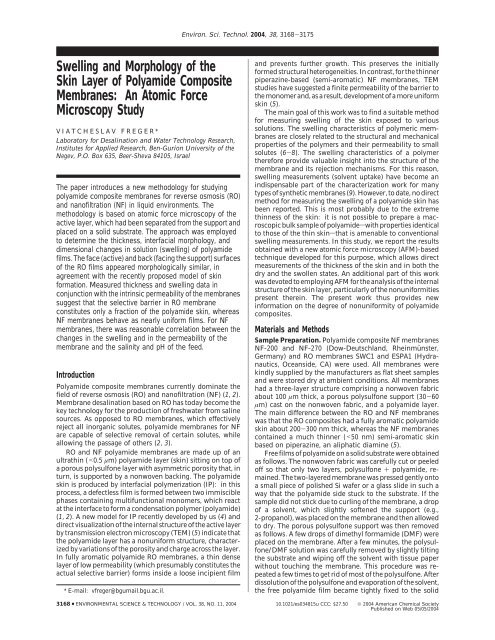
Environ. Sci. Technol. 2004, 38, 3168-3175<strong>Swelling</strong> <strong>and</strong> <strong>Morphology</strong> <strong>of</strong> <strong>the</strong><strong>Skin</strong> <strong>Layer</strong> <strong>of</strong> <strong>Polyamide</strong> <strong>Composite</strong>Membranes: An Atomic ForceMicroscopy StudyVIATCHESLAV FREGER*Laboratory for Desalination <strong>and</strong> Water Technology Research,Institutes for Applied Research, Ben-Gurion University <strong>of</strong> <strong>the</strong>Negev, P.O. Box 635, Beer-Sheva 84105, IsraelThe paper introduces a new methodology for studyingpolyamide composite membranes for reverse osmosis (RO)<strong>and</strong> nan<strong>of</strong>iltration (NF) in liquid environments. Themethodology is based on atomic force microscopy <strong>of</strong> <strong>the</strong>active layer, which had been separated from <strong>the</strong> support <strong>and</strong>placed on a solid substrate. The approach was employedto determine <strong>the</strong> thickness, interfacial morphology, <strong>and</strong>dimensional changes in solution (swelling) <strong>of</strong> polyamidefilms. The face (active) <strong>and</strong> back (facing <strong>the</strong> support) surfaces<strong>of</strong> <strong>the</strong> RO films appeared morphologically similar, inagreement with <strong>the</strong> recently proposed model <strong>of</strong> skinformation. Measured thickness <strong>and</strong> swelling data inconjunction with <strong>the</strong> intrinsic permeability <strong>of</strong> <strong>the</strong> membranessuggest that <strong>the</strong> selective barrier in RO membraneconstitutes only a fraction <strong>of</strong> <strong>the</strong> polyamide skin, whereasNF membranes behave as nearly uniform films. For NFmembranes, <strong>the</strong>re was reasonable correlation between <strong>the</strong>changes in <strong>the</strong> swelling <strong>and</strong> in <strong>the</strong> permeability <strong>of</strong> <strong>the</strong>membrane <strong>and</strong> <strong>the</strong> salinity <strong>and</strong> pH <strong>of</strong> <strong>the</strong> feed.Introduction<strong>Polyamide</strong> composite membranes currently dominate <strong>the</strong>field <strong>of</strong> reverse osmosis (RO) <strong>and</strong> nan<strong>of</strong>iltration (NF) (1, 2).Membrane desalination based on RO has today become <strong>the</strong>key technology for <strong>the</strong> production <strong>of</strong> freshwater from salinesources. As opposed to RO membranes, which effectivelyreject all inorganic solutes, polyamide membranes for NFare capable <strong>of</strong> selective removal <strong>of</strong> certain solutes, whileallowing <strong>the</strong> passage <strong>of</strong> o<strong>the</strong>rs (2, 3).RO <strong>and</strong> NF polyamide membranes are made up <strong>of</strong> anultrathin (
FIGURE 1. Dark field optical micrograph (135 × 102 µm) <strong>of</strong> strips<strong>of</strong> polyamide (SWC1) on a silicon wafer. Bare silicon appears black.Local film thickness presumably increases in going from blue tored.surface by adhesion. For complete removal <strong>of</strong> <strong>the</strong> polysulfone,<strong>the</strong> substrate with <strong>the</strong> attached membrane was thoroughlyrinsed in clean DMF <strong>and</strong> dichloromethane. Once cleaned <strong>of</strong>polysulfone, <strong>the</strong> films prepared from RO membranes usuallyacquired a bright color due to interference <strong>of</strong> reflected light.The thinner NF films were colorless, yet easily discernibledue to a more diffuse light reflection as opposed to <strong>the</strong>specular reflection <strong>of</strong> <strong>the</strong> bare substrate.The choice <strong>of</strong> DMF for dissolving <strong>of</strong>f <strong>the</strong> polysulfone wasbased on three factors. First, DMF is known to dissolvepolysulfone, but <strong>the</strong> dissolution is relatively slow <strong>and</strong> doesnot lead to fast <strong>and</strong> poorly controlled nonhomogeneousdeformations. Second, <strong>the</strong> solubility parameter <strong>of</strong> DMF (24.8Mpa 1/2 ) is fairly close to <strong>the</strong> value suggested by Aharony (10)for fully aromatic polyamide networks (23 Mpa 1/2 ), whichmeans that DMF should be a good swelling agent for <strong>the</strong> skinlayer. <strong>Swelling</strong> <strong>and</strong> s<strong>of</strong>tening (without dissolution due to <strong>the</strong>high cross-linking) should help <strong>the</strong> polyamide to accommodateirregular stresses occurring during rapid deformation<strong>of</strong> polysulfone upon dissolution. Third, polar DMF wets both<strong>the</strong> glass or native (oxidized) Si surface <strong>and</strong> <strong>the</strong> membrane.When placed on <strong>the</strong> membrane, a drop <strong>of</strong> DMF spreads <strong>and</strong>drags <strong>the</strong> edges <strong>of</strong> <strong>the</strong> film in <strong>the</strong> direction that preventsfolding <strong>and</strong> wrinkling. This was particularly important during<strong>the</strong> very first moments <strong>of</strong> dissolution <strong>of</strong> polysulfone. It is nottotally impossible that some fraction <strong>of</strong> <strong>the</strong> polyamide couldbe dissolved in DMF. However, comparison <strong>of</strong> <strong>the</strong> thickness<strong>of</strong> <strong>the</strong> free films measured by AFM with TEM images (seebelow) <strong>and</strong> our preliminary spectroscopic data obtained usingattenuated total reflection IR spectroscopy (11) indicate thatmost <strong>of</strong> <strong>the</strong> polyamide did not dissolve. Fur<strong>the</strong>rmore, evenif some dissolution had occurred, it would have affected only<strong>the</strong> loosest <strong>and</strong> very lightly cross-linked parts <strong>of</strong> polyamidethat do not contribute to separation <strong>and</strong> are actuallyundesirable for our analysis.Prior to AFM imaging, r<strong>and</strong>om <strong>and</strong> nearly parallel multiplescratches were made in <strong>the</strong> film by gently scratching it witha sharp metal needle to form narrow strips <strong>of</strong> polyamide.The optical micrograph <strong>of</strong> a typical scratched sample takenwith an optical microscope (Zeiss Axioscop 2 Math equippedwith a digital camera) is shown in Figure 1. The hard nativeSi or glass surface required only minimal care to preventscratching <strong>of</strong> <strong>the</strong> substrate. Perfect specular reflection <strong>of</strong> <strong>the</strong>bare substrate areas in <strong>the</strong> dark field optical images (uniformblack background in Figure 1) did indeed indicate <strong>the</strong> absence<strong>of</strong> scratches. The use <strong>of</strong> strips <strong>of</strong> film gave <strong>the</strong> advantage <strong>of</strong>a flat solid surface on both sides <strong>of</strong> <strong>the</strong> film, which madepossible reliable measurements <strong>of</strong> <strong>the</strong> strip thickness.AFM Characterization <strong>and</strong> Analysis. AFM images weretaken on a Dimension 3100 (Digital Instruments, Santa-Barbara, CA) <strong>and</strong> Autoprobe CPR (Park Scientific Instruments,Palo Alto, CA) instruments using <strong>the</strong> manufacturers’ fluidcells that allowed imaging <strong>of</strong> liquid-flooded samples. Thefollowing silicon nitride tips were used: DNP (DI-Veeco)with a nominal spring <strong>of</strong> constant 0.32 N/m <strong>and</strong> Parkmicrolevers (0.1 N/m), respectively. The contact mode wasemployed, which makes use <strong>of</strong> “hard core” repulsiveinteractions between <strong>the</strong> tip <strong>and</strong> <strong>the</strong> surface known to be <strong>of</strong>very short range (,1 nm). To ensure that AFM did not operatein <strong>the</strong> long-range repulsive electrostatic interaction associatedwith <strong>the</strong> double electric layer, we made use <strong>of</strong> <strong>the</strong> data <strong>of</strong>Bowen et al. (12, 13), who reported force-distance curvesfor <strong>the</strong> interaction <strong>of</strong> a SiO 2 sphere <strong>and</strong> polyamide membranesnormalized to <strong>the</strong> sphere radius. Although <strong>the</strong> shape<strong>and</strong> material <strong>of</strong> <strong>the</strong> tip in our experiments differed from <strong>the</strong>SiO 2 sphere, we used <strong>the</strong>se data <strong>and</strong> <strong>the</strong> nominal tip diameter<strong>of</strong> 20-60 nm to roughly estimate <strong>the</strong> maximal electrostaticforce; this was found to be
FIGURE 2. AFM image (5 × 5 µm) <strong>of</strong> a strip <strong>of</strong> <strong>the</strong> skin <strong>of</strong> a NF-270 membrane under dry conditions <strong>and</strong> <strong>the</strong> corresponding height histogram.FIGURE 3. AFM image (22 × 18 µm) <strong>of</strong> a strip <strong>of</strong> <strong>the</strong> skin <strong>of</strong> a SWC1 membrane under water <strong>and</strong> <strong>the</strong> corresponding height histogram.The inset shows <strong>the</strong> peak corresponding to <strong>the</strong> area covered by <strong>the</strong> film in more detail. Note <strong>the</strong> small third peak, at about three times<strong>the</strong> dominant height, corresponding to <strong>the</strong> folded area along <strong>the</strong> right edge <strong>of</strong> <strong>the</strong> film. The presence <strong>of</strong> <strong>the</strong> fold does not interfere with<strong>the</strong> determination <strong>of</strong> <strong>the</strong> dominant height.images <strong>and</strong> <strong>the</strong> swelling. This was accomplished by usingheight histograms. The height distribution was bimodal, withtwo clear <strong>and</strong> well-determined maxima corresponding to<strong>the</strong> bare substrate <strong>and</strong> film-occupied areas (Figures 2 <strong>and</strong> 3).The height difference between <strong>the</strong> maxima served as ameasure <strong>of</strong> <strong>the</strong> dominant film thickness. This parameter isrelatively insensitive to <strong>the</strong> presence <strong>of</strong> excessively swollenspots, folds, small parts <strong>of</strong> <strong>the</strong> film detached from <strong>the</strong>substrate or lifted by <strong>the</strong> moving tip at <strong>the</strong> film edge, dustparticles, <strong>and</strong> o<strong>the</strong>r artifacts. The degree <strong>of</strong> swelling on <strong>the</strong>wet basis (S) was found by relating <strong>the</strong> dominant thicknesses<strong>of</strong> <strong>the</strong> wet (d wet) <strong>and</strong> dry (d dry) samples measured for <strong>the</strong>same region as follows:S ) (d wet - d dry )/d wet × 100% (1)It was also possible to use in eq 1 <strong>the</strong> average thicknessto calculate swelling. The average thickness was taken as <strong>the</strong>difference between <strong>the</strong> averaged heights <strong>of</strong> <strong>the</strong> film-covered<strong>and</strong> <strong>the</strong> bare substrate areas. This was obtained by averagingover <strong>the</strong> respective parts (peaks) <strong>of</strong> <strong>the</strong> histogram. Thischaracteristic could help detect <strong>the</strong> enhanced swelling <strong>of</strong><strong>the</strong> more protruding parts <strong>of</strong> <strong>the</strong> film corresponding to <strong>the</strong>more elevated regions that show up as “tails” in <strong>the</strong> heighthistogram. When large artifacts were present, it was possibleto eliminate <strong>the</strong>ir influence by excluding highly elevated areas(i.e., those exceeding three to four times <strong>the</strong> dominant height).Results <strong>and</strong> DiscussionNF Membranes. Typical flattened images <strong>of</strong> <strong>the</strong> polyamidelayer <strong>of</strong> NF composites <strong>and</strong> <strong>the</strong> corresponding heighthistograms are shown in Figures 2 <strong>and</strong> 4. The data <strong>and</strong>calculations <strong>of</strong> swelling in water are summarized in Table 1.As was expected, <strong>the</strong>re were some deviations betweensamples, as is typical for syn<strong>the</strong>tic membranes, but <strong>the</strong>differences were not dramatic. The swelling was fairly similarfor NF-200 <strong>and</strong> NF-270 membranes, <strong>the</strong> main differencebetween <strong>the</strong> two being <strong>the</strong> thickness. The dry thickness <strong>of</strong><strong>the</strong> NF-270 membrane was determined to be about 14 nm,while <strong>the</strong> NF-200 membrane was about twice as thick (32nm), findings which are fully consistent with <strong>the</strong> fact <strong>the</strong>former membrane is twice as permeable as <strong>the</strong> latter (Table1). Both membranes swelled in water to contain around 20%water on wet volume basis. The swelling <strong>of</strong> <strong>the</strong> film was nearlyunidimensional, as was concluded by examining <strong>the</strong> changes<strong>of</strong> <strong>the</strong> film dimensions in <strong>the</strong> normal <strong>and</strong> lateral directions,<strong>the</strong> latter being virtually undetectable. This mode <strong>of</strong> swelling,which apparently results from <strong>the</strong> anchoring <strong>of</strong> <strong>the</strong> mem-3170 9 ENVIRONMENTAL SCIENCE & TECHNOLOGY / VOL. 38, NO. 11, 2004
FIGURE 4. AFM images (8 × 8 µm) <strong>of</strong> a NF-200 film: (a) under dry conditions, (b) in deionized water, (c) in 15% NaCl solution at pH 3,<strong>and</strong> (d) 15% NaCl solution at pH 10. It is evident that in panel d <strong>the</strong> right edge <strong>of</strong> <strong>the</strong> strip had been partly detached by <strong>the</strong> tip. Fordetermination <strong>of</strong> <strong>the</strong> average thickness, <strong>the</strong> damaged area was excluded (<strong>the</strong> exclusion negligibly affected <strong>the</strong> determination <strong>of</strong> <strong>the</strong>dominant thickness).TABLE 1. Thickness, <strong>Swelling</strong> in Water, <strong>and</strong> Actual <strong>and</strong> Superficial Intrinsic Permeability <strong>of</strong> Four RO <strong>and</strong> NF <strong>Polyamide</strong> <strong>Composite</strong>Membranesthickness (nm)dominantaverageswelling(%, wet basis)La pmembrane dry swollen dry swollen dominant average (L m -2 h -1 bar -1 )NF-270 13.9 18.0 14.1 19.0 22.8 25.813.7 16.0 14.5 17.7 14.4 18.113NF-200 30.2 38.1 32.2 44.0 20.7 26.8 7.1SWC1 74 84 108 115 11.9 6.1288 296 283 295 2.7 4.1ESPA1 back surface 146 157 162 165 7.0 1.8333 355 357 386 6.2 7.5ESPA1 face surface 240 252 283 296 4.8 4.4aDeduced from <strong>the</strong> manufacturers’ data (15). b Dominant thickness in swollen state used.10 19 L pδ b(m 2 s -1 Pa -1 )6.8 ( ‘1.20.39 2.1 ( 1.64.9 35 ( 14brane on <strong>the</strong> substrate by adhesion forces, closely correspondsto <strong>the</strong> actual conditions experienced by a workingmembrane, which is tightly held by <strong>the</strong> support.One <strong>of</strong> <strong>the</strong> goals <strong>of</strong> <strong>the</strong> work was to obtain an insight into<strong>the</strong> nonuniformity across <strong>the</strong> skin. Our new model (4)proposed that <strong>the</strong> skin has a s<strong>and</strong>wiched structure in whichVOL. 38, NO. 11, 2004 / ENVIRONMENTAL SCIENCE & TECHNOLOGY 9 3171
FIGURE 5. TEM images <strong>of</strong> uranyl-stained NF-200 (left) <strong>and</strong> ESPA1 (right) membranes. Uranyl stains <strong>the</strong> negatively charged (carboxyl-rich)polyamide, leaving <strong>the</strong> positively charged (carboxyl-free) polyamide unstained. The boundary between <strong>the</strong> dark <strong>and</strong> bright-colored polyamidescorresponds to <strong>the</strong> densest barrier. Adapted from ref 5.<strong>the</strong> central part (middle plane) is <strong>the</strong> densest, whereas toward<strong>the</strong> outer surfaces (face <strong>and</strong> back) <strong>the</strong> polymer grows looser.This conjecture was in good agreement with TEM observationsfor RO polyamides, whereas for NF membranes someambiguity remained, suggesting that piperazine-based skinmight be more uniform than RO composites (5) (Figure 5).The present work <strong>of</strong>fers ano<strong>the</strong>r way to address this point,namely, to look at <strong>the</strong> difference between <strong>the</strong> swelling ratescalculated using <strong>the</strong> dominant <strong>and</strong> average thicknesses. Theswelling deduced from <strong>the</strong> average thickness was consistentlylarger than <strong>the</strong> swelling deduced from <strong>the</strong> dominant thickness(Table 1). This suggests that protrusions from <strong>the</strong> surface(outmost parts) are looser <strong>and</strong> that <strong>the</strong>ir swelling is strongerthan <strong>the</strong> film on average. Protruding areas with enhancedswelling, contributing mainly to <strong>the</strong> average thickness <strong>and</strong>much less so to <strong>the</strong> dominant thickness, can also be directlyobserved in Figure 4. Never<strong>the</strong>less, <strong>the</strong>y occupy a ra<strong>the</strong>rlimited area, while most <strong>of</strong> <strong>the</strong> skin looks ra<strong>the</strong>r smooth <strong>and</strong>uniform both before <strong>and</strong> after swelling. This suggests that<strong>the</strong> density nonuniformities across <strong>the</strong> skin, while definitelyexisting, are fairly moderate, in agreement with <strong>the</strong> TEMobservations.RO Membranes. In <strong>the</strong> determination <strong>of</strong> <strong>the</strong> swelling <strong>of</strong>RO films by <strong>the</strong> present method, <strong>the</strong> accuracy <strong>of</strong> <strong>the</strong>measurements became <strong>the</strong> critical issue. Although <strong>the</strong>thickness <strong>of</strong> each sample (d wet or d dry) could be determinedwith reasonable precision (a few percent), swelling measurementsrequired a higher precision to determine <strong>the</strong> smalldifference (d wet - d dry) between <strong>the</strong> thickness in <strong>the</strong> dry <strong>and</strong>swollen states (eq 1). This situation was fur<strong>the</strong>r complicatedby <strong>the</strong> statistical noise coming from <strong>the</strong> rough morphology<strong>of</strong> <strong>the</strong> samples, which made it difficult to accurately locate<strong>the</strong> maxima in <strong>the</strong> histograms. This statistical noise is clearlyevident in <strong>the</strong> histograms in Figure 3. Smoothing <strong>of</strong> <strong>the</strong>histograms or decreasing <strong>the</strong> number <strong>of</strong> subdivisions (tomake location <strong>of</strong> a maximum less ambiguous) reduced <strong>the</strong>precision to <strong>the</strong> level <strong>of</strong> <strong>the</strong> swelling rate itself. This was alsomanifested in <strong>the</strong> absence <strong>of</strong> any systematic differencebetween <strong>the</strong> swelling based on average thickness <strong>and</strong> thatbased on <strong>the</strong> dominant thickness (Table 1). In addition, <strong>the</strong>dry thickness <strong>of</strong> <strong>the</strong> RO samples varied much more significantlythan that <strong>of</strong> <strong>the</strong> NF samples. For this reason, <strong>the</strong> resultsshould be viewed as semiquantitative at best. Never<strong>the</strong>less,<strong>the</strong> data presented in Table 1 indicate that <strong>the</strong> swelling <strong>of</strong><strong>the</strong> analyzed RO composites (SWC1 <strong>and</strong> ESPA1) is unlikelyto significantly exceed 10% (most probably being <strong>of</strong> <strong>the</strong> order<strong>of</strong> 5%), which is appreciably lower than that <strong>of</strong> NF membranes.The low swelling agrees well with <strong>the</strong> fact that fullyaromatic networks are more rigid (16) <strong>and</strong> presumably moreregularly packed (17) than <strong>the</strong> semi-aromatic network <strong>of</strong> NFcomposites.Arthur (18) measured <strong>the</strong> mass sorption <strong>of</strong> water vaporby a powder polyamide prepared from <strong>the</strong> same monomersas RO membranes, which he presumed would represent agenuine membrane. He reported that, upon equilibrationwith water vapor <strong>of</strong> 95-100% humidity, weight gain increasedfrom about 20% after a short exposure to 28.4% after 7 days<strong>and</strong> that no free (freezable) water was detected by differentialscanning calorimetry (18). This gain is much larger than ourAFM estimates <strong>of</strong> <strong>the</strong> swelling rate in pure water (Table 1).Typically, during our AFM scans, samples were exposed towater for less than 1 h <strong>and</strong> over this time no noticeableincrease <strong>of</strong> swelling was observed in repeated scans. For thisreason this time was considered sufficient. As compared withArthur’s experiments, <strong>the</strong> shorter time <strong>of</strong> our experimentswas presumably set <strong>of</strong>f by <strong>the</strong> small thickness <strong>of</strong> <strong>the</strong>membrane <strong>and</strong> direct contact with liquid, which is knownto largely enhance <strong>the</strong> rate <strong>of</strong> sorption as compared to vaporsorption. To explain <strong>the</strong> large discrepancy between ourfindings <strong>and</strong> those <strong>of</strong> Arthur, we could only presume that atleast part <strong>of</strong> <strong>the</strong> measured water uptake in his experimentscould have been due to capillary condensation in pores smallenough to suppress freezing. The effect <strong>of</strong> considerablesupercooling <strong>of</strong> water at distances <strong>of</strong> a few nanometers (atypical size <strong>of</strong> <strong>the</strong> voids in a RO skin) from a confining interfaceis well-known (19) <strong>and</strong> could make <strong>the</strong> water <strong>of</strong> swelling <strong>and</strong>capillary condensation indistinguishable. In contrast, ourmethod detects only <strong>the</strong> dimensional changes caused byswelling (i.e., mixing <strong>of</strong> polymer <strong>and</strong> solvent at <strong>the</strong> molecularlevel ra<strong>the</strong>r than pore filling) <strong>and</strong> is thus less prone to artifacts<strong>of</strong> this kind. In addition, <strong>the</strong> present method is not limitedto pure water, as are vapor sorption experiments, <strong>and</strong><strong>the</strong>refore <strong>of</strong>fers <strong>the</strong> possibility <strong>of</strong> observing <strong>the</strong> effect <strong>of</strong>salinity <strong>and</strong> pH on <strong>the</strong> swelling response <strong>of</strong> polyamide filmsin direct contact with a feed.As already mentioned, <strong>the</strong> film is supposedly densestapproximately in <strong>the</strong> middle <strong>of</strong> <strong>the</strong> cross-section <strong>and</strong> getslooser toward <strong>the</strong> two interfaces (face <strong>and</strong> back). The complexnature <strong>of</strong> <strong>the</strong> interfacial polymerization process leads to <strong>the</strong>development <strong>of</strong> a rough pattern in <strong>the</strong> polymer (5, 20). Suchpatterns have routinely been observed in AFM scans <strong>of</strong> <strong>the</strong>active surface (face) <strong>of</strong> <strong>the</strong> polyamide composites (21-24)3172 9 ENVIRONMENTAL SCIENCE & TECHNOLOGY / VOL. 38, NO. 11, 2004
FIGURE 6. AFM images <strong>of</strong> <strong>the</strong> face <strong>and</strong> back surfaces <strong>of</strong> ESPA1 <strong>and</strong> SWC1 films. All images are 5 µm × 5 µm: (a) active surface <strong>of</strong> originalESPA1, (b) face side <strong>of</strong> a film prepared from ESPA1, (c) back side <strong>of</strong> a film prepared from ESPA1, (d) active surface <strong>of</strong> original SWC1,<strong>and</strong> (e) back side <strong>of</strong> a film prepared from SWC1.<strong>and</strong> may be considered as an intrinsic property <strong>of</strong> this type<strong>of</strong> membrane. A remarkable finding was that <strong>the</strong> morphology<strong>of</strong> <strong>the</strong> back surface <strong>of</strong> <strong>the</strong> skin (originally facing <strong>the</strong> support)is strikingly similar to that <strong>of</strong> <strong>the</strong> active surface.To confirm that <strong>the</strong> morphology does not change duringisolation <strong>of</strong> <strong>the</strong> skin, we prepared a sample in which <strong>the</strong> skin<strong>of</strong> an ESPA1 membrane was prepared on <strong>the</strong> substrate with<strong>the</strong> active surface facing down; <strong>the</strong>reafter, a gentle flow <strong>of</strong>DMF over <strong>the</strong> specimen served to pull <strong>the</strong> free film over sothat <strong>the</strong> active surface finally faced up. Characterization <strong>of</strong>this sample gave <strong>the</strong> same results as samples prepared with<strong>the</strong>ir face down, <strong>and</strong> its swelling was consistent with that <strong>of</strong>o<strong>the</strong>r RO samples (Table 1). We could not detect anymorphological difference between <strong>the</strong> original ESPA1 membrane<strong>and</strong> <strong>the</strong> face-up film (Figure 6a,b), which both showed<strong>the</strong> typical rough pattern resembling a large number <strong>of</strong> fusedparticles with sharp protrusions characteristic <strong>of</strong> <strong>the</strong> ESPAmembranes (5, 25, 26). The finite tip dimensions convert <strong>the</strong>protrusions to characteristic pyramidal shapes observed inboth images, but <strong>the</strong>ir actual shape may be seen in Figure5. More important, however, is <strong>the</strong> fact that <strong>the</strong> back <strong>and</strong>face surfaces <strong>of</strong> <strong>the</strong> skin show similar morphologies (Figure6c). Admittedly, no sharp protrusions are present at <strong>the</strong> backsurface, yet <strong>the</strong> typical “fused particles” pattern is clearlyseen. The resemblance is even closer for <strong>the</strong> SWC1 membrane,for which <strong>the</strong> AFM images <strong>of</strong> <strong>the</strong> active surface <strong>of</strong> anoriginal membrane <strong>and</strong> <strong>the</strong> back surface <strong>of</strong> <strong>the</strong> film arevirtually indistinguishable (Figure 6d,e). This morphologicalsymmetry between <strong>the</strong> face <strong>and</strong> back surfaces <strong>of</strong> <strong>the</strong> skinpredicted by our new model <strong>of</strong> skin formation (4, 5) couldbe viewed as an additional indication <strong>of</strong> its correctness.However, it is still not clear what effect <strong>the</strong> support hason <strong>the</strong> formation <strong>of</strong> <strong>the</strong> above-described patterns on <strong>the</strong>back side <strong>of</strong> <strong>the</strong> film <strong>and</strong> why <strong>the</strong>se patterns are observedas if no support is present. It may be assumed that <strong>the</strong> loosestparts <strong>of</strong> <strong>the</strong> polyamide connecting <strong>the</strong> skin to <strong>the</strong> supportcould have been destroyed during dissolution <strong>of</strong> polysulfonein organic solvents <strong>and</strong> washed away. As discussed above,if this were true, such loose parts would actually be undesiredin our analysis. Ano<strong>the</strong>r explanation is that we could haveunintentionally introduced some bias to our results bychoosing strips free <strong>of</strong> major defects or peculiarities. Opticalmicrographs <strong>of</strong> <strong>the</strong> films (Figure 1) showed that most <strong>of</strong> <strong>the</strong>back surface <strong>of</strong> <strong>the</strong> films was densely covered with irregularrough bumps or bulges. They are easily detected, since <strong>the</strong>ychange <strong>the</strong> thickness <strong>and</strong> hence <strong>of</strong> <strong>the</strong> color <strong>of</strong> <strong>the</strong> film, in<strong>the</strong> places where <strong>the</strong>y are present. Presumably, <strong>the</strong>se bumpsfill large cavities on <strong>the</strong> support surface, like those seen inFigure 5, <strong>and</strong> it would be useless to scan <strong>the</strong>m. To obtainmeaningful AFM scans, we usually chose more uniform areas,free <strong>of</strong> bumps, presumably where <strong>the</strong> support happened tobe smoo<strong>the</strong>r. In those places, <strong>the</strong> support could indeed havenegligible effect, as it would have to be covered with <strong>the</strong>monomer solution <strong>and</strong> formation <strong>of</strong> dense polymer wouldtake place at some distance from it, as classical works oninterfacial polymerization suggest (27, 28).Relationship between <strong>Swelling</strong> <strong>and</strong> Permeability <strong>of</strong> <strong>the</strong>Membrane. We would like to propose yet ano<strong>the</strong>r way <strong>of</strong>looking at <strong>the</strong> nonuniformity <strong>of</strong> <strong>the</strong> skin by analyzing <strong>the</strong>hydraulic permeability based on swelling <strong>and</strong> thickness data.This analysis relies on <strong>the</strong> observation that <strong>the</strong> dependence<strong>of</strong> <strong>the</strong> intrinsic hydraulic permeability <strong>of</strong> many polymers on<strong>the</strong>ir swelling (in terms <strong>of</strong> equilibrium water volume fraction)follows a general trend: The intrinsic hydraulic permeabilityL pδ is <strong>the</strong> product <strong>of</strong> <strong>the</strong> thickness δ <strong>of</strong> a film <strong>and</strong> its hydraulicpermeability L p, <strong>the</strong> latter being defined from <strong>the</strong> relationshipJ w ) L p∆P, which connects <strong>the</strong> pure water flux through <strong>the</strong>film (membrane) J w to <strong>the</strong> applied trans-membrane pressure∆P (7). For a uniformly swollen homogeneous film L pδ isessentially a property <strong>of</strong> <strong>the</strong> material <strong>and</strong> is independent <strong>of</strong><strong>the</strong> film thickness (7). Since polyamides interact with watermostly via hydrogen bonding (29, 30)sion solvation playinga relatively minor role due to <strong>the</strong> low content <strong>of</strong> <strong>the</strong> fixedcharges (about 2 orders <strong>of</strong> magnitude smaller than in ionicpolymers (4, 31, 32)sit would be better to compare <strong>the</strong>behavior <strong>of</strong> polyamides with hydrogen-bonding hydrophilicpolymers in which <strong>the</strong> nature <strong>of</strong> polymer-water interactionis similar.VOL. 38, NO. 11, 2004 / ENVIRONMENTAL SCIENCE & TECHNOLOGY 9 3173
FIGURE 7. Comparison <strong>of</strong> Meares’ data on <strong>the</strong> intrinsic permeability<strong>of</strong> various nonionic hydrophilic polymers (7) with <strong>the</strong> permeability<strong>of</strong> NF <strong>and</strong> RO membranes. The error bars show st<strong>and</strong>ard deviations.Figure 7 presents <strong>the</strong> results compiled by Meares (7) on<strong>the</strong> permeability <strong>of</strong> homogeneous films <strong>of</strong> various hydrophilicnonionic polymers as a function <strong>of</strong> equilibrium watervolume fraction. Despite <strong>the</strong> scattering, <strong>the</strong> results do indeedfollow a trend. The existence <strong>of</strong> a “universal” trend canbe rationalized by assuming that it represents a purelygeometric r<strong>and</strong>om restriction imposed by <strong>the</strong> matrix on <strong>the</strong>individual or collective motion <strong>of</strong> diluent molecules. Thisassumption presumably holds true as long as (a) <strong>the</strong> motion<strong>of</strong> <strong>the</strong> solvent molecules forming r<strong>and</strong>om “percolationchannels” inside <strong>the</strong> effectively immobile matrix remainsessentially similar to <strong>the</strong> one in a bulk solvent, being restrictedsolely by <strong>the</strong> channel walls, <strong>and</strong> (b) <strong>the</strong> effective pore diameter<strong>of</strong> <strong>the</strong> above-mentioned channels at a given equilibrium watervolume fraction is weakly dependent on <strong>the</strong> chemicalstructure <strong>of</strong> <strong>the</strong> polymer. Obviously, <strong>the</strong>se conjectures arehighly questionable, but <strong>the</strong> data presented in Figure 7 suggest<strong>the</strong>y are approximately correct.Let us now examine where <strong>the</strong> permeability <strong>of</strong> <strong>the</strong>polyamides <strong>of</strong> <strong>the</strong> NF <strong>and</strong> RO membranes are located in <strong>the</strong>plot in Figure 7. We can use <strong>the</strong> permeabilities reported by<strong>the</strong> manufacturer for dilute feeds (14), which also agree wellwith our own measurements <strong>of</strong> water flux in laboratory cells,<strong>and</strong> combine <strong>the</strong>m with our thickness <strong>and</strong> swelling measurements.The values <strong>and</strong> <strong>the</strong> st<strong>and</strong>ard deviations <strong>of</strong> <strong>the</strong>parameter L pδ for <strong>the</strong> membranes are shown in Table 1.Note that since <strong>the</strong> NF membranes showed similar properties,we combined <strong>the</strong>m into a single data set. We can see fromFigure 7 that NF membranes fit <strong>the</strong> general trend well, whichsuggests that <strong>the</strong>ir behavior is not far from that <strong>of</strong> ahomogeneous film. This observation once again suggeststhat <strong>the</strong> nonuniformity <strong>of</strong> NF membranes is not particularlystrong, even though it might indeed be present. Theassumption <strong>of</strong> <strong>the</strong> skin as a uniform layer, though notaccurate, is likely to be sufficiently adequate for practicalconsiderations.FIGURE 8. Effect <strong>of</strong> <strong>the</strong> salinity <strong>and</strong> pH on <strong>the</strong> flux <strong>of</strong> NF-200membrane. Trans-membrane pressure 10 bar. Adapted fromref 33.The data for <strong>the</strong> SWC1 RO membrane are visibly higherthan <strong>the</strong> general trend, <strong>and</strong> for <strong>the</strong> ESPA1 membrane a largedeparture is obvious. We believe that this departure is anindication <strong>of</strong> <strong>the</strong> significant nonuniformity <strong>of</strong> <strong>the</strong> RO membranes:<strong>the</strong> actual thickness <strong>of</strong> <strong>the</strong> dense barrier (whichshould be multiplied by <strong>the</strong> permeability coefficient L p togive <strong>the</strong> intrinsic permeability) is much smaller than <strong>the</strong>superficial overall thickness <strong>of</strong> <strong>the</strong> skin. A “uniform skin”would <strong>the</strong>refore be a very poor model for RO membranes.It should be stressed, however, that <strong>the</strong> present data are stillapproximate <strong>and</strong> that more experimental work is requiredto verify <strong>the</strong>se conclusions.Dependence <strong>of</strong> <strong>the</strong> Permeability <strong>of</strong> <strong>Polyamide</strong> on pH<strong>and</strong> Salinity. In a recent work on <strong>the</strong> separation <strong>of</strong> chargedorganics from highly saline brines with an NF-200 membrane,we encountered a problem <strong>of</strong> substantial decrease <strong>of</strong> <strong>the</strong>flux with increasing feed salinity (33). The salt rejection waslow under <strong>the</strong>se conditions, <strong>and</strong> corrections due to <strong>the</strong>effective reduction <strong>of</strong> <strong>the</strong> trans-membrane pressure by <strong>the</strong>difference in osmotic pressure were insufficient to explainthis effect. Moreover, salinity also increased <strong>the</strong> sensitivity<strong>of</strong> flux to pH. The flux <strong>of</strong> NF membranes for dilute feedsolutions is known to depend only slightly on pH (see Figure8). In contrast, a change <strong>of</strong> pH <strong>of</strong> brines containing 9% saltfrom acidic to basic caused a 2-fold increase in <strong>the</strong> flux (Figure8). It could be argued that concentration polarization couldalso contribute to <strong>the</strong> flux reduction, but it should not change<strong>the</strong> general trend.It was postulated (33) that <strong>the</strong> reduction in flux in brinesresulted from a change in swelling <strong>of</strong> <strong>the</strong> skin in concentratedsolutions. The present method allowed direct testing <strong>of</strong> thispremise. To enhance <strong>the</strong> effect, we chose to use 15% saltsolutionssra<strong>the</strong>r than <strong>the</strong> 9% brine used in permeationTABLE 2. <strong>Swelling</strong> <strong>and</strong> Flux <strong>of</strong> NF-200 Membrane in Different Feed Solutionsthickness (nm)swelling (%, wet basis)solution dominant average dominant averagemeasured flux(L m -2 h -1 )(∆P ) 10 bar)dry film 30.2 32.215% NaCl, pH 3 35.8 39.4 15.6 18.3 10 (9% NaCl, pH 3)15% NaCl, pH 10 a 37.1 42.3 18.6 23.9 23 (9% NaCl, pH 9)pure (DI) water, pH 7 38.1 44.0 b 20.7 26.8 69 (water, pH 7)aThe area at <strong>the</strong> right edge <strong>of</strong> <strong>the</strong> strip lifted by <strong>the</strong> tip was excluded (Figure 4d). b Areas higher than 100 nm were excluded.3174 9 ENVIRONMENTAL SCIENCE & TECHNOLOGY / VOL. 38, NO. 11, 2004
experimentss<strong>and</strong> a higher pH value (10) on <strong>the</strong> basic side<strong>of</strong> <strong>the</strong> pH range. Figure 4 shows <strong>the</strong> images <strong>of</strong> <strong>the</strong> sameNF-200 film under four different conditions, <strong>and</strong> Table 2summarizes <strong>the</strong> calculations <strong>of</strong> swelling.It may be seen that, irrespective <strong>of</strong> <strong>the</strong> way <strong>the</strong> swellingis calculated (dominant or average), <strong>the</strong> increase <strong>of</strong> swellingin <strong>the</strong> order acidic brine-basic brine-pure water is readilyevident. Enhanced swelling <strong>of</strong> <strong>the</strong> more elevated looser partsmakes this increase clearly visible in <strong>the</strong> images shown inFigure 4. We see that changes in swelling <strong>and</strong> flux with salinity<strong>and</strong> pH are in close correspondence (Table 2). Obviously,<strong>the</strong> permeability changes more markedly, as expected from<strong>the</strong> steep rise <strong>of</strong> permeability with water content in Figure7 (<strong>the</strong> dependence is close to a power law with an exponentequal to about 5). These data seem to support <strong>the</strong> connectionbetween <strong>the</strong> swelling <strong>and</strong> <strong>the</strong> flux <strong>of</strong> NF membranes. Finally,it is worth mentioning that we were unable to detect anysignificant change <strong>of</strong> swelling in similar experiments withRO membranes, which seems be ano<strong>the</strong>r indication <strong>of</strong> <strong>the</strong>exceptionally high rigidity <strong>of</strong> <strong>the</strong> fully aromatic RO polyamide.AcknowledgmentsThe kind help <strong>of</strong> Mr. Juergen Jopp <strong>and</strong> Ms. Roxana Golan <strong>of</strong><strong>the</strong> Minerva Center at BGU in performing AFM measurements<strong>and</strong> interpreting <strong>the</strong> results is gratefully acknowledged.The author thanks Pr<strong>of</strong>. Ora Kedem, Dr. S<strong>of</strong>ia Belfer, <strong>and</strong> Dr.Charles Linder for stimulating discussions <strong>and</strong> valuablecomments.Literature Cited(1) Cadotte, J. E.; King, R. S.; Majerle, R. J.; Petersen, R. J. J. Macromol.Sci. Chem. 1981, A15, 727.(2) Petersen, R. J. J. Membr. Sci. 1993, 83, 81.(3) Linder, C.; Kedem, O. In Nan<strong>of</strong>iltration Principles <strong>and</strong> Applications;Schaefer, A. I., Fane, A. G., Waite, T. D., Eds.; Elsevier:Amsterdam, 2002.(4) Freger, V.; Srebnik, S. J. Appl. Polym. Sci. 2003, 88, 1162.(5) Freger, V. Langmuir 2003, 19, 4791(6) Crank, J.; Park, G. S. Diffusion in Polymers; Academic Press:London, 1975.(7) Meares, P. Philos. Trans. R. Soc. London, B 1977, 278, 113.(8) Muhr, A. H.; Blanshard, J. M. V. Polymer 1982, 23, 1012.(9) Mulder, M. Basic Principles <strong>of</strong> Membrane Technology; KluwerAcademic Publishers: Dordrecht, The Ne<strong>the</strong>rl<strong>and</strong>s, 1991.(10) Aharony, S. M. J. Appl. Polym. Sci. 1992, 45, 813.(11) Wasserman, A.; Oren, Y.; Freger, V. Manuscript in preparation.(12) Bowen, W. R.; Doneva, T. A. J. Colloid Interface Sci. 2000, 229,544.(13) Bowen, W. R.; Doneva, T. A.; Stoton, J. A. G. Colloids Surf. A2002, 201, 73.(14) Nanotec Electronica. Homepage; www.nanotec.es. AccessedDecember 11, 2003).(15) The Dow Chemical Company. www.dow.com/liquidseps; Hydranautics,A Nitto Denko Company. www.membranes.com.(16) Aharoni, S. M.; Edwards, S. F. Adv. Polym. Sci. 1994, 118, 1.(17) Hirose, M.; Minamizaki, Y.; Kamiyama, Y. J. Membr. Sci. 1997,123, 151.(18) Arthur, S. D. J. Membr. Sci. 1989, 46, 243.(19) Clifford, J. In Water in Disperse Systems; Franks, F., Ed.; Plenum:New York <strong>and</strong> London, 1975; pp 75-132.(20) Sundet S. A. J. Membr. Sci. 1993, 76, 175.(21) Zhu, X.; Elimelech, M. Environ. Sci. Technol. 1997, 31, 3654.(22) Kwak, S. Y.; Ihm, D. W. J. Membr. Sci. 1999, 158, 143.(23) Bowen, W. R.; Doneva, T. A.; Stoton, J. A. G. Colloids Surf. A2002, 201, 73.(24) Vrijenhoek, E. M.; Hong, S.; Elimelech, M. J. Membr. Sci. 2001,188, 115.(25) Kwak, S.-Y.; Jung, S. G.; Yoon, Y. S. Environ. Sci. Technol. 2001,35, 4334.(26) Hirose, M.; Ito, H.; Masatoshi, S.; Tanaka, K. U.S. Patent5 614 099, 1997.(27) Morgan, P. W. Condensation Polymers: By Interfacial <strong>and</strong>Solution Methods; Interscience: New York, 1965(28) Nikonov, V. Z.; Savinov, V. M. In Interfacial Syn<strong>the</strong>sis, Vol. 2;Millich, F.; Carraher, C. R., Jr., Eds.; Marcel Dekker: New York,1977.(29) Starkwea<strong>the</strong>r, H. W. In Water in Polymers; Rowl<strong>and</strong>, S. P., Ed.;ACS Symposium Series 127; American Chemical Society: Washington,DC, 1980.(30) Loo, L. S.; Cohen, R. E.; Gleason K. K. Macromolecules 1998, 31,8907.(31) Childress, A. E.; Elimelech, M. Environ. Sci. Technol. 2000, 34,3710.(32) Schaep, J.; V<strong>and</strong>ecasteele, C. J. Membr. Sci. 2001, 188, 129.(33) Freger, V.; Arnot, T. C.; Howell, J. A. J. Membr. Sci. 2000, 178,185.Received for review July 24, 2003. Revised manuscript receivedDecember 15, 2003. Accepted March 8, 2004.ES034815UVOL. 38, NO. 11, 2004 / ENVIRONMENTAL SCIENCE & TECHNOLOGY 9 3175