CHAPTER 4 – ESTABLISHING A RELATIONSHIP BETWEEN ...
CHAPTER 4 – ESTABLISHING A RELATIONSHIP BETWEEN ...
CHAPTER 4 – ESTABLISHING A RELATIONSHIP BETWEEN ...

Create successful ePaper yourself
Turn your PDF publications into a flip-book with our unique Google optimized e-Paper software.
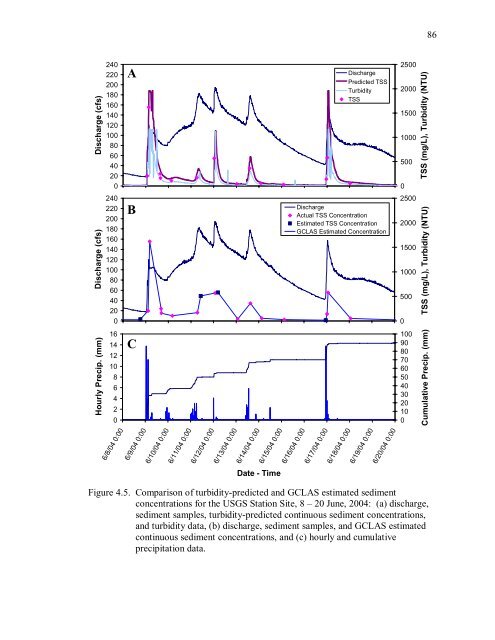
86Discharge (cfs)240220200180160140120100806040200ADischargePredicted TSSTurbidityTSS25002000150010005000TSS (mg/L), Turbidity (NTU)Discharge (cfs)240220200180160140120100806040200BDischargeActual TSS ConcentrationEstimated TSS ConcentrationGCLAS Estimated Concentration25002000150010005000TSS (mg/L), Turbidity (NTU)Hourly Precip. (mm)1614121086420C1009080706050403020100Cumulative Precip. (mm)Cumulative Precip. (mm)6/8/04 0:006/9/04 0:006/10/04 0:006/11/04 0:006/12/04 0:006/13/04 0:006/14/04 0:006/15/04 0:006/16/04 0:006/17/04 0:006/18/04 0:006/19/04 0:006/20/04 0:00Date - TimeFigure 4.5. Comparison of turbidity-predicted and GCLAS estimated sedimentconcentrations for the USGS Station Site, 8 <strong>–</strong> 20 June, 2004: (a) discharge,sediment samples, turbidity-predicted continuous sediment concentrations,and turbidity data, (b) discharge, sediment samples, and GCLAS estimatedcontinuous sediment concentrations, and (c) hourly and cumulativeprecipitation data.