CHAPTER 4 – ESTABLISHING A RELATIONSHIP BETWEEN ...
CHAPTER 4 – ESTABLISHING A RELATIONSHIP BETWEEN ...
CHAPTER 4 – ESTABLISHING A RELATIONSHIP BETWEEN ...

You also want an ePaper? Increase the reach of your titles
YUMPU automatically turns print PDFs into web optimized ePapers that Google loves.
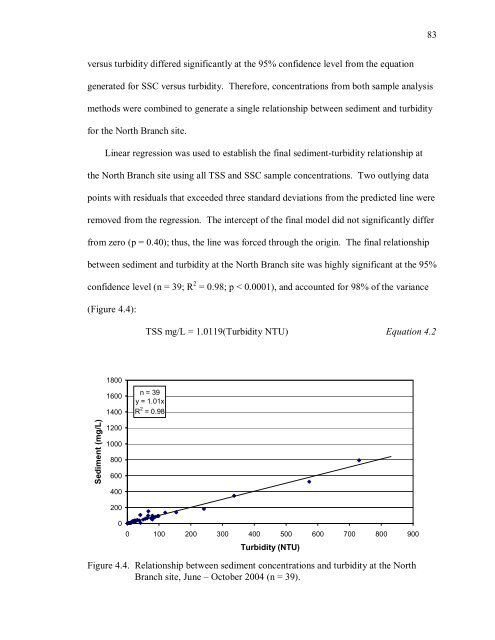
83versus turbidity differed significantly at the 95% confidence level from the equationgenerated for SSC versus turbidity. Therefore, concentrations from both sample analysismethods were combined to generate a single relationship between sediment and turbidityfor the North Branch site.Linear regression was used to establish the final sediment-turbidity relationship atthe North Branch site using all TSS and SSC sample concentrations. Two outlying datapoints with residuals that exceeded three standard deviations from the predicted line wereremoved from the regression. The intercept of the final model did not significantly differfrom zero (p = 0.40); thus, the line was forced through the origin. The final relationshipbetween sediment and turbidity at the North Branch site was highly significant at the 95%confidence level (n = 39; R 2 = 0.98; p < 0.0001), and accounted for 98% of the variance(Figure 4.4):TSS mg/L = 1.0119(Turbidity NTU) Equation 4.2180016001400n = 39y = 1.01xR 2 = 0.98Sediment (mg/L)1200100080060040020000 100 200 300 400 500 600 700 800 900Turbidity (NTU)Figure 4.4. Relationship between sediment concentrations and turbidity at the NorthBranch site, June <strong>–</strong> October 2004 (n = 39).