2007 - Central Bank of Trinidad and Tobago
2007 - Central Bank of Trinidad and Tobago
2007 - Central Bank of Trinidad and Tobago

Create successful ePaper yourself
Turn your PDF publications into a flip-book with our unique Google optimized e-Paper software.
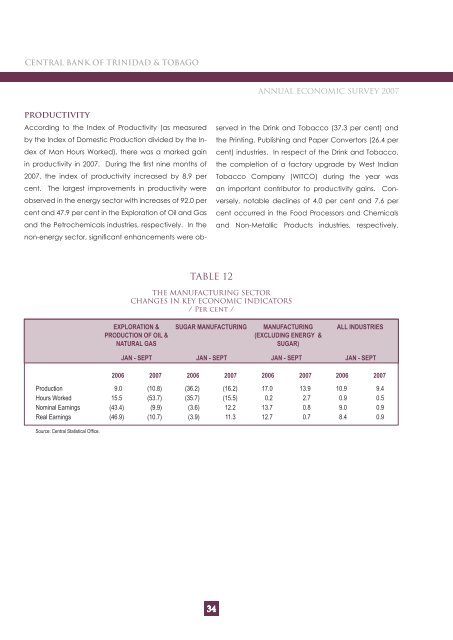
CENTRAL BANK OF TRINIDAD & TOBAGOANNUAL ECONOMIC SURVEY <strong>2007</strong>PRODUCTIVITYAccording to the Index <strong>of</strong> Productivity (as measuredby the Index <strong>of</strong> Domestic Production divided by the Index<strong>of</strong> Man Hours Worked), there was a marked gainin productivity in <strong>2007</strong>. During the first nine months <strong>of</strong><strong>2007</strong>, the index <strong>of</strong> productivity increased by 8.9 percent. The largest improvements in productivity wereobserved in the energy sector with increases <strong>of</strong> 92.0 percent <strong>and</strong> 47.9 per cent in the Exploration <strong>of</strong> Oil <strong>and</strong> Gas<strong>and</strong> the Petrochemicals industries, respectively. In thenon-energy sector, significant enhancements were observedin the Drink <strong>and</strong> Tobacco (37.3 per cent) <strong>and</strong>the Printing, Publishing <strong>and</strong> Paper Convertors (26.4 percent) industries. In respect <strong>of</strong> the Drink <strong>and</strong> Tobacco,the completion <strong>of</strong> a factory upgrade by West IndianTobacco Company (WITCO) during the year wasan important contributor to productivity gains. Conversely,notable declines <strong>of</strong> 4.0 per cent <strong>and</strong> 7.6 percent occurred in the Food Processors <strong>and</strong> Chemicals<strong>and</strong> Non-Metallic Products industries, respectively.TABLE 12THE MANUFACTURING SECTORCHANGES IN KEY ECONOMIC INDICATORS/ Per cent /EXPLORATION &PRODUCTION OF OIL &NATURAL GASSUGAR MANUFACTURINGMANUFACTURING(EXCLUDING ENERGY &SUGAR)ALL INDUSTRIESJAN - SEPTJAN - SEPT JAN - SEPT JAN - SEPT2006 <strong>2007</strong> 2006 <strong>2007</strong> 2006 <strong>2007</strong>2006<strong>2007</strong>ProductionHours WorkedNominal EarningsReal Earnings9.015.5(43.4)(46.9)(10.8)(53.7)(9.9)(10.7)(36.2)(35.7)(3.6)(3.9)(16.2)(15.5)12.211.317.00.213.712.713.92.70.80.710.90.99.08.49.40.50.90.9Source: <strong>Central</strong> Statistical Office.34